www.hydrol-earth-syst-sci.net/18/4601/2014/ doi:10.5194/hess-18-4601-2014
© Author(s) 2014. CC Attribution 3.0 License.
Application of MODIS snow cover products: wildfire impacts on
snow and melt in the Sierra Nevada
P. D. Micheletty1, A. M. Kinoshita2,*, and T. S. Hogue1,2
1Hydrologic Sciences and Engineering, Colorado School of Mines, Golden, CO 80401, USA
2Department of Civil and Environmental Engineering, Colorado School of Mines, Golden, CO 80401, USA *now at: Department of Civil, Construction, and Environmental Engineering, San Diego State University, San Diego, CA, USA
Correspondence to:T. S. Hogue ([email protected])
Received: 14 May 2014 – Published in Hydrol. Earth Syst. Sci. Discuss.: 4 July 2014 Revised: – – Accepted: 13 October 2014 – Published: 24 November 2014
Abstract. The current work evaluates the spatial and tem-poral variability in snow after a large forest fire in north-ern California using Moderate Resolution Imaging Spec-troradiometer (MODIS) snow-covered area and grain size (MODSCAG). MODIS MOD10A1 fractional snow-covered area and MODSCAG fractional snow cover products are utilized to detect spatial and temporal changes in snow-pack after the 2007 Moonlight Fire and an unburned basin, Grizzly Ridge, for water years (WY) 2002–2012. Estimates of canopy-adjusted and non-adjusted MODSCAG fractional snow-covered area (fSCA) are smoothed and interpolated to provide a continuous time series of average daily snow ex-tent over the two basins. The removal of overstory canopy by wildfire exposes more snow cover; however, elemen-tal pixel comparisons and statistical analysis show that the MOD10A1 product has a tendency to overestimate snow coverage pre-fire, muting the observed effects of wildfire. The MODSCAG algorithm better distinguishes subpixel snow coverage in forested areas and is highly correlated to soil burn severity after the fire. Annual MODSCAG fSCA estimates show statistically significant increased fSCA in the Moonlight Fire study area after the fire (P <0.01 for WY 2008–2011) compared to pre-fire averages and the control basin. After the fire, the number of days exceeding a pre-fire high snow-cover threshold increased by 81 %. Canopy reduc-tion increases exposed viewable snow area and the amount of solar radiation that reaches the snowpack, leading to ear-lier basin average melt-out dates compared to the nearby un-burned basin. There is also a significant increase in MOD-SCAG fSCA post-fire regardless of slope or burn severity.
Regional snow cover change has significant implications for both short- and long-term water supply for impacted ecosys-tems, downstream communities, and resource managers.
1 Introduction
Field-based studies have found that disturbance of forest structure considerably impacts snow accumulation and melt properties, altering water yield from snow-dominated basins (Kattelmann et al., 1983; Stednick, 1996; Faria et al., 2000; Stephens et al., 2012; Webb et al., 2012). Post-fire changes in snowpack energy balance include increased exposure to radi-ation, decreased snow albedo due to surface alterations from charred soils, dust, or vegetation, and changes in soil temper-ature (Painter et al., 2007; Burles and Boon, 2011; Ebel et al., 2012; Gleason et al., 2013; Harpold et al., 2013). The op-posing effects of increased snow accumulation and increased snow ablation have been documented at the plot scale for the first year following a wildfire (Gleason et al., 2013; Harpold et al., 2013). Plot-scale studies generally reported significant increases in snow accumulation in burned areas compared to nearby control plots due to the lack of canopy interception (Burles and Boon, 2011; Harpold et al., 2013). Decreased canopy cover reduces snow interception, increases solar radi-ation exposure, and alters sublimradi-ation of the exposed snow-pack (Faria et al., 2000; Varhola et al., 2010; Harpold et al., 2013). Harpold et al. (2013) showed winter season ablation reduced snowpack depths by 50 % prior to melting and a 10 % reduction in snow water equivalent in burned areas the first year after a fire. Gleason et al. (2013) showed a 40 % decrease in snow albedo accompanied by a 200 % increase in net shortwave radiation in burned forest plots compared to unburned forests. However, effects are undocumented at the watershed scale and there is a paucity of studies on snow accumulation and melt variability from forest cover change (Varhola et al., 2010).
Remote sensing products, including NASA Moderate Res-olution Imaging Spectroradiometer (MODIS) MOD10A1 and MODIS snow-covered area and grain size (MODSCAG), a spectral mixing product, provide the spatial and tempo-ral resolution necessary for monitoring large-scale wildfires that often impact inaccessible and ungaged snow-dominated basins. To our knowledge, no study has investigated pre-fire and post-fire snow cover change using satellite imagery. The current study facilitates identification of remote sensing tools capable of detecting spatial and temporal changes in post-fire snowpack through application of MODIS MOD10A1 and MODSCAG fractional snow-covered area (fSCA) products to the 2007 Moonlight Fire in the northern Sierra Nevada, California. Specifically, the objectives of our work are to (1) understand spatial and temporal variability of pre- and post-fire fSCA with MODIS (MOD10A1 and MODSCAG) products; (2) compare MOD10A1 and MODSCAG products in pre- and post-fire conditions to determine which product is more suitable for identifying change in snow-covered area (SCA) after fire; (3) investigate the influence of aspect, burn severity, and general climate patterns on post-fire snow be-havior (using fSCA as a proxy); (4) evaluate post-fire recov-ery patterns in a snow-dominated basin over several years.
Figure 1.Map of the Moonlight Fire burned area with soil burn severity and control basin Grizzly Ridge.
2 Study areas 2.1 Moonlight Fire
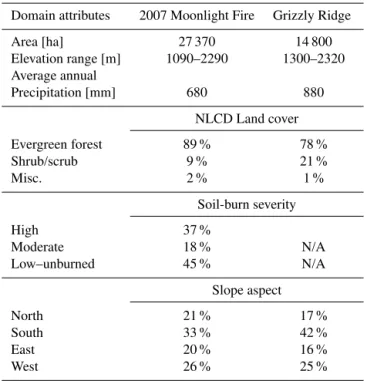
There is a statistically significant (P <0.05) increase in to-tal annual area burned in the Sierra Nevada from the 1980s to the present. The decadal average of annual burned area in-creased from 300 in the 1980s to a current 900 km2 in the 2010s (Wildland Fire Incidents, 2013). The Moonlight Fire burned over 250 km2(27 370 ha) in the Plumas National For-est (about 190 km north of Sacramento) from 3 to 15 Septem-ber 2007 on the eastern side of the northern Sierra Nevada divide (Fig. 1). Since the late 1800s this was the first ma-jor wildfire recorded in this area (California Department of Forestry and Fire Protection, 2012). Steep terrain and high winds caused a mosaic of soil burn severities resulting in con-centrated areas of highly burned areas surrounded by moder-ately to low unburned areas (USDA Forest Service RSAC, 2007; Fig. 1). Pre-fire vegetation consisted of mostly ever-green forest (90 %) with some riparian and shrub/scrub ar-eas (Fry et al., 2011; Table 1). The slope aspects within the Moonlight Fire are relatively evenly distributed (Table 1). The Moonlight Fire burn area has an elevation range of 1090 to 2290 m and receives an average of 680 mm of precipita-tion a year, the majority of which falls in the winter months as snow (Table 1).
2.2 Grizzly Ridge
Table 1. Domain attributes for the Moonlight Fire and Grizzly Ridge.
Domain attributes 2007 Moonlight Fire Grizzly Ridge
Area [ha] 27 370 14 800
Elevation range [m] 1090–2290 1300–2320 Average annual
Precipitation [mm] 680 880
NLCD Land cover
Evergreen forest 89 % 78 %
Shrub/scrub 9 % 21 %
Misc. 2 % 1 %
Soil-burn severity
High 37 %
Moderate 18 % N/A
Low–unburned 45 % N/A
Slope aspect
North 21 % 17 %
South 33 % 42 %
East 20 % 16 %
West 26 % 25 %
Sierra Nevada divide (Fig. 1). Vegetation within the Grizzly Ridge area is comprised of mostly evergreen forest (80 %) and shrub/scrub in the lower elevations (Fry et al., 2011; Ta-ble 1). The slope aspects exhibits similar patterns as Moon-light Fire, although Grizzly Ridge has roughly 10 % more south-facing slopes (Table 1). The Grizzly Ridge area has an elevation range of 1300–2320 m and receives an annual basin average of 880 mm of precipitation.
3 Methods
MODIS MOD10A1 and MODSCAG products were gath-ered for both the area of the Moonlight Fire and Grizzly Ridge from 1 October 2001 to 30 September 2012 (water year (WY) 2002–2012). Both products only identify areas covered by snow, not snowpack depth – a longer snow sea-son will distinguish more fSCA, but not depth changes or snow water equivalent. Annual and monthly precipitation and maximum and minimum temperatures for the Moon-light Fire area and Grizzly Ridge were estimated from the Parameter-elevation Regressions on Independent Slopes Model (PRISM) climate data set (Daly, 1994, 1997, 2002). Conterminous US products are downloaded from the PRISM Climate Group (http://www.prism.oregonstate.edu/) and the monthly 4 km pixels are extracted within the Moonlight Fire area and Grizzly Ridge and averaged over both domains for WY 2002–2012.
3.1 Remote sensing products 3.1.1 MODIS MOD10A1
The Terra MODIS SCA product (MOD10A1) provides at-mospherically corrected daily fractional snow cover at 500 m spatial resolution based on the normalized difference snow index (NDSI). The preprocessed MODIS product includes spectral thresholds that mask and screen for clouds and low-reflectance surfaces such as water (Salomonson and Ap-pel, 2004). To account for snow in densely vegetated areas, Klein et al. (1998) developed a method that uses a com-bined snow reflectance model and canopy reflectance model to map more snow in forested areas using normalized NDSI and the normalized difference vegetation index (NDVI; Klein et al., 1998). The NDVI normalizes reflectance in the near-infrared and visible (red) wavelengths to differentiate vege-tation where there is chlorophyll absorption of red light for photosynthesis and reflection of near-infrared light (Tucker, 1979):
NDVI=RNIR−RVIS
RNIR+RVIS, (1)
where RNIR is near-infrared reflectance and RVIS is red re-flectance in the visible spectrum. The NDSI is evaluated as (Dozier, 1989)
NDSI=RVIS−RSWIR
RVIS+RSWIR, (2)
whereR represents spectral reflectances in the visible and shortwave infrared bands. The vegetation correction is used to map snow when NDSI < 0.4 and NDVI > 0.1.
Version 5 of MOD10A1 contains a daily, 500 m frac-tional snow-covered area product available from 2000 to the present (Hall et al., 2006). MOD10A1 fSCA is based on an empirical snow-mapping algorithm developed from a linear regression between binary Landsat Thematic Mapper snow cover and MODIS NDSI (Salomonson and Appel, 2004; Hall et al., 2006):
fSCA= −0.01+1.45NDSI. (3)
This algorithm is used to map fractional snow cover and performs relatively well in the winter months in mountain-ous regions compared to other remote sensing products and ground-based observations (Maurer et al., 2003; Pu et al., 2007).
3.1.2 MODSCAG
observations (Painter et al., 2009). The MODSCAG algo-rithm solves a combination of linear equations to identify the best mixture of endmember components that make up the surface reflectance of a pixel from the MODIS atmo-spherically corrected surface spectral-reflectance product, MOD09GA (Painter et al., 2009):
RS,λ= X
k
FkRλ,k+ελ, (4)
whereRS,λis the average surface reflectance from MODIS in wavelengthλ,Fk is the fraction of endmemberk(snow, vegetation, soil, rock, etc.), Rλ,k is the surface reflectance of endmemberkin wavelength band λ, andελ is the resid-ual error at λ for all endmembers. Non-snow endmembers are gathered from a library of hyperspectral field and labora-tory observations. MODSCAG uses a library of spectral flectances generated from the hemispherical–directional re-flectance factor with a discrete-ordinates radiative transfer model to identify snow endmembers (Painter et al., 2009). This method utilizes the shape of the snow’s spectrum rather than absolute reflectance. A simultaneous solution of sub-pixel snow surface grain size and fractional snow cover is necessary, assuming that spectral reflectance of snow end-members are sensitive to surface grain size.
MODSCAG analyzes the linear mixtures of endmember spectral libraries and selects the optimal model with the smallest error relative to MOD09GA surface reflectance and the fewest number of endmembers. If snow endmembers are identified, MODSCAG will attribute a snow-covered area and grain size based on the fraction of the snow endmember in the pixel. The MODSCAG snow-mapping algorithm for fSCA results in an average root-mean-square error (RMSE) of∼5 % (Rittger et al., 2013). MODSCAG shows less sen-sitivity to regional canopy cover and is noted to more accu-rately identify snow cover throughout the year compared to MOD10A1 (Rittger et al., 2013). The current study incorpo-rates MODSCAG to evaluate pre- and post-fire snow-covered area relative to the MOD10A1 product for the Moonlight Fire area and Grizzly Ridge.
3.1.3 Canopy adjustment
Forest canopy obstructs the view of the ground by MODIS, causing underestimates of snow cover in dense forests (Raleigh et al., 2013). Hence, forest cover density data are used to indicate snow cover masked by canopy and improve MODSCAG estimates of viewable snow cover (Molotch and Margulis, 2008):
fSCAAdj=
fSCAOb
1−fVeg, (5)
where fSCAob is the observed MODSCAG fSCA and fVeg is the annual density of forest cover or the fraction of vegetation. For 2000 to 2010 fVeg is estimated from the MODIS (MOD44B) percent tree cover product (DiMiceli et
al., 2011). The percent tree cover product from MOD44B is derived from annual composites of MODIS data using an automated supervised regression tree algorithm and is available for the years 2000–2010. The MOD44B product is updated annually and has been used extensively to in-vestigate land cover change and forest disturbance (Hansen et al., 2003; Morton et al., 2005). For the years 2011 and 2012 the MODSCAG fraction of vegetation product is used to estimate fVeg. For consistency, 2011 and 2012 MOD-SCAG fraction of vegetation is adjusted based on a linear regression of annual composites of MODSCAG fraction of vegetation and MOD44B percent tree cover. The canopy-adjusted fSCA (Eq. 5) assumes that the distribution of snow under a canopy is equivalent to viewable open areas between trees or in clearings. This assumption that spatial distribu-tion of snow in viewable gaps can be interpolated to nearby canopied forests is not as reliable during the accumulation and melt periods (Raleigh et al., 2013). A rigorous correc-tion to improve estimacorrec-tions of snow under a canopy using optical sensors remains an area of active research for remote sensing in forested terrains and is outside the scope of this study. In the current study, MODSCAG fSCA is adjusted for canopy cover (Eq. 5), whereas the MOD10A1 SCA is dis-tributed with vegetation-corrected fSCA (Klein et al., 1998) and does not require further modification.
3.2 Spatial and temporal analysis 3.2.1 Basin fSCA interpolation
Temporal analysis for WY 2002–2012 uses daily basin-averaged MODSCAG fSCA for both the Moonlight Fire area and Grizzly Ridge. The daily data initially have gaps and er-rors from cloud cover, sensor viewing geometry, or imperfec-tions in the retrieval algorithm. A combination of noise filter-ing, snow/cloud discrimination, interpolation, and smooth-ing improves the MODSCAG daily snow cover time series (Dozier et al., 2008). Dozier et al. (2008) view the snow data as a space–time cube that can be filtered, smoothed, and in-terpolated. In the current study, the space–time cube is fil-tered to remove cloudy or noisy values; the remaining data are used to interpolate and smooth gaps within the cube.
using a cubic smoothing spline (Matlab csaps function). The current study uses 16 days (representing a MODIS viewing angle cycle) for the limits of integration; the smoothing pa-rameter is adaptive and varies spatially depending on the ex-tent of cloud cover or missing data. The weight varies from 0 to 1 and is based on the viewing angle (determined from the corresponding MOD09GA) such that the near-nadir views have the greatest weights. If the cubic smoothing spline yields unrealistic values from gaps in data, the smoothed fSCA values are interpolated using a piecewise interpolant; (4) after steps 1–3 the whole cube is smoothed with a Gaus-sian filter, providing a continuous data stream of the snow-covered area.
3.2.2 Elemental pixel comparison
Difference maps for each gridded fSCA product, MOD10A1 and MODSCAG, are developed by taking the difference be-tween winter (January–March) pre-fire average fSCA (WY 2002–2007) and post-fire average fSCA (WY 2008–2012); the domain includes 1099 pixels. The difference maps (1fSCA) are used to detect spatial changes in viewable snow cover after the fire. An elemental pixel comparison (EPC) between MODSCAG fSCA and MOD10A1 fSCA is evalu-ated using a least-squares linear regression analysis of indi-vidual pre- and post-fire winter pixels. EPC is also used to investigate temporal changes in snow cover based on corre-sponding basin attributes including burn severity and slope aspect. Gridded daily fSCA is disaggregated over each do-main by slope aspects (north, south, east, and west) derived from a USGS National Elevation Dataset 30 m digital eleva-tion model. Daily basin average estimates are then produced for each slope aspect for WY 2002 to 2012 for Grizzly Ridge and the Moonlight Fire region. For the Moonlight Fire re-gion, daily fSCA was also disaggregated to match a 30 m soil burn severity map (based on Landsat burned area reflectance from the USDA Forest Service RSAC, 2007) for EPC. A time series of basin-averaged fSCA is made based on each burn severity (i.e., high, moderate, and low unburned) from WY 2002 to 2012 for statistical analysis.
3.3 Statistical analysis
3.3.1 MODSCAG cumulative distribution function Annual cumulative distribution functions (CDFs) are devel-oped using daily basin-averaged fSCA for both the area of the Moonlight Fire and Grizzly Ridge to investigate annual shifts in snow cover after fire. Fractional SCA cumulative distribution functions are similar to flow duration curves, which are used to investigate annual changes in flow regimes due to forest disturbance (Lane et al., 2006; Brown et al., 2005). Fractional SCA CDFs are used to determine the prob-ability of a specific basin-averaged fSCA being equaled or exceeded during a given time period. Exceedance
probabil-ities are derived from the pre-fire MODSCAG fSCA CDF curves and are used to establish high and low thresholds for analysis. High snow-cover days are defined based on the pre-fire long-term CDFs with an exceedance probability of 10 % or less.
During the beginning and end of the snow season, as MODSCAG and MOD10A1 pixels approach an fSCA value of 15 % (very low fractional snow-covered area), there is in-creased uncertainty and larger errors in positively identifying snow (Rittger et al., 2013). This study uses an exceedance probability of 70 % (representing 10 % basin-averaged snow cover) to identify an unbiased low SCA melt-out thresh-old and reduce error from misidentification of snow. This 70 % exceedance probability threshold commonly represents lower quartiles in CDFs and also corresponds to the most widely used definition of low flow as derived from flow-duration curves (70–99 %; Smakhtin, 2001).
To quantify the change from pre-fire to post-fire a two-sample Kolmogorov–Smirnov (KS) test is used to compare the distributions of pre- and post-fire fSCA CDFs. The KS null hypothesis is that the pre- and post-fire fSCA CDFs are from the same continuous distribution atα=0.01 (Massey, 1951), where the KS test statistic is the maximum vertical distance between the two curves being evaluated (Cowpert-wait et al., 2013).
3.3.2 Analysis of variance
Analysis of variance (ANOVA) is used to determine the sta-tistical significance of temporal changes in snow cover after the fire. Daily basin-averaged fSCA estimates are separated annually based on the water year, excluding summer months (July–September), and by basin attributes (burn severity and slope aspect). The fSCA is then evaluated for statistical dif-ferences from the pre-fire period and compared to the control domain (Grizzly Ridge). The null hypothesis that the mean of each post-fire annual fSCA (WY 2008–2012) is similar to the pre-fire annual mean (WY 2002–2007) is tested atα=0.01.
4 Results
4.1 MODSCAG and MOD10A1 comparison
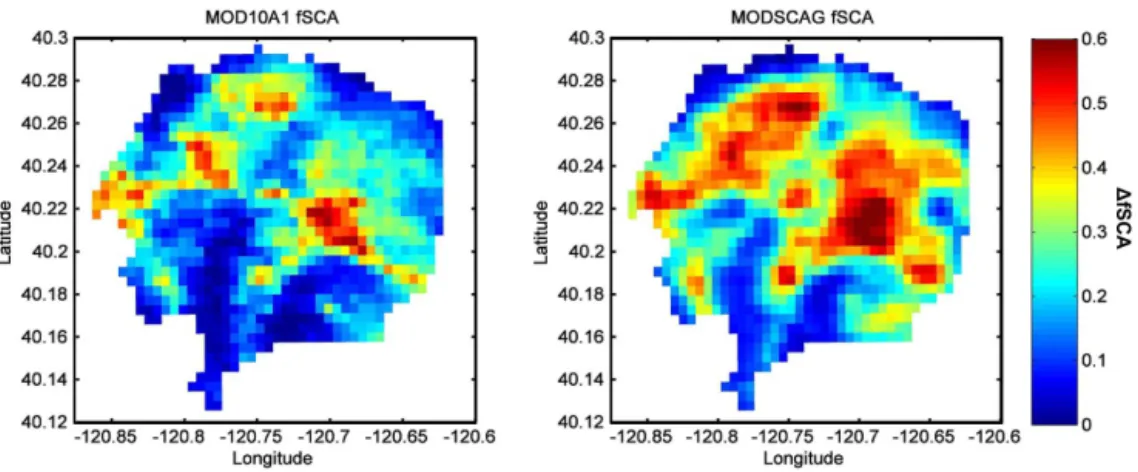
Figure 2.Pre- and post-fire MOD10A1 fSCA (left) and non-canopy-adjusted MODSCAG fSCA (right) difference maps for winter (January– March) over the region of the Moonlight Fire. Each image contains 1099 pixels.
MODSCAG has a basin average increase in fSCA of 0.3 (Fig. 2, right) after the fire, whereas MOD10A1 displays smaller differences throughout the burned domain and in-creases on average by 0.2 (Fig. 2, left). For the MOD-SCAG product, 44 % of the Moonlight Fire domain exhibited 1fSCA values of least 0.3, while MOD10A1 has 21 % of the domain with values of 0.3 or higher.
The least-squared linear regression analysis of MOD10A1 fSCA and MODSCAG fSCA established from the EPC shows a distinct difference between pre- and post-fire cor-relation (Fig. 3). MOD10A1 tends to produce higher esti-mates of fSCA compared to MODSCAG across the entire do-main pre- and post-fire. MOD10A1 is biased high compared to MODSCAG, but the pre-fire linear correlation between the two products is relatively high (r=0.85). After the fire there is an increase in variability and the linear relationship between MOD10A1 and MODSCAG decreases (r=0.69). The linear regression line is also higher post-fire (Fig. 3). The upward shift in the regression line in the MODSCAG direc-tion is consistent with the increase in visible fSCA (Fig. 2). Decreases in the correlation coefficient after the fire are most likely due to differences in the amount of increased fSCA identified by each product.
Product assessment studies have shown that MOD10A1 fSCA overestimates snow cover in densely vegetated ar-eas (Rittger et al., 2013). These results are consistent with our linear regression analysis. This can be attributed to the MOD10A1 snow-mapping algorithm and NDVI thresh-old indices (Klein et al., 1998) that are used to identify snow in forested areas. NDVI is a greenness index based on surface reflectance and does not differentiate vegetation types. Therefore, the current NDVI threshold (> 0.1) in-creases mapped snow cover in areas with shrubs and grasses just as it does for forested areas. Reduced canopy cover from wildfire should lead to increased viewable snow cover from satellite observations. Due to overestimates in SCA before the fire, this signal is muted in MOD10A1. The EPC
re-Figure 3.Least-squared linear regression analysis of MOD10A1 and non-adjusted MODSCAG over the Moonlight Fire domain pre-(black circles) and post-fire (red diamonds).
sults prompted the utilization of MODSCAG fSCA for the remainder of the current study because of the overestima-tion biases associated with the MOD10A1 fSCA product as well as its lower spatial correlation to soil burn severity. The combination of these results and MODSCAG’s more rigor-ous snow-mapping algorithm, which also takes into account snow grain size, provides us with higher confidence in the pre- and post-fire fSCA estimates that will be used for fur-ther analysis.
4.2 MODSCAG time series analysis
Figure 4.Time series of PRISM monthly precipitation totals, minimum and maximum temperatures, and daily basin-averaged MODSCAG fSCA for the Moonlight Fire domain(a)and Grizzly Ridge(b)for WY 2002 to 2012.
is 900 mm. Post-fire annual precipitation totals are less for both the Moonlight Fire region and Grizzly Ridge (560 and 800 mm, respectively). Temperature trends for each domain are very similar, with the region of the Moonlight Fire and Grizzly Ridge averaging around 9◦
C before the fire and 8◦
C after. Over the 10-year time series the fSCA ensembles are more sensitive to the duration of the winter precipitation sea-son (seasea-son in which precipitation occurred at temperatures below 0◦
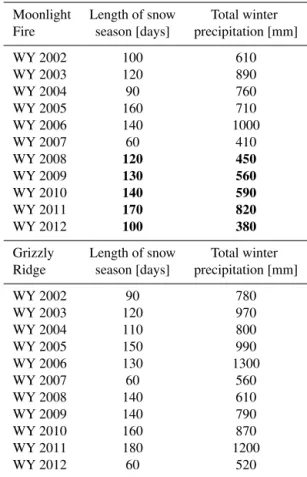
C) than the total snowfall. The largest fSCA year before the fire (WY 2005) was not during the period of the highest total winter precipitation (710 and 990 mm for the re-gion of the Moonlight Fire and Grizzly Ridge, respectively); however, it did exhibit the longest snow season (Fig. 4; Ta-ble 2).
Daily averaged MODSCAG fSCA estimates are uniformly increased based on the annual fraction of vegetation within the canopy adjustment algorithm (Eq. 5; Fig. 4). The pre-fire
Table 2.Length of snow season compared to total winter precipita-tion for the area of the Moonlight Fire and Grizzly Ridge. Post-fire years are set in bold.
Moonlight Length of snow Total winter Fire season [days] precipitation [mm]
WY 2002 100 610
WY 2003 120 890
WY 2004 90 760
WY 2005 160 710
WY 2006 140 1000
WY 2007 60 410
WY 2008 120 450
WY 2009 130 560
WY 2010 140 590
WY 2011 170 820
WY 2012 100 380
Grizzly Length of snow Total winter Ridge season [days] precipitation [mm]
WY 2002 90 780
WY 2003 120 970
WY 2004 110 800
WY 2005 150 990
WY 2006 130 1300
WY 2007 60 560
WY 2008 140 610
WY 2009 140 790
WY 2010 160 870
WY 2011 180 1200
WY 2012 60 520
annual fSCA. However, exposed areas with increased view-able fSCA exhibit altered accumulation and melt behavior due to changes in the snowpack energy budget and are fur-ther analyzed with both canopy-adjusted and non-adjusted fSCA.
4.3 MODSCAG cumulative distribution functions
Annual CDFs of basin-averaged non-canopy-adjusted and canopy-adjusted MODSCAG fSCA for both the Moonlight Fire area and Grizzly Ridge highlight shifts in viewable snow cover after the fire (Fig. 5). The spread in the pre-fire (Fig. 5; black) cumulative distribution functions are at-tributed to snow season climate variability. For post-fire wa-ter years 2008–2011 the annual cumulative distribution func-tions are statistically different from the pre-fire curve (P < 0.01), and the null hypothesis is rejected. However, WY 2012 falls within the pre-fire distributions and is not statistically different. The KS statistic indicates post-fire non-adjusted fSCA distributions are elevated on average by 40 % com-pared to pre-fire non-adjusted curves. The canopy-adjusted fSCA curves are not as sensitive, but still increase by 14 % after the fire. The distribution of the post-fire curves in the
Moonlight Fire area is generally higher compared to Griz-zly Ridge and is especially apparent using the non-adjusted fSCA (Fig. 5a). The shape of the fSCA curves significantly change after the fire due to the upward shift in inflection points. This shifting distribution indicates a higher post-fire probability that the basin will have larger areas of exposed snow coverage.
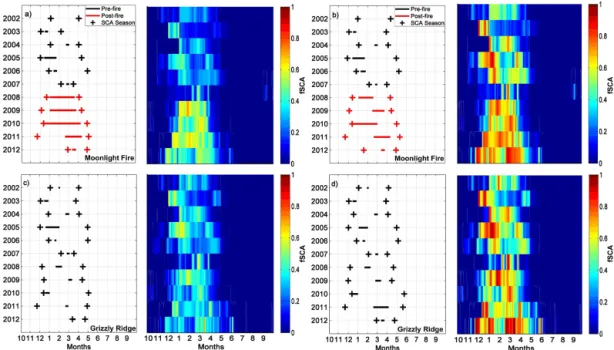
Using the thresholds established from the cumulative dis-tribution functions, the consecutive number of high snow-cover days with respect to the length of snow season are shown for the Moonlight Fire area (Fig. 6a and b) and Grizzly Ridge (Fig. 6c and d). Post-fire, there are more days with high snow cover in the Moonlight Fire region than pre-fire and compared to Grizzly Ridge for both canopy-adjusted (Fig. 6c and d) and non-canopy-adjusted fSCA values (Fig. 6a and b). On average, there are 13 days that exceed the high snow-cover threshold in the region before the fire, whereas there are on average 70 days classified as high snow cover after the fire. Temporal distributions highlight daily basin-averaged SCA patterns throughout each year for both canopy-adjusted and non-adjusted (Fig. 6, right). Larger fSCA patterns are noticeable during winter months (12 December through 5 April) after the fire. The canopy-adjusted fSCA plots (Fig. 6b and d) have larger values relative to the non-canopy-adjusted due to the linear scaling based on the vegetation fraction (Fig. 6a and c); and is congruent with the annual cumulative distribution functions (Fig. 5).
4.4 ANOVA
larger-than-average annual precipitation and length of snow season (1200 mm).
After the fire there are significantly higher annual basin-averaged fSCA estimates based on slope aspect and soil burn severity (bold values denote statistical significance; Table 3). Regardless of slope aspect and burn severity, statistically sig-nificant increases in fSCA for the Moonlight Fire area are ob-served from WY 2008 to 2011 (P <0.01). WY 2012 in all aspects and burn severity is not significantly different than pre-fire fSCA values but is still relatively high considering that it also received the lowest amount of total precipita-tion in the 11-year study period. Generally the high soil burn severity areas within the Moonlight Fire domain have slightly larger annual average fSCA values than moderate and low unburned (Table 3).
4.5 Annual melt-out dates
Annual melt-out dates are estimated for Grizzly Ridge and the area of the Moonlight Fire based on the 70 % exceedance (10 % basin-averaged fSCA) threshold established from the canopy-adjusted MODSCAG fSCA cumulative distribution functions. At 10 % coverage, the domain will have lost the vast majority of its snowpack due to melt. Annual melt-out dates for Grizzly Ridge and the Moonlight Fire region are compared for pre-fire and post-fire years (Fig. 8). Although the melt-out dates are variable from year to year based on an-nual snow conditions, Grizzly Ridge and the Moonlight Fire region melt-out dates are relatively similar pre-fire, during which it is observed that the area of the Moonlight Fire typ-ically melts out an average of 1.5 days after Grizzly Ridge and ranges from−0.5 to 7 days with a standard deviation of 3 days (Fig. 8b).
The average long-term pre-fire difference in melt-out dates (1.5 days) between the area of the Moonlight Fire and the control basin, Grizzly Ridge, is used to estimate the expected melt-out day for WY 2008–2012 assuming no fire (Fig. 8a; red solid diamonds). After the fire, the observed annual dif-ference in melt-out dates between the area of the Moonlight Fire and Grizzly Ridge shows an average decrease of 7.5 days and more variability, with a standard deviation of 11 days (Fig. 8b). Thus relative to pre-fire averages, the Moon-light Fire area melts out an average of 9 days earlier. After the fire, the area melts out 1–23 days before Grizzly Ridge each year except for 2012, when melt-out occurs 5 days after Grizzly Ridge (Fig. 8).
5 Discussion
Daily remote sensing products MODSCAG and MOD10A1 were used to evaluate spatial and temporal changes in snow cover extent over the Moonlight Fire region and Grizzly Ridge from WY 2002 to 2012. MOD10A1 generates higher fSCA estimates than MODSCAG, which concurs with other
studies that show the linear snow-mapping algorithm and the current NDVI threshold (Klein et al., 1998) do not differen-tiate between vegetation types and result in overestimates of fSCA (Rittger et al., 2013). Elevated pre-fire fSCA estimates dampen the fire signal which should increase viewable snow cover seen from MODIS. The MODSCAG product has a higher linear correlation to soil burn severity than MOD10A1 (r=0.56 andr=0.43, respectively) and on average identi-fies larger increases in post-fire fSCA than MOD10A1 due to its ability to un-mix a combination of spectral signals within each pixel. Since the primary goal of this study is to evaluate the effects of wildfire on the spatial and temporal distribu-tion of viewable snow cover, the results prompted the use of MODSCAG fSCA estimates for the remaining analysis.
Long-term basin-averaged MODSCAG fSCA estimates demonstrate statistically significant increased fSCA in the Moonlight Fire domain after the fire (WY 2008–2011;P < 0.01) compared to pre-fire averages. Based on observations, years with high pre-fire fSCA estimates (i.e., WY 2005) are more representative of the snow season duration than the total winter precipitation. However, non-canopy-adjusted MODSCAG fSCA values in the Moonlight Fire had an av-erage of 43 % more fSCA than pre-fire years due to the stand-replacing fire and the removal of forest canopy, despite a decrease in annual precipitation of 100 mm and an aver-age annual temperature of 1◦
C from pre- to post-fire. Pre-fire, non-canopy-adjusted fSCA ensembles in both basins followed similar trends (r=0.96), but there is a notable in-crease from non-canopy-adjusted MODSCAG fSCA in the Moonlight Fire region as compared to Grizzly Ridge of 26 %, post-fire.
A decomposition of fSCA in the Moonlight Fire area based on slope aspect and soil burn severity using the EPC is employed to investigate the influence of each attribute. Re-sults show statistically significant increases in fSCA from WY 2008 to 2011 regardless of slope aspect and soil burn severity because of acute changes in vegetation structure and the resulting exposure of more snow cover. Water year 2012 is the only year after the fire that does not show statistically significant changes in fSCA compared to average pre-fire conditions and are attributed to the lowest recorded precip-itation in the 11-year study period. Compared to the pre-fire low precipitation year (WY 2007), which received slightly more precipitation than WY 2012, and WY 2012 in Grizzly Ridge, fSCA is still increased by nearly 20 % in the Moon-light Fire region.
Figure 5. Annual cumulative frequency curves of daily basin-averaged non-canopy-adjusted MODSCAG fSCA for the Moonlight Fire area(a)and Grizzly Ridge(c)and canopy-adjusted MODSCAG fSCA for the Moonlight Fire area(b)and Grizzly Ridge(d). Black lines with black circles represent extreme pre-fire fSCA years (highest and lowest annual curves) and red circles represent post-fire annual curves.
Figure 6.Temporal trends in snow cover of the consecutive number of high snow-cover days (pre-fire exceedance probability≤10 %; represented by black and red lines) with respect to the length of snow season (exceedance probability≥70 %; represented by black and red crosses) for Grizzly Ridge(c)and(d)and the Moonlight Fire area(a)and(b). Color maps show annual daily basin-averaged fSCA patterns.
Figure 7.Basin-averaged ANOVA results for the Moonlight Fire area (left) and Grizzly Ridge (right) (99 % confidence interval). The post-fire years are shaded for the Moonlight Fire area.
Table 3.ANOVA results based on basin attributes for area of the Moonlight Fire. Bold font denotes statistical significance (P <0.01), post-fire years are set italic.
Slope aspect South [fSCA] North [fSCA] West [fSCA] East [fSCA]
WY 2002 0.13 0.12 0.12 0.13
WY 2003 0.12 0.10 0.11 0.13
WY 2004 0.11 0.10 0.10 0.11
WY 2005 0.18 0.17 0.17 0.19
WY 2006 0.16 0.15 0.15 0.17
WY 2007 0.08 0.08 0.08 0.09
Pre-fire average 0.13 0.12 0.12 0.14
WY 2008 0.22 0.22 0.21 0.23
WY 2009 0.23 0.22 0.21 0.23
WY 2010 0.29 0.28 0.27 0.29
WY 2011 0.29 0.29 0.27 0.32
WY 2012 0.15 0.16 0.14 0.16
Soil-burn severity High [fSCA] Moderate [fSCA] Low–unburned [fSCA]
WY 2002 0.11 0.13 0.15
WY 2003 0.09 0.12 0.14
WY 2004 0.09 0.11 0.12
WY 2005 0.16 0.18 0.20
WY 2006 0.14 0.16 0.18
WY 2007 0.07 0.08 0.10
Pre-fire average 0.11 0.13 0.15
WY 2008 0.23 0.22 0.21
WY 2009 0.24 0.22 0.21
WY 2010 0.30 0.28 0.27
WY 2011 0.30 0.29 0.27
WY 2012 0.15 0.15 0.15
of fSCA after a fire as a result of unnecessary linear scaling of fSCA.
Cumulative distribution functions of canopy and non-canopy-adjusted basin-averaged MODSCAG fSCA are de-veloped for the Moonlight Fire area and Grizzly Ridge to investigate post-fire shifts in snow cover and establish high
Figure 8.Basin-averaged snow cover melt-out dates for the area of the Moonlight Fire and Grizzly Ridge(a). Relative difference in melt-out dates (Moonlight Fire area–Grizzly Ridge) from the area of the Moonlight Fire and Grizzly Ridge(b).
exceedance threshold (defined as high snow cover) corre-sponded to an average snow coverage of 33 % across the do-main using non-canopy-adjusted fSCA estimates and 60 % coverage using the adjusted fSCA values. Using these values as thresholds, it was determined that after the fire there is an average 81 % increase in the number of high snow coverage days (i.e., days exhibiting higher than 33 % snow coverage or higher than 60 % snow coverage using the non-canopy-adjusted and canopy-non-canopy-adjusted fSCA estimates, respectively) compared to pre-fire conditions and the control basin. Signif-icant changes in the number of days with high snow coverage from elevated annual fSCA cumulative distribution functions compared to both pre-fire conditions and the control basin are a consequence of the fire and the removal of forest vege-tation. It is likely that the increase in fSCA is directly related to additional exposure of the snow surface that was once hid-den by forest canopy.
Significant changes in fSCA over the Moonlight Fire do-main influence basin melt-out dates. Based on the 70 % ex-ceedance probability threshold established from the cumula-tive distribution functions, the differences in melt-out dates between the Moonlight Fire area and Grizzly Ridge are sim-ilar before the fire, only differing on average by 1.5 days. After the fire (WY 2008–2011) the entire Moonlight Fire do-main melts out, on average, 9 days earlier compared to pre-fire conditions, with some years melting out up to 23 days early. The significant increases in exposed snow area from reductions in forest canopy cover increase the amount of so-lar radiation that reaches the snowpack. Early melt due to changes in the snowpack energy balance is consistent with smaller-scale field-based studies by Gleason et al. (2013) and Harpold et al. (2013). Changes in melt-out dates can have significant implications for water resource managers in the western US who rely on mountain snowpack for a majority of their water supply (Bales et al., 2006). The shifts observed in this study have important implications for reservoir opera-tion, downstream water rights, and overall ecosystem health and recovery. Changes in snowmelt timing can heavily
in-fluence the partitioning of snowmelt water (Molotch et al., 2009) and ultimately downstream water availability. Early snowmelt may also result in summer soil moisture deficits (Westerling et al. 2006), further exacerbating the effects of climate change. Snow is a natural storage reservoir for wa-ter and understanding the timing of the wawa-ter’s release into the system is critical for downstream resource managers. Fol-lowing a large disturbance such as a wildfire, the altered sys-tem can no longer be managed under typical assumptions (Milly et al., 2008). To further complicate post-fire snow dy-namics, snowpack melt-out dates are also correlated to forest types and species present in the Sierra Nevada (Barbour et al., 2002) and may influence plant phenology and vegetation types during the recovery or regeneration period.
According to this study, there is little evidence of canopy recovery from WY 2008 to 2012 over the Moonlight Fire area to pre-fire conditions as compared to the control basin, Grizzly Ridge. Basin-averaged fSCA and melt-out dates for WY 2012 fall within pfire averages, but this apparent re-turn or recovery to pre-fire values is partly influenced by cli-mate; WY 2012 had a low annual basin-averaged fSCA be-cause of lower than normal precipitation totals. The sustained post-fire increase in remotely sensed fSCA in the area of the Moonlight Fire and earlier melt-out dates is a function of canopy loss. Similar to previous post-fire ecosystem studies, recovery is not expected until there is full canopy regenera-tion or until the system reaches a new equilibrium (Meixner and Wohlgemuth, 2003; Kinoshita and Hogue, 2011).
6 Conclusions
compared to a control basin (Grizzly Ridge). The changes in snow coverage and melt-out dates from WY 2002 to 2012 in the area of the Moonlight Fire are attributed to the removal of vegetation after the fire and are driven by corresponding changes in the snowpack energy balance. Specific key find-ings of this study include the following:
– MODSCAG’s spectral mixing algorithm identifies snow cover in forested areas and is better correlated to soil burn severity compared to MOD10A1. MODSCAG is suited to identify changes in snow cover due to reduc-tions in canopy cover after a wildfire.
– There is significantly more basin-averaged fSCA (P < 0.01) after the fire due to a reduction of canopy cover and therefore an increased viewable snow area. – There are significant increases in the total number of
high snow-cover days after fire, based on pre- and post-fire cumulative distribution functions.
– Using the relative difference in melt-out dates between the area of the Moonlight Fire and Grizzly Ridge, the Moonlight Fire domain melts out, on average, 9 days earlier after the fire.
– There is minimal spatial or temporal recovery of canopy and snow cover 5 years after the fire.
Climate change and increasing wildfire frequency and size have the potential to highly alter mountain snowpacks. The release of advanced snow mapping products provides a tool for the improved application of remote sensing data to bet-ter understand hazards such as fire and offers a unique op-portunity for future long-term monitoring and research. The successful application of MODSCAG to the Moonlight Fire burn area provides the first watershed-scale analyses of snow cover and snowmelt detection after a large forest fire.
The shifts in the spatial and temporal distribution of snow throughout the year have significant implications for snow accumulation and melt patterns. This study advocates the ap-plication of remote sensing products such as MODSCAG for its rigorous spectral mixing analysis, which can contribute additional insight of regional post-fire snowpack and recov-ery studies. Remote sensing application improves our under-standing and prediction of snowmelt behavior and is crucial for water resources and management, especially in regions that are highly dependent on snowpack and subject to fre-quent and acute forest disturbances.
Acknowledgements. Special thanks to Thomas Painter and his colleagues on the snow hydrology team at NASA JPL for the management and distribution of the MODSCAG product. Sup-port for this research was provided by an NSF RAPID Grant (no. EAR1361454) as well as an NSF Hydrologic Sciences Program CAREER Grant (no. EAR0846662).
Edited by: S. Uhlenbrook
References
Bales, R. C., Molotch, N. P., Painter, T. H., Dettinger, M. D., Rice, R. and Dozier, J.: Mountain hydrology of the western United States, Water Resour. Res., 42, W08432, doi:10.1029/2005WR004387, 2006.
Barbour, M., Kelley, E., Maloney, P., Rizzo, D., Royce, E., and Fites-Kaufmann, J.: Present and past old-growth forests of the Lake Tahoe Basin, Sierra Nevada, US, J. Veg. Sci., 13, 461–472, doi:10.1111/j.1654-1103.2002.tb02073.x, 2002.
Brown, A. E., Zhang, L., McMahon, T. A., Western, A. W., and Vertessy, R. A.: A review of paired catch-ment studies for determining changes in water yield result-ing from alterations in vegetation, J. Hydrol., 310, 28–61, doi:10.1016/j.jhydrol.2004.12.010, 2005.
Burke, M. P., Hogue, T. S., Kinoshita, A. M., Barco, J., Wes-sel, C., and Stein, E. D.: Pre- and post-fire pollutant loads in an urban fringe watershed in Southern California, Environ. Monit. Assess., 185, 10131–10145, doi:10.1007/s10661-013-3318-9, 2013.
Burles, K. and Boon, S.: Snowmelt energy balance in a burned for-est plot, Crowsnfor-est Pass, Alberta, Canada, Hydrol. Process., 25, 3012–3029, doi:10.1002/hyp.8067, 2011.
California Department of Forestry and Fire Protection: Fire Perime-ters, Geospatial Data Presentation Form: vector digital data, available at: http://frap.cdf.ca.gov/data/frapgisdata-subset.php, last access: December 2012.
Cowpertwait, P., Ocio, D., Collazos, G., de Cos, O., and Stocker, C.: Regionalised spatiotemporal rainfall and temperature models for flood studies in the Basque Country, Spain, Hydrol. Earth Syst. Sc., 17, 479–494, doi:10.5194/hess-17-479-2013, 2013. Daly, C., Neilson, R. P., and Phillips, D. L.: A statistical topographic
model for mapping climatological precipitation over mountain-ous terrain, J. Appl. Meteorol., 33, 140–158, doi:10.1175/1520-0450(1994)033<0140:astmfm>2.0.co;2, 1994.
Daly, C., Taylor, G., Gibson, W., and Ams: The PRISM approach to mapping precipitation and temperature, 10th Conference on Applied Climatology, 10–12, 1997.
Daly, C., Gibson, W. P., Taylor, G. H., Johnson, G. L., and Pasteris, P.: A knowledge-based approach to the statistical mapping of cli-mate, Clim. Res., 22, 99–113, doi:10.3354/cr022099, 2002. DiMiceli, C. M., Carroll, M. L., Sohlberg, R. A., Huang, C. M.,
Hansen, C., and Townshend, J. R. G.: Annual Global Automated MODIS Vegetation Continuous Fields (MOD44B) at 250 m Spa-tial Resolution for Data Years Beginning Day 65, 2000–2010, Collection 5 Percent Tree Cover. University of Maryland, Col-lege Park, 2011.
Dozier, J.: Spectral signature of alpine snow cover from the Landsat Thermatic Mapper, Remote Sens. Environ., 28, 9–22, doi:10.1016/0034-4257(89)90101-6, 1989.
Dozier, J., Painter, T. H., Rittger, K., and Frew, J. E.: Time-space continuity of daily maps of fractional snow cover and albedo from MODIS, Adv. Water Resour., 31, 1515–1526, doi:10.1016/j.advwatres.2008.08.011, 2008.
Faria, D. A., Pomeroy, J. W., and Essery, R. L. H.: Effect of covari-ance between ablation and snow water equivalent on depletion of snow-covered area in a forest, Hydrol. Process., 14, 2683– 2695, doi:10.1002/1099-1085(20001030)14:15<2683::AID-HYP86>3.0.CO;2-N, 2000.
Fry, J., Xian, G., Jin, S., Dewitz, J., Homer, C., Yang, L., Barnes, C., Herold, N., and Wickham, J.: Completion of the 2006 Na-tional Land Cover Database for the Conterminous United States, Photogramm. Eng. Remote Sens., 77, 858–864, 2011.
Gleason, K. E., Nolin, A. W., and Roth, T. R.: Charred forests in-crease snowmelt: Effects of burned woody debris and incoming solar radiation on snow ablation, Geophys. Res. Lett., 40, 4654– 4661, doi:10.1002/grl.50896, 2013.
Hall, D. K., Salomonson, V. V., and Riggs. G. A.: MODIS/Terra Snow Cover Daily L3 Global 500 m Grid, Version 5, Boulder, Colorado USA, NASA DAAC at the National Snow and Ice Data Center, 2006.
Hansen, M. C., DeFries, R. S., Townshend, J. R. G., Car-roll, M., Dimiceli, C., and Sohlberg, R. A.: Global Per-cent Tree Cover at a Spatial Resolution of 500 Me-ters: First Results of the MODIS Vegetation Continuous Fields Algorithm. Earth Interact., 7, 1–15, doi:10.1175/1087-3562(2003)007<0001:GPTCAA>2.0.CO;2, 2003.
Harpold, A. A., Biederman, J. A., Condon, K., Merino, M., Kor-gaonkar, Y., Nan, T., Sloat, L. L., Ross, M., and Brooks, P. D.: Changes in snow accumulation and ablation following the Las Conchas Forest Fire, New Mexico, USA, Ecohydrology, 7, 440– 452, doi:10.1002/eco.1363, 2013.
Kattelmann, R. C., Berg, N. H., and Rector, J.: The potential for in-creasing streamflow from Sierra-Nevada watersheds, Water Re-sour. Bull., 19, 395–402, 1983.
Kinoshita, A. M. and Hogue, T. S.: Spatial and temporal controls on post-fire hydrologic recovery in Southern California watersheds, Catena, 87, 240–252, doi:10.1016/j.catena.2011.06.005, 2011. Klein, A. G., Hall, D. K., and Riggs, G. A.: Improving snow cover
mapping in forests through the use of a canopy reflectance model, Hydrol. Process., 12, 1723–1744, doi:10.1002/(SICI)1099-1085(199808/09)12:10/11<1723::AID-HYP691>3.0.CO;2-2, 1998.
Lane, P. N. J., Sheridan, G. J., and Noske, P. J.: Changes in sediment loads and discharge from small mountain-catchments following wild-fire in south eastern Australia, J. Hydrol., 331, 495–510, doi:10.1016/j.jhydrol.2006.05.035, 2006.
Massey Jr, F. J.: The Kolmogorov-Smirnov test for goodness of fit, J. Am. Stat. Assoc., 46, 68–78, 1951.
Maurer, E. P., Rhoads, J. D., Dubayah, R. O., and Lettenmaier, D. P.: Evaluation of the snow-covered area data product from MODIS, Hydrol. Process., 17, 59–71, doi:10.1002/hyp.1193, 2003. Meixner, T. and Wohlgemuth, P. M.: Climate variability, fire,
veg-etation recovery, and watershed hydrology. In Proceedings of the First Interagency Conference on Research in the Watersheds, Benson, Arizona, October 2003, 651–656, 2003.
Milly, P. C. D., Betancourt, J., Falkenmark, M., Hirsch, R. M., Kundzewicz, Z. W., Lettenmaier, D. P., and Stouffer, R. J.: Cli-mate change – Stationarity is dead: Whither water management?, Science, 319, 573–574, doi:10.1126/science.1151915, 2008. Molotch, N. P., Brooks, P. D., Burns, S. P., Litvak, M., Monson,
R. K., McConnell, J. R., and Musselman, K.: Ecohydrological
controls on snowmelt partitioning in mixed-conifer sub-alpine forests. Ecohydrology, 2, 129–142, doi:10.1002/eco.48, 2009. Molotch, N. P. and Margulis, S. A.: Estimating the distribution of
snow water equivalent using remotely sensed snow cover data and a spatially distributed snowmelt model: A multi-resolution, multi-sensor comparison, Adv. Water Resour., 31, 1503–1514, doi:10.1016/j.advwatres.2008.07.017, 2008.
Morton, D. C., DeFries, R. S., Shimabukuro, Y. E., Anderson, L. O., Espírito-Santo, F. D. B., Hansen, M., and Carroll, M.: Rapid As-sessment of Annual Deforestation in the Brazilian Amazon Us-ing MODIS Data. Earth Interact., 9, 1–22, doi:10.1175/EI139.1, 2005.
Painter, T. H., Barrett, A. P., Landry, C. C., Neff, J. C., Cassidy, M. P., Lawrence, C. R., McBride, K. E., and Farmer, G. L.: Impact of disturbed desert soils on duration of mountain snow cover, Geophys. Res. Lett., 34, L12502, doi:10.1029/2007GL030284, 2007.
Painter, T. H., Rittger, K., McKenzie, C., Slaughter, P., Davis, R. E., and Dozier, J.: Retrieval of subpixel snow covered area, grain size, and albedo from MODIS, Remote Sens. Environ., 113, 868– 879, doi:10.1016/j.rse.2009.01.001, 2009.
Pu, Z., Xu, L., and Salomonson, V. V.: MODIS/Terra observed sea-sonal variations of snow cover over the Tibetan Plateau, Geo-phys. Res. Lett., 34, L06706, doi:10.1029/2007GL029262, 2007. Raleigh, M. S., Rittger, K., Moore, C. E., Henn, B., Lutz, J. A., and Lundquist, J. D.: Ground-based testing of MODIS fractional snow cover in subalpine meadows and forests of the Sierra Nevada, Remote Sens. Environ., 128, 44–57, doi:10.1016/j.rse.2012.09.016, 2013.
Rittger, K., Painter, T. H., and Dozier, J.: Assessment of methods for mapping snow cover from MODIS, Adv. Water Resour., 51, 367–380, doi:10.1016/j.advwatres.2012.03.002, 2013.
Salomonson, V. V. and Appel, I.: Estimating fractional snow cover from MODIS using the normalized differ-ence snow index, Remote Sens. Environ., 89, 351-360, doi:10.1016/j.rse.2003.10.016, 2004.
Smakhtin, V. U.: Low flow hydrology: a review, J. Hydrol., 240, 147–186, doi:10.1016/s0022-1694(00)00340-1, 2001.
Stednick, J. D.: Monitoring the effects of timber harvest on an-nual water yield, J. Hydrol., 176, 79–95, doi:10.1016/0022-1694(95)02780-7, 1996.
Stein, E. D., Brown, J. S., Hogue, T. S., Burke, M. P., and Ki-noshita, A.: Stormwater contaminant loading following southern California wildfires, Environ. Toxicol. Chem., 31, 2625–2638, doi:10.1002/etc.1994, 2012.
Stephens, S. L., Collins, B. M., and Roller, G.: Fuel treatment longevity in a Sierra Nevada mixed conifer forest, Forest Ecol. and Manag., 285, 204–212, doi:10.1016/j.foreco.2012.08.030, 2012.
Swanson, F. J.: Fire and Geomorphic Processes, in: Proceedings, Fire regimes and ecosystems conference, Honolulu, HI, 11–15 December 1979, Gen. Tech. Rep., WO-23, USDA, Washington, DC, 401–420, 1981.
Tucker, C. J.: Red and photographic infrared linear combinations for monitoring vegetation, Remote Sens. Environ., 8, 127–150, 1979.
available at: http://edc.usgs.gov (last access: 20 December 2012), 2007.
Varhola, A., Coops, N. C., Weiler, M., and Moore, R. D.: For-est canopy effects on snow accumulation and ablation: An in-tegrative review of empirical results, J. Hydrol., 392, 219–233, doi:10.1016/j.jhydrol.2010.08.009, 2010.
Webb, A. A., Kathuria, A., and Turner, L.: Longer-term changes in streamflow following logging and mixed species eucalypt forest regeneration: The Karuah experiment, J. Hydrol., 464, 412–422, doi:10.1016/j.jhydrol.2012.07.034, 2012.
Westerling, A. L., Hidalgo, H. G., Cayan, D. R., and Swet-nam, T. W.: Warming and earlier spring increase west-ern US forest wildfire activity- Science, 313, 940–943. doi:10.1126/science.1128834, 2006.