Atmos. Chem. Phys., 15, 1191–1204, 2015 www.atmos-chem-phys.net/15/1191/2015/ doi:10.5194/acp-15-1191-2015
© Author(s) 2015. CC Attribution 3.0 License.
Carbonaceous aerosols recorded in a southeastern Tibetan
glacier: analysis of temporal variations and model estimates
of sources and radiative forcing
M. Wang1,2, B. Xu1, J. Cao3, X. Tie3,4, H. Wang2, R. Zhang5,2, Y. Qian2, P. J. Rasch2, S. Zhao3, G. Wu1, H. Zhao1, D. R. Joswiak1, J. Li1, and Y. Xie1
1Key Laboratory of Tibetan Environment Changes and Land Surface Processes, Institute of Tibetan Plateau Research,
Chinese Academy of Sciences, Beijing 100101, China
2Atmospheric Sciences and Global Change Division, Pacific Northwest National Laboratory (PNNL), Richland, WA 99352,
USA
3State Key Laboratory of Loess and Quaternary Geology, Institute of Earth Environment, Chinese Academy of Sciences,
Beijing 100085, China
4National Center for Atmospheric Research, Boulder, CO, 80303, USA
5Key Laboratory for Semi-Arid Climate Change of the Ministry of Education, College of Atmospheric Sciences, Lanzhou
University, Lanzhou 730000, Gansu, China
Correspondence to:M. Wang ([email protected])
Received: 30 May 2014 – Published in Atmos. Chem. Phys. Discuss.: 31 July 2014 Revised: 17 December 2014 – Accepted: 20 December 2014 – Published: 2 February 2015
Abstract. High temporal resolution measurements of black carbon (BC) and organic carbon (OC) covering the time pe-riod of 1956–2006 in an ice core over the southeastern Ti-betan Plateau show a distinct seasonal dependence of BC and OC with higher respective concentrations but a lower OC/BC ratio in the non-monsoon season than during the summer monsoon. We use a global aerosol-climate model, in which BC emitted from different source regions can be explicitly tracked, to quantify BC source–receptor relation-ships between four Asian source regions and the southeast-ern Tibetan Plateau as a receptor. The model results show that South Asia has the largest contribution to the present-day (1996–2005) mean BC deposition at the ice-core drilling site during the non-monsoon season (October to May) (81 %) and all year round (74 %), followed by East Asia (14 % to the non-monsoon mean and 21 % to the annual mean). The ice-core record also indicates stable and relatively low BC and OC deposition fluxes from the late 1950s to 1980, followed by an overall increase to recent years. This trend is consis-tent with the BC and OC emission inventories and the fuel consumption of South Asia (as the primary contributor to an-nual mean BC deposition). Moreover, the increasing trend of
the OC/BC ratio since the early 1990s indicates a growing
contribution of coal combustion and/or biomass burning to the emissions. The estimated radiative forcing induced by BC and OC impurities in snow has increased since 1980, suggesting an increasing potential influence of carbonaceous aerosols on the Tibetan glacier melting and the availability of water resources in the surrounding regions. Our study in-dicates that more attention to OC is merited because of its non-negligible light absorption and the recent rapid increases evident in the ice-core record.
1 Introduction
be the second strongest climate warming forcing agent after carbon dioxide (Jacobson, 2001; IPCC, 2013).
Because of their high population density and relatively low combustion efficiency, developing countries in South and East Asia such as India and China are hotspots of car-bonaceous aerosol emissions (Ramanathan and Carmichael, 2008). During the cold and dry winter season, haze (heav-ily loaded with carbonaceous aerosols) builds up over South Asia, and exerts profound influences on regional radia-tive forcing (Ramanathan et al., 2007; Ramanathan and Carmichael, 2008), hydrologic cycles (Menon et al., 2002; Ramanathan et al., 2005), and likely Himalaya–Tibetan glacier melting that could be accelerated by the absorption of sunlight induced by BC in the air and deposited on the ice and snow surfaces (Ramanathan et al., 2007; Hansen and Nazarenko, 2004), although BC deposited in snow and glaciers at some locations may not significantly affect the en-ergy balance (Ming et al., 2013; Kaspari et al., 2014).
Due to the lack of long-term observations of emissions and concentrations of atmospheric carbonaceous aerosols, it is difficult to evaluate the effects of BC and OC on histori-cal regional climate and environment before the satellite era. Some studies have evaluated historical anthropogenic emis-sions based on the consumption of fossil fuels and biofu-els (Novakov et al., 2003; Ito and Penner, 2005; Bond et al., 2007; Fernandes et al., 2007). While fossil fuel is the major energy source in the urban areas of South Asia and East Asia, biomass combustion, such as fuel wood, agricul-tural residue and dung cake, is prevalent in rural areas (Rev-elle, 1976; Venkataraman et al., 2010; Streets and Waldhoff, 1998). Biomass burning has been considered as the major source of black carbon emissions (Reddy and Venkatara-man, 2002; Venkataraman et al., 2005). However, as reliable biomass consumption data are hard to obtain, estimates of BC and OC emissions from biomass burning are ambiguous and incomplete.
Measurements of carbonaceous aerosol concentrations in glacier ice are an ideal means of reconstructing historical emissions and revealing long-term trends of anthropogenic aerosol impacts on local climate. Greenland ice-core mea-surements were previously used to reconstruct the North American BC emission history and its effects on surface ra-diative forcing back to the 1880s (McConnell et al., 2007). Himalayan ice cores retrieved from the Tibetan Plateau have revealed the mixed historical emissions from South Asia, Central Asia and the Middle East, and have also been used to evaluate radiative forcing from BC in snow (Ming et al., 2008; Kaspari et al., 2011). Using the Snow, Ice, and Aerosol Radiative (SNICAR) model, Flanner et al. (2007) estimated an instantaneous regional forcing exceeding 20 W m−2 by
BC in snow/glaciers over the Tibetan Plateau during the spring season.
By using five ice-core records, Xu et al. (2009a) eluci-dated an important contribution of BC to the retreat of Ti-betan glaciers in addition to greenhouse gases. Due to the
short atmospheric lifetime of carbonaceous aerosols com-pared to greenhouse gases, emission reductions may be an effective way to mitigate their warming effects. Thus, it is particularly important to identify the source regions and the source types of carbonaceous aerosols observed in Tibetan glaciers. Xu et al. (2009a) suggested that BC deposited on the Tibetan Plateau was broadly from Europe and Asia. How-ever, they did not perform in-depth analysis on emissions from more specific source regions and the source types. In this study, we use the ice core retrieved from the southeastern Tibetan Plateau, also known as the Zuoqiupu ice core in Xu et al. (2009a), to reconstruct the history of atmospheric deposi-tion of carbonaceous aerosols in this glacier, and to character-ize emissions and source–receptor relationships with the help of a global climate model in which BC emitted from different source regions can be explicitly tracked. We also estimate the respective contributions from BC and OC to radiative forcing in the Zuoqiupu glacier using the ice-core measurements and the SNICAR model.
2 Methods
M. Wang et al.: Carbonaceous aerosols recorded in a southeastern Tibetan glacier 1193
Figure 1.Site location of Zuoqiupu glacier (top): black circle represents the location of Zuoqiupu glacier, and warm colors indicate high elevations over the Tibetan Plateau. Detailed elevation contours of the Zuoqiupu glacier are shown in the bottom panel. Red circle marks the ice-core drilling site.
2.2 Model and experimental setup
We use the Community Atmosphere Model version 5 (CAM5; Neale et al., 2012) to help understand the emissions, transport and dry/wet deposition of carbonaceous aerosols in the atmosphere. In the default three-mode modal aerosol scheme of CAM5 used for this study, BC and primary OC are emitted into an accumulation size mode, where they im-mediately mix with co-existing hygroscopic species such as sulfate and sea salt (Liu et al., 2012). Hygroscopic aerosol particles in the accumulation mode are subject to wet re-moval by precipitation. Recent model improvements to the representation of aerosol transport and wet removal in CAM5 by H. Wang et al. (2013) have substantially improved the model prediction of global distribution of aerosols, particu-larly over remote regions away from major sources. To min-imize the model biases in simulating meteorological condi-tions and, particularly, circulacondi-tions that are critical to aerosol transport, we configure the CAM5 model to run in an
of-fline mode (Ma et al., 2013) with wind, temperature, sur-face fluxes and pressure fields constrained by observations. However, cloud/precipitation fields and interactions between aerosol and clouds are allowed to evolve freely. A source tag-ging technique has recently been implemented in the CAM5 model to allow for explicit tracking of aerosols emitted from individual source regions and, therefore, to assist in quanti-tatively characterizing source–receptor relationships (Wang et al., 2014). This tagging technique along with the CAM5 model is used in the present study to do source attribution for carbonaceous aerosols deposited onto the Zuoqiupu glacier.
(includ-ing OC, BC and other important species), we use the year-2000 monthly mean emissions described by Lamarque et al. (2010) that have been used in many global climate mod-els for present-day climate simulations, included in the fifth assessment report (AR5) by the Intergovernmental Panel on Climate Change (IPCC). The monthly mean emissions are repeatedly used for each year in the 11-year simulation. Note that we do not intend to design the model experiment to simulate the whole historical record of BC in the ice core, but rather for a period of time to demonstrate the impact of meteorology (and the associated transport and removal of aerosols) on the seasonal dependence of BC deposition in the target region and the lack of a longer-term trend in deposition without considering the temporal variation of emissions.
As the ice-core drilling site was located in a remote and elevated area over the southeastern Tibetan Plateau, local emissions are minimal. Deposition of carbonaceous aerosols is most likely contributed by the non-local major emission sources (e.g., distributions of mean BC emissions during non-monsoon and monsoon seasons shown in Fig. 2) in South Asia and East Asia. These two regions, along with Southeast Asia and Central Asia, are identified as the poten-tial source contributors. Thus, BC emissions from the four regions and the rest of the world are explicitly tracked in the CAM5 simulation.
3 Results and discussion
3.1 Seasonal dependence of carbonaceous aerosols BC and OC concentrations in the Zuoqiupu ice core both ex-hibit statistically significant seasonal variations correspond-ing to the stable oxygen isotope variability, which shows high values during the winter and low values during the sum-mer (Xu et al., 2009a). As shown in Fig. 3, concentrations of BC and OC have distinct differences between the sum-mer monsoon and non-monsoon seasons. Seasonally vary-ing emissions and meteorological conditions that determine the transport pathways of BC and OC emitted from major sources, removal during the transport, and local precipitation rate, can cause the seasonal variations of BC and OC in ice at the sampling site. The seasonal dependence of BC and OC in ice cores is consistent with available observations of atmo-spheric aerosols on the southern slope of the Himalayas and the southeastern Tibetan Plateau, where the high concentra-tion of carbonaceous aerosols during the cold and dry season suggested an association with the South Asian haze (Cong et al., 2009; Marinoni et al., 2010; Kaspari et al., 2011; S. Zhao et al., 2013; Z. Zhao et al., 2013). The consistency between the seasonal dependence of airborne BC and OC concentra-tions and the seasonal variation of ice-core measurements in-dicates that seasonal differences in precipitation rates at the sampling location are less likely to be the determining fac-tor. Our model results (details discussed in Sect. 3.2) suggest
that the seasonal dependence of BC deposition flux in the target region could be mainly due to meteorological condi-tions that determine the transport pathways (and associated wet removal processes during the transport). The small sea-sonal contrasts in BC emissions from the major source re-gions (see Table 1) that are used in the model simulation do not seem to be able to explain the large seasonal difference in BC deposition, although the BC emissions are known to have large uncertainties.
Our further analysis shows that the ratio of OC to BC also has clear seasonal dependence. In Fig. 3, the slope of the fitted line to measured OC vs. BC concentrations during monsoon season is∼6.3, which is twice the slope for
non-monsoon season (∼3.2). The analysis of covariance
(AN-COVA) for slope differences of single linear regressions of OC against BC between monsoon and non-monsoon seasons indicates that the seasonal dependence of the relationship be-tween the concentrations of OC and BC is significant (at the 0.05 significance level). This also agrees with measurements derived from the ice core drilled from the Palong-Zanbu No. 4 glacier (Xu et al., 2009b) and in atmospheric samples col-lected from Lulang, southeastern Tibetan Plateau (Z. Zhao et al., 2013). The seasonal dependence of the OC/BC ra-tio can possibly be derived from the seasonal sources of carbonaceous particles, circulation strength, transport path-ways, and/or atmospheric deposition processes. Compared to the respective BC and OC concentrations, the seasonal dependence of the OC/BC ratio is less straightforward to
understand. Circulation patterns together with wet removal processes still determine the transport pathways of emis-sions from major BC and OC source regions to the sampling site, which however are less likely to change the OC/BC
ratio from certain sources. Therefore, it is more plausible due to seasonally dependent contributions from source re-gions and/or emission sectors (including fuel types, quantity, and combustion conditions). Cao et al. (2005) found that the average OC/BC ratios measured from plumes of residen-tial biomass burning and coal combustion are substanresiden-tially higher than from vehicle exhaust. The higher OC/BC ratio during summer monsoon might indicate more contributions from biomass and/or coal burning than fossil fuel combus-tion.
3.2 Source attribution
explic-M. Wang et al.: Carbonaceous aerosols recorded in a southeastern Tibetan glacier 1195
Figure 2.10-year (1996–2005) mean wind vectors (denoted by arrows) at 500 hPa(a, b)and the surface(c, d)during the summer monsoon
(June–September;(a, c)) and non-monsoon seasons, October–May,(b, d)from MERRA reanalysis data sets used to drive the CAM5
simu-lation. 500 hPa geopotential height (units: 10 m) contours with an interval of 60 m and mean sea-level pressure (units: hPa) contours with an
interval of 4 hPa are superimposed on panels(a, b)and(c, d), respectively. The background colors show mean BC emission rates based on
the IPCC present-day scenario for the corresponding months. The small black box marks the model grid cell in which the ice-core drilling site resides.
Table 1.Source regions (South Asia, East Asia, Southeast Asia, and Central Asia) and corresponding monthly mean BC emissions (Tg a−1) and fractional contributions (%) to BC deposition flux at the Zuoqiupu site in monsoon (June–September), non-monsoon (October–May), and all months during 1996–2005.
Source regions Latitude Longitude Monsoon Non-monsoon Annual
Contribution Emission Contribution Emission Contribution Emission
South Asia 5–35◦N 50–95◦E 38.51 0.65 81.26 0.74 74.48 0.71
East Asia 15–50◦N 95–150◦E 56.24 1.75 13.91 1.90 20.66 1.85
Southeast Asia 0–15◦N 95–130◦E 0.05 0.28 0.16 0.33 0.15 0.31
Central Asia 35–50◦N 50–95◦E 2.62 0.11 0.86 0.09 1.14 0.10
itly calculated. Figure 4 shows the spatial distribution of frac-tional contribution from the four source regions. BC deposi-tion at the drilling site (indicated by the black box in Fig. 4), which has a consistent seasonal dependence (i.e., more dur-ing the non-monsoon season; Fig. 5) with ice-core measure-ments, is predominately (over 95 %) from South Asia and East Asia. The seasonal dependence of BC deposition is also consistent with a recent regional climate modeling study on
BC deposition on the Himalayan snow cover from 1998 to 2008 (Ménégoz et al., 2014).
OC = 6.31BC - 3.41 R = 0.72
OC = 3.17BC + 0.29 R = 0.69
0 10 20 30 40 50 60 70 80
0 2 4 6 8 10 12 14 16 18
OC (ng g
-1)
BC (ng g-1)
Monsoon Non-monsoon
Figure 3.Scatterplots for yearly monsoon and non-monsoon mean OC and BC concentrations during 1956–2006, obtained from the ice-core measurements, and corresponding linear regressions.
different major sources. During the non-monsoon season, a strong westerly dominates the transport from west to east at all levels. Emissions from northern India and Central Asia can have an influence on BC in the direct downwind recep-tor region over the southeastern Tibetan Plateau. During the summer monsoon season, the westerly moves northward, and the monsoon flow from the Bay of Bengal at the surface and middle levels (e.g., 500 hPa), coupled with the monsoon from the Indochina peninsula and the South China Sea, exert an in-fluence on BC in the receptor area. The strong monsoon pre-cipitation removes BC from the atmosphere during the port. The high Himalayas can partly block the further trans-port of emissions from South Asia to the Tibetan Plateau, al-though small local topographical features such as the Yarlung Tsangpo River valley can provide a gate for the pollution to enter the inner Tibetan Plateau (Cao et al., 2010). Ele-vated emissions from the west (or the northern part of South Asia) can take the pathways at middle and upper levels, but they have minimal contribution to deposition. Therefore, BC emissions from East Asia play a relatively more important role in affecting deposition at the Zuoqiupu site during the monsoon season.
The fractional contributions to 10-year mean BC depo-sition at the drilling site from the four tagged regions are summarized in Table 1. Results show that South Asia is the dominant contributor (∼81 %) during the non-monsoon
sea-son with∼14 % from East Asia, while the contribution of
East Asia (∼56 %) is larger than that of South Asia (∼39 %)
during the monsoon season. For the annual mean BC depo-sition, South Asia (∼75 %) is the biggest contributor,
fol-lowed by East Asia (∼21 %). Emissions from the Central
Asia and Southeast Asia regions have much smaller contri-butions (< 3 %) for all seasons. These results agree well with the short-term source attribution study by Lu et al. (2012)
using the Hybrid Single-Particle Lagrangian Integrated Tra-jectory (HYSPLIT) model.
For comparison, seasonal and annual mean BC emissions from the individual tagged source regions are also included in Table 1. Apparently, the contrast in strengths of regional emissions alone cannot explain their relative contributions to BC deposition at the sampling site, and the small seasonal variations in emissions are unlikely to be the cause of sea-sonal dependence of source attribution. Note that the BC emission inventory (Lamarque et al., 2010) used in CAM5 does not consider seasonal variations in anthropogenic emis-sions, which is likely to have introduced biases in the quan-titative model estimates of seasonal dependence of contribu-tions, but the relative importance of source regions should be robust.
3.3 Interannual variations and long-term trend
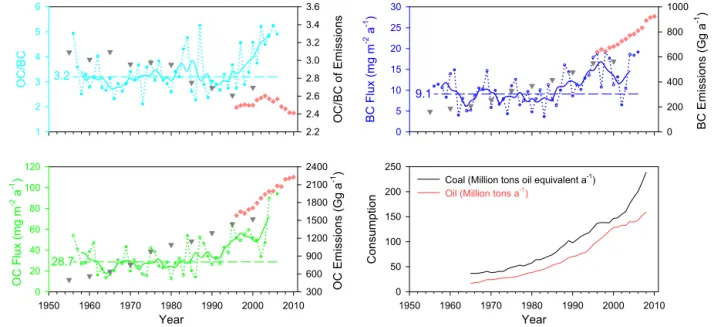
Based on annual snow accumulation and BC and OC concen-trations derived from the ice-core record, the annual BC and OC deposition fluxes can be estimated, which are then used to examine the interannual variations and long-term trend in the fluxes and the ratio of OC/BC, as well as the rela-tionship with emissions from the major contributor. As illus-trated in Fig. 6, from the late 1950s to 1980, the BC and OC fluxes in the Zuoqiupu ice core are relatively low and stable in comparison to those after 1980. During the period 1956 to 1979, average fluxes are 9.1 and 28.7 mg m−2a−1for BC
and OC, respectively. Both BC and OC fluxes began to show increasing trends from the early 1980s. These trends contin-ued in the early 1990s, but started to drop in the mid-1990s, reaching a minimum in 2002 followed by a rapid increase. In 2006, BC and OC fluxes are 19.2 and 93.9 mg m−2a−1,
respectively, which are 2 and 3 times the respective average fluxes before 1980. The 5-year average OC/BC flux ratio is steady before 1990; however, it shows a continual increase afterwards and has been higher than the average value (3.2) for the period of 1956–1979 since the mid-1990s (Fig. 6). The 10-year CAM5 model simulation, in which annual emis-sions are fixed but meteorological conditions vary, shows no increasing trend in BC and OC deposition fluxes (BC depo-sition shown in Fig. 5), indicating that the increasing trend seen in the observations was not due to changes in meteorol-ogy.
M. Wang et al.: Carbonaceous aerosols recorded in a southeastern Tibetan glacier 1197
Figure 4.Spatial distributions of fractional contribution from the four source regions (South Asia, East Asia, Southeast Asia, and Central Asia) to monsoon, non-monsoon, and annual mean BC deposition fluxes during 1996–2005. The large black boxes indicate the boundary of source regions, and the small black box marks the model grid cell where the Zuoqiupu drilling site is located. Color in the small black box in each panel corresponds to the fraction contribution to BC deposition at the sampling site. Exact percentage contributions are provided in Table 1.
Time 1995
NM 1996
M 1996
NM 1997
M 1997
NM 1998
M 1998
NM 1999
M 1999
NM 2000
M 2000
NM 2001
M 2001
NM 2002
M 2002
NM 2003
M 2003
NM 2004
M 2004
NM 2005
M
B
C
Flux
(mg
m
-2 a -1)
0 20 40 60 80 100 120 140 160
y = 0.03x + 57.3
Figure 5. Seasonal dependence (“NM” for non-monsoon season and “M” for monsoon season) of BC deposition flux at the Zuo-qiupu site from 1995 to 2005 simulated in CAM5. The dashed line represents a linear regression of all data points.
also illustrated in Fig. 6 to extend the emission data to cover the entire time period that the ice-core data span. Note that the emission data from Lu et al. (2011) are only for In-dia, which is the largest energy consumer and carbonaceous aerosol-emitting country in South Asia. There are differences between the emissions of Bond et al. (2007) and Lu et al. (2011) during the overlap time period (1996–2000). How-ever, good agreements on the increasing trend can be found in the respective deposition fluxes and emissions of BC and
OC (Fig. 6). The OC/BC emission ratio also shows an
in-creasing trend from the late 1990s to 2003, which is con-sistent with that of the OC/BC ratio in the ice-core record. The annual mean aerosol index over industrial and populated cities in the northern part of India increased from 1982 to 1993 and more significantly from 2000 to 2003 (Sarka et al., 2006). This trend is similar to that of carbonaceous aerosols in the ice-core record, and it might indicate a causal rela-tionship between BC and OC over the southeastern Tibetan Plateau and emissions from the northern part of South Asia.
3.4 Emission source analyses
O C/ B C 1 2 3 4 5 6 O C/ B C of E m issions 2.2 2.4 2.6 2.8 3.0 3.2 3.4 3.6 B C Flux (mg m
-2 a -1) 0 5 10 15 20 25 30 B C E missions (G g a -1) 0 200 400 600 800 1000 Year
1950 1960 1970 1980 1990 2000 2010
O
C
Flux
(mg
m
-2 a -1) 0 20 40 60 80 100 120 O C E m issions (G g a -1 ) 300 600 900 1200 1500 1800 2100 2400 3.2 9.1 28.7 Year
1950 1960 1970 1980 1990 2000 2010
Consumpt ion 0 50 100 150 200 250
Coal (Million tons oil equivalent a-1)
Oil (Million tons a-1)
Figure 6.Time series of annual (dotted line with circles) and 5-year averaged (solid line) OC/BC ratios (top left), BC (top right) and OC deposition fluxes (bottom left) based on the Zuoqiupu ice-core measurements for the time period of 1956–2006. The average values of the
OC/BC ratio, BC and OC during 1956–1979 are marked by dashed lines. BC and OC emissions in South Asia (Bond et al., 2007) and the
corresponding OC/BC emission ratios are illustrated with gray triangles, and with red diamonds for emissions in India (Lu et al., 2011).
Coal and oil consumption data are shown in the bottom-right panel (BP Group, 2009).
exhaust sources, and analyzed OC and BC with a DRI ther-mal/optical carbon analyzer (Model 2001). They reported av-erage OC/BC ratios of 60.3, 12.0, and 4.1 for biomass
burn-ing, coal combustion and vehicle exhaust, respectively. The increasing OC/BC ratios based on the ice-core
measure-ments since the early 1990s (Fig. 6) suggest expanded coal consumption and/or usage of biomass fuel, although the ra-tios might have been underestimated, because water-soluble OC was not captured in the sample analyses. However, such bias would have occurred in all the samples and had little im-pact on the trend, unless including water-soluble OC could dominate the temporal variation of the OC/BC ratio. Oth-erwise, our results indicate that the relative contribution of coal combustion and biomass burning to the carbonaceous particles deposited into the ice core in the southeastern Ti-betan Plateau has been increasing faster than the contribution of fossil fuel combustion since the early 1990s. Improved combustion technologies may have reduced both BC and OC emissions from the combustion of the same amount of fuels, but the influence on the OC/BC ratio is unclear.
Presum-ably, improved combustion technologies after 1990 in South and East Asia did not dominate the OC/BC ratio.
The temporal variations of BC and OC in the Zuoqiupu ice core, along with the source attribution analysis of the CAM5 model results, suggest an increasing trend in emissions and altered emission sources in South Asia during the late twen-tieth century. Coal has been the primary energy source in South Asia. For example, in India, coal accounted for 41 % of the total primary energy demand in 2007, followed by
biomass (27 %) and oil (24 %) (IEA, 2009). The consump-tion data of coal and crude oil in South Asia (BP Group, 2009) is compared with the BC and OC fluxes in Fig. 6 (bot-tom right). Coal consumption had an increasing trend from 1965 to 2008, particularly in the two time periods 1980–1995 and 2003–2008 after a leveling off during 1996–2002. This trend is consistent with the variations of BC and OC depo-sition fluxes in the Zuoqiupu ice core. The correlations be-tween coal consumption and BC (R2=0.43, p<0.001) and OC (R2=0.62, p<0.001) in the ice core are both statisti-cally significant. The oil consumption had a comparable in-creasing trend as coal before it slowed down during 2000– 2006.
Biomass is the second largest energy resource in South Asia, and it is essential in rural areas. In India, 70 % of the population lives in rural areas, and depends substan-tially on solid fuels (i.e., firewood, animal dung, and agri-culture residues) for cooking and heating (Heltberg et al., 2000). Even in urban areas, biomass contributes 27 % of the household cooking fuel (Venkataraman et al., 2010). Although the consumption of biomass is lower than coal, the OC/BC emission ratio for biomass burning is much higher than from coal combustion (60.3 vs. 12.0) (Cao et al., 2005). The BC emission factor for biomass burning (varying from 0.48±0.18 g kg−1for savanna and grassland
burning to 1.5 g kg−1 for charcoal burning) is also
gener-ally higher than that for coal (0.2 g kg−1for most
combus-tion condicombus-tions) and oil combuscombus-tion (0.3 g kg−1on average,
M. Wang et al.: Carbonaceous aerosols recorded in a southeastern Tibetan glacier 1199
for diesel) (Andreae and Merlet, 2001; Bond et al., 2004, 2007). Therefore, it is very likely that the OC/BC ratio of
atmospheric carbonaceous aerosols and in the ice-core sam-ples (Fig. 6) was dominated by biomass burning emissions. Previous studies have concluded that carbonaceous aerosol emissions from biomass burning are the largest source in South Asia (Venkataraman et al., 2005; Gustafsson et al., 2009). A general increase in energy-intensive lifestyles as-sociated with the accelerated growth of population and econ-omy put pressure on energy resources, and induced energy transitions and the use of non-sustainable biomass in South Asia (Sathaye and Tyler, 1991; Pachauri, 2004; Fernandes et al., 2007). For instance, biofuel consumption in South Asia increased by 21 % per decade on average during 1950–2000 (Bond et al., 2007; Fernandes et al., 2007). In addition, fuel wood, a more desirable biofuel option, contributed 68 % in 1978 to total energy demand by rural populations in India, and increased to 78 % in 2000 (Fernandes et al., 2007).
3.5 Radiative forcing induced by carbonaceous aerosols in Tibetan glaciers
BC is often the most important light-absorbing impurity in surface snow because of its strong absorption of solar radia-tion. The effect of BC in snow on surface albedo reduction and the resultant positive radiative forcing have been widely addressed and reported (e.g., Warren and Wiscombe, 1980; Clarke and Noone, 1985; Hansen and Nazarenko, 2004; Hadley and Kirchstetter, 2012; Flanner et al., 2007; 2009; McConnell et al., 2007; Ming et al., 2008; Kaspari et al., 2011; Qian et al., 2011, 2014, 2015). In contrast, the im-pact of OC in snow has not been widely assessed because of its relatively weak light absorption over the entire spectrum compared to BC, and because of large uncertainties associ-ated with OC light-absorbing properties and measurements of OC in snow. However, there has been increasing interest in light-absorbing OC (a.k.a. brown carbon) and its radiative effect in both the atmosphere and snow. A growing number of studies (e.g., Kirchstetter et al., 2004; Andreae and Gelenc-sér, 2006; Hoffer et al., 2006; Yang et al., 2009; Kirchstetter and Thatcher, 2012) have reported that airborne brown car-bon can contribute significantly to aerosol light absorption in the atmosphere, although there are still substantial uncer-tainties in quantifying optical properties of brown carbon, which makes the model estimation of OC radiative forcing difficult. Similarly, the importance of OC absorption in snow has been recognized and suggested for inclusion in model-ing aerosol snow-albedo effects (e.g., Flanner et al., 2009; Aoki et al., 2011). Observational analysis of light-absorbing particles in Arctic snow reported that the main non-BC com-ponent is brown carbon, which accounted for 20–50 % of the visible and ultraviolet absorption (Hegg et al., 2009, 2010; Doherty et al., 2010). In the rural area of central northern China, brown carbon in winter snow also played an impor-tant role in visible light absorption, which contributed about
60 % to light absorption at 450 nm and about 40 % at 600 nm (X. Wang et al., 2013). A more recent observational study by Dang and Hegg (2014) quantified the light absorption by different light-absorbing particulates in snow, and suggested that humic-like substances and polar OC contributed 9 and 4 % to the total light absorption, respectively. Despite the substantial uncertainties in brown carbon optical properties, a recent global modeling study (Lin et al., 2014), in which a range of optical properties of brown carbon taken from the literature were applied to OC-in-snow concentrations simu-lated in a global chemical transport model, showed that the global OC forcing in land snow and sea ice is up to 24 % of that caused by BC. Thus, the contribution of OC in snow to the surface albedo reduction is likely to be important, which has also been considered in recent climate modeling studies (Qian et al., 2015).
In this study, we use the SNICAR online model (available at http://snow.engin.umich.edu/; Flanner et al., 2007) to esti-mate radiative forcing induced by the observed BC as if they were present in snow. A detailed description of the SNICAR model has been documented by Flanner and Zender (2005, 2006) and Flanner et al. (2007). Here we only briefly de-scribe the setup of input parameters required for running the SNICAR model. A mass absorption cross section (MAC) of 7.5 m2g−1at 550 nm for uncoated BC particles (Bond and
Bergstrom, 2006) is assumed to be same as the default value, and thus one of the input parameters for adjusting the MAC value in the online SNICAR model, the MAC scaling fac-tor, is set to 1. According to the previous studies (Cuffey and Paterson, 2010; Wiscombe and Warren 1980) and measure-ments in the Qiyi glacier and the Zuoqiupu glacier, an effec-tive radius of 100 µm with a density of 60 kg m−3 for new
snow, and an effective radius of 400 µm with a density of 400 kg m−3for aged snow, are adopted for the forcing
calcu-lation. As we focus on the estimation of radiative forcing by carbonaceous particles, other impurity contents, such as dust and volcanic ash, are set to zero. The annual mean BC con-centration during 1956–1979 was 4.4 ng g−1, and increased
to 12.5 ng g−1in 2006. As a consequence, the annual mean
radiative forcing induced by BC in snow, as calculated by the SNICAR model, nearly proportionally increases from 0.75 to 1.95 W m−2. Our estimate of mean BC forcing is lower
than the estimated Eurasian radiative forcing (2.7 W m−2)in
spring (Flanner et al., 2009), but it is comparable to that in the East Rongbuk glacier over the Himalayas, which was in the range of 1–2 W m−2(Ming et al., 2008). Kaspari et al. (2009)
reported a threefold increase in radiative forcing from BC in snow over the Himalayas after 1975, which is consistent with the increasing trend in our results.
(Kirchstet-ter et al., 2004), and assume a constant factor of 0.08 (i.e., 0.6/7.5) to scale down MAC values of BC at all
wave-lengths to obtain a first-order guess of OC-in-snow forcing using SNICAR. The estimated OC forcing has a fourfold increase from 0.2 W m−2 (for a mean OC concentration of
13.8 ng g−1during 1956–1979) to 0.84 W m−2(for a mean
OC concentration of 61.3 ng g−1in 2006), which are 27 and
43 % of the corresponding BC-in-snow forcing, respectively. The OC/BC forcing ratios based on our simple guesses are larger than the upper bound of the estimates (i.e., 24 %) by Lin et al. (2014).
Two main assumptions could have caused our first-order estimate of OC forcing to have large biases. First, the MAC value of 0.6 m2g−1 (at 550 nm) was based on OC
ex-tracted from biomass burning samples that tends to have a higher absorption efficiency than OC emitted from fossil fuel combustion (Kirchstetter et al., 2004). This may cause an overestimation of OC forcing. Second, we treated all the water-insoluble OC from the ice-core measurements as light-absorbing brown carbon in the forcing estimation, which also likely results in an overestimation of OC forcing if a signif-icant fraction of OC is non-absorbing. However, the water-soluble part, accounting for about half of OC observed in the Manora peak and northwestern India (Ram et al., 2010; Rajput et al., 2014), can also contribute to some absorption of UV and visible light (Chen and Bond, 2010; Beine et al., 2011). Thus, the absorption by water-soluble OC that was not included in the forcing estimate may compensate for the high bias to some extent. According to a laboratory study by Chen and Bond (2010), a large fraction of absorbing OC from hard wood burning is water-insoluble. As water-insoluble OC recorded in the ice core herein was very likely domi-nated by biomass burning emissions (Sect. 3.4), the second assumption we used here may not cause a huge bias in esti-mating OC forcing in snow.
It is also important to note that we did not consider varia-tions in chemical compounds of OC, the changes in OC dur-ing sample filtration, and the different spectral dependence of OC and BC absorption. Although such uncertainties can also cause bias in the estimation of OC radiative forcing herein, the increasing trend should be robust.
BC and OC concentrations in the ice core increased rapidly after 1980, and the induced radiative forcing rose as a consequence. According to the estimates using the SNICAR model, the average BC radiative forcing had increased 43 % after 1980, and OC radiative forcing had an increase of 70 %. These numbers are by no means accurate, but the stronger in-creasing trend in the ice-core recorded OC than in BC during 1990–2006 (Fig. 6) suggests that the contribution of OC to the total radiative forcing in the glacier induced by snow/ice impurities deserves more attention.
4 Summary and conclusions
Light-absorbing carbonaceous aerosols can induce signifi-cant warming in the atmosphere and in snow and glaciers, which likely accelerates the melting of glaciers over the Himalayas and the Tibetan Plateau. Ice-core measurement of carbonaceous aerosols is a useful mechanism for eval-uating historical emission inventories and revealing long-term changes in anthropogenic aerosols and their impacts on regional climate. In this study, we analyze carbonaceous aerosols recorded in an ice core (97 m in depth and 9.5 cm in diameter) retrieved from the Zuoqiupu glacier (96.92◦E, 29.21◦N, 5600 m above sea level) in the southeastern Ti-betan Plateau for their seasonal dependence and long-term trend. The glacier has a unique geographical location that is in close proximity to major Asian emission sources. With the help of a global climate model (CAM5) in which black carbon (BC) emitted from different source regions can be explicitly tracked, we are able to characterize BC source– receptor relationships between four Asian source regions (i.e., South Asia, East Asia, Southeast Asia and Central Asia) and the Zuoqiupu glacier area as a receptor. We also esti-mate the radiative forcing in snow due to BC and OC using the ice-core measurements and an offline snow–ice–aerosol– radiation model (called SNICAR).
BC and OC concentrations in small segments of the Zuoqi-upu ice core were measured using a thermal-optical method. Ice-core dating based on significant seasonal variations of oxygen isotope ratios (δ18O) was used to construct the time
series of BC and OC concentrations, which turned out to span the time period of 1956–2006. Not only do the con-centrations of OC and BC in the ice core exhibit significant differences between the summer monsoon and non-monsoon seasons, which is likely due to changes in transport pathways and wet removal, but the ratio of OC to BC also shows a clear seasonal dependence that might be due to seasonal change in contributions from source regions and/or emission sectors. The CAM5 results show a similar seasonal dependence of BC and OC deposition onto the glacier.
M. Wang et al.: Carbonaceous aerosols recorded in a southeastern Tibetan glacier 1201
The annual mean BC and OC deposition fluxes into the ice core are also estimated to explore the interannual variations and long-term trends. Results show stable and relatively low BC and OC fluxes from the late 1950s to 1979, followed by a steady increase through the mid-1990s. A more rapid in-crease occurred after the minimum in 2002. The BC and OC deposition fluxes in 2006 were 2 and 3 times the respective average before 1980.
The overall increasing trend in deposition fluxes since 1980 is consistent with the BC and OC emissions in South Asia as the major contributor. Moreover, the increasing trend of the OC/BC ratio since the early 1990s indicates a growth
of the contribution of coal combustion and/or biomass burn-ing to the carbonaceous aerosol emissions in the major con-tributing source regions, which is consistent with the trends in the consumption of coal, oil and biomass in South Asia.
Our offline calculation using the SNICAR model shows a significant increase in radiative forcing induced by the ob-served BC and OC in snow after 1980, which has implica-tions for the Tibetan glacier melting and availability of water resources in the surrounding regions. More attention to OC is merited because of its non-negligible light absorption and the recent rapid increases evident in the ice-core record.
Acknowledgements. This work was supported by the China
National Funds for Distinguished Young Scientists and the Na-tional Natural Science Foundation of China, including 41125003, 41101063, and 2009CB723901. H. Wang, Y. Qian and P. J. Rasch were supported by the US Department of Energy (DOE), Office of Science, Biological and Environmental Research as part of the Earth System Modeling program. R. Zhang acknowledges support from the China Scholarship Fund. PNNL is operated for DOE by Battelle Memorial Institute under contract DE-AC05-76RLO1830. The National Center for Atmospheric Research is sponsored by the National Science Foundation. We thank Z. Guo and S. Yang for providing the observations of snow.
Edited by: X. Xu
References
Andreae, M. O. and Gelencsér, A.: Black carbon or brown car-bon? The nature of light-absorbing carbonaceous aerosols, At-mos. Chem. Phys., 6, 3131–3148, doi:10.5194/acp-6-3131-2006, 2006.
Andreae, M. O. and Merlet, P.: Emission of trace gases and aerosols from biomass burning, Global Biogeochem. Cy., 15, 955–966, doi:10.1029/2000GB001382, 2001.
Aoki, T., Kuchiki, K., Niwano, M., Kodama, Y., Hosaka, M., and Tanaka T.: Physically based snow albedo model for calculat-ing broadband albedos and the solar heatcalculat-ing profile in snowpack for general circulation models, J. Geophys. Res., 116, D11114, doi:10.1029/2010JD015507, 2011.
Auffhammer, M., Ramanathan, V., and Vincent, J. R.: Integrated model shows that atmospheric brown clouds and greenhouse
gases have reduced rice harvests in India, P. Natl. Acad. Sci. USA, 103, 19668–19672, 2006.
Beine, H., Anastasio, C., Esposito, G., Patten, K., Wilkening, E., Domine, F., Voisin, D., Barret, M., Houdier, S., and Hall, S.: Sol-uble, light-absorbing species in snow at Barrow, Alaska, J. Geo-phys. Res., 116, D00R05, doi:10.1029/2011JD016181, 2011. Bond, T. C. and Bergstrom, R. W.: Light absorption by
carbona-ceous particles: an investigative review, Aerosol. Sci. Tech., 40, 27–67, 2006.
Bond, T. C., Streets, D. G., Yarber, K. F., Nelson, S. M., Woo, J., and Klimont, Z.: A technology based global inventory of black and organic carbon emissions from combustion, J. Geophys. Res., 109, D14203, doi:10.1029/2003JD003697, 2004.
Bond, T. C., Bhardwaj, E., Dong, R., Jogani, R., Jung, S., Ro-den, C., Street, D. G., and Trautmann, N. M.: Historical emis-sions of black and organic carbon aerosol from energy-related combustion, 1850–2000, Global Biogeochem. Cy., 21, GB2018, doi:10.1029/2006GB002840, 2007.
BP Group: BP Statistical Review of World Energy June 2009, Re-port, BP p.l.c., London, UK, 45 pp., 2009.
Cao, J., Wu, F., Chow, J. C., Lee, S. C., Li, Y., Chen, S. W., An, Z. S., Fung, K. K., Watson, J. G., Zhu, C. S., and Liu, S. X.: Characteri-zation and source apportionment of atmospheric organic and ele-mental carbon during fall and winter of 2003 in Xi’an, China, At-mos. Chem. Phys., 5, 3127–3137, doi:10.5194/acp-5-3127-2005, 2005.
Cao, J., Zhu, C., Chow, J. C., Liu, W., Han, Y., and Watson, J. G.: Stable carbon and oxygen isotopic composition of carbonate in fugitive dust in the Chinese Loess Plateau, Atmos. Environ., 42, 9118–9122, 2008.
Cao, J., Tie, X., Xu, B., Zhao, Z., Zhu, C., Li, G., and Liu, S.: Mea-suring and modeling black carbon (BC) contamination in the SE Tibetan Plateau, J. Atmos. Chem., 67, 45–60, 2010.
Chen, Y. and Bond, T. C.: Light absorption by organic carbon from wood combustion, Atmos. Chem. Phys., 10, 1773–1787, doi:10.5194/acp-10-1773-2010, 2010.
Chow, J. C. and Watson, J. G.: PM2.5 carbonate
concentra-tions at regionally representative interagency monitoring of pro-tected visual environment sites, J. Geophys. Res, 107, 8344, doi:10.1029/2001JD000574, 2002.
Chow, J. C., Watson, J. G., Pritchett, L. C., Pierson, W. R., Frazier, C. A., and Purcell, R. G.: The DRI thermal/optical reflectance carbon analysis system: description, evaluation and applications in US air quality studies, Atmos. Environ., 27, 1185–1201, 1993. Clarke, A. D. and Noone, K. J.: Soot in the Arctic snowpack: a cause for perturbations in radiative transfer, Atmos. Environ., 19, 2045–2053, 1985.
Cong, Z., Kang, S., and Qin, D.: Seasonal features of aerosol parti-cles recorded in snow from Mt. Qomolangma (Everest) and their environmental implications, J. Environ. Sci., 21, 914–919, 2009. Cuffey, K. M. and Paterson, W. S. B. (Eds.): The physics of glaciers, Fourth Edition, Academic Press, Burlington, USA, 11–29, 2010. Dang, C. and Hegg, D. A.: Quantifying light absorption by or-ganic carbon in Western North American snow by serial chem-ical extractions, J. Geophys. Res. Atmos., 119, 10247–10261, doi:10.1002/2014JD022156, 2014.
Atmos. Chem. Phys., 10, 11647–11680, doi:10.5194/acp-10-11647-2010, 2010.
Ducret, J. and Cachier, H.: Particulate carbon content in rain at var-ious temperate and tropical locations, J. Atmos. Chem., 15, 55– 67, 1992.
Fernandes, S. D., Trautmann, N. M., Streets, D. G., Roden, C. A., and Bond, T. C.: Global biofuel use, 1850–2000, Global Bio-geochem. Cy., 21, GB2019, doi:10.1029/2006GB002836, 2007. Flanner, M. G. and Zender, C. S.: Snowpack radiative heating: influence on Tibetan Plateau climate, Geophys. Res. Lett., 32, L06501, doi:10.1029/2004GL022076, 2005.
Flanner, M. G. and Zender, C. S.: Linking snowpack micro-physics and albedo evolution, J. Geophys. Res., 111, D12208, doi:10.1029/2005JD006834, 2006.
Flanner, M. G., Zender, C. S., Randerson, J. T., and Rasch, P. J.: Present-day climate forcing and response from black carbon in snow, J. Geophys. Res., 112, D11202, doi:10.1029/2006JD008003, 2007.
Flanner, M. G., Zender, C. S., Hess, P. G., Mahowald, N. M., Painter, T. H., Ramanathan, V., and Rasch, P. J.: Springtime warming and reduced snow cover from carbonaceous particles, Atmos. Chem. Phys., 9, 2481–2497, doi:10.5194/acp-9-2481-2009, 2009.
Gustafsson, Ö, Kruså, M., Zencak, Z., Sheesley, R. J., Granat, L., Engström, E., Praveen, P. S., Rao, P. S. P., Leck, C., and Rodhe, H.: Brown clouds over South Asia: Biomass or fossil fuel com-bustion?, Science, 323, 495–497, 2009.
Hadley, O. L. and Kirchstetter, T. W.: Black-carbon reduction of snow albedo, Nat. Clim. Change, 2, 437–440, 2012.
Hansen, J. and Nazarenko, L.: Soot climate forcing via snow and ice albedos, P. Natl. Acad. Sci. USA, 101, 423–428, 2004. Hegg, D. A., Warren, S. G., Grenfell, T. C., Doherty, S. J., Larson, T.
V., and Clarke, A. D.: Source attribution of black carbon in snow, Env. Sci. Tech., 43, 4016–4021, doi:10.1021/es803623f, 2009. Hegg, Dean A., Warren, Stephen G., Grenfell, Thomas C., Sarah
J. Doherty, and Clarke, Antony D.: Sources of light-absorbing aerosol in arctic snow and their seasonal variation, Atmos. Chem. Phys., 10, 10923–10938, doi:10.5194/acp-10-10923-2010, 2010. Heltberg, R., Arndt, T. C., and Sekhar, N. U.: Fuelwood consump-tion and forest degradaconsump-tion: a household model for domestic en-ergy consumption in rural India, Land Econ., 76, 213–232, 2000. Hoffer, A., Gelencsér, A., Guyon, P., Kiss, G., Schmid, O., Frank, G. P., Artaxo, P., and Andreae, M. O.: Optical properties of humic-like substances (HULIS) in biomass-burning aerosols, At-mos. Chem. Phys., 6, 3563–3570, doi:10.5194/acp-6-3563-2006, 2006.
IEA: Chapter 9 – Country and regional profiles in the 450 Scenario, in: World Energy Outlook 2009, International Energy Agency, France, 319–362, 2009.
IPCC: Climate Change 2013: The Physical Science Basis, Con-tribution of Working Group I to the Fourth Assessment Report of the Intergovernmental Panel on Climate Change, edited by: Solomon, S., Qin, D., Manning, M., Chen, Z., Marquis, M., Av-eryt, K. B., Tignor M., and Miller, H. L., Cambridge University Press, Cambridge, United Kingdom and New York, NY, USA, 996 pp., 2013.
Ito, A. and Penner, J. E.: Historical emissions of carbona-ceous aerosols from biomass and fossil fuel burning for the
period 1870–2000, Global Biogeochem. Cy., 19, GB2028, doi:10.1029/2004GB002374, 2005.
Jacobson, M. Z.: Strong radiative heating due to the mixing state of black carbon in atmospheric aerosols, Nature, 409, 695–697, 2001.
Kaspari, S. D., Schwikowski, M., Gysel, M., Flanner, M. G., Kang, S., Hou, S., and Mayewski, P. A.: Resent increase in black carbon concentrations from a Mt. Everest ice core spanning 1860–2000 AD, Geophys. Res. Lett., 38, L04703, doi:10.1029/2010GL046096, 2011.
Kaspari, S., Painter, T. H., Gysel, M., Skiles, S. M., and Schwikowski, M.: Seasonal and elevational variations of black carbon and dust in snow and ice in the Solu-Khumbu, Nepal and estimated radiative forcings, Atmos. Chem. Phys., 14, 8089– 8103, doi:10.5194/acp-14-8089-2014, 2014.
Kirchstetter, T. W. and Thatcher, T. L.: Contribution of organic car-bon to wood smoke particulate matter absorption of solar radia-tion, Atmos. Chem. Phys., 12, 6067–6072, doi:10.5194/acp-12-6067-2012, 2012.
Kirchstetter, T. W., Novakov, T., and Hobbs, P. V.: Evidence that the spectral dependence of light absorption by aerosol is affected by organic carbon, J. Geophys. Res., 109, D21208, doi:10.1029/2004JD004999, 2004.
Lamarque, J.-F., Bond, T. C., Eyring, V., Granier, C., Heil, A., Klimont, Z., Lee, D., Liousse, C., Mieville, A., Owen, B., Schultz, M. G., Shindell, D., Smith, S. J., Stehfest, E., Van Aar-denne, J., Cooper, O. R., Kainuma, M., Mahowald, N., Mc-Connell, J. R., Naik, V., Riahi, K., and van Vuuren, D. P.: His-torical (1850–2000) gridded anthropogenic and biomass burning emissions of reactive gases and aerosols: methodology and ap-plication, Atmos. Chem. Phys., 10, 7017–7039, doi:10.5194/acp-10-7017-2010, 2010.
Lin, G., Penner, J. E., Flanner, M. G., Sillman, S., Xu, L., and Zhou, C.: Radiative forcing of organic aerosol in the atmosphere and on snow: Effects of SOA and brown carbon, J. Geophys. Res. Atmos., 119, 7453–7476, doi:10.1002/2013JD021186, 2014. Liu, X., Easter, R. C., Ghan, S. J., Zaveri, R., Rasch, P., Shi, X.,
Lamarque, J.-F., Gettelman, A., Morrison, H., Vitt, F., Conley, A., Park, S., Neale, R., Hannay, C., Ekman, A. M. L., Hess, P., Mahowald, N., Collins, W., Iacono, M. J., Bretherton, C. S., Flan-ner, M. G., and Mitchell, D.: Toward a minimal representation of aerosols in climate models: description and evaluation in the Community Atmosphere Model CAM5, Geosci. Model Dev., 5, 709–739, doi:10.5194/gmd-5-709-2012, 2012.
Lu, Z., Zhang, Q., and Streets, D. G.: Sulfur dioxide and primary carbonaceous aerosol emissions in China and India, 1996–2010, Atmos. Chem. Phys., 11, 9839–9864, doi:10.5194/acp-11-9839-2011, 2011.
Lu, Z., Streets, D. G., Zhang, Q., and Wang, S.: A novel back-trajectory analysis of the origin of black carbon transported to the Himalayas and Tibetan Plateau during 1996–2010, Geophys. Res. Lett., 39, L01809, doi:10.1029/2011GL049903, 2012. Ma, P.-L., Rasch, P. J., Wang, H., Zhang, K., Easter, R. C., Tilmes,
S., Fast, J. D., Liu, X., Yoon, J.-H., and Lamarque, J.-F.: The role of circulation features on black carbon transport into the Arc-tic in the Community Atmosphere Model Version 5 (CAM5), J. Geophys. Res.-Atmos., 118, 4657–4669, 2013.
M. Wang et al.: Carbonaceous aerosols recorded in a southeastern Tibetan glacier 1203
and Bonasoni, P.: Aerosol mass and black carbon concentrations, a two year record at NCO-P (5079 m, Southern Himalayas), At-mos. Chem. Phys., 10, 8551–8562, doi:10.5194/acp-10-8551-2010, 2010.
McConnell, J., Edwards, R. L., Kok, G. L., Flanner, M. G., Zender, C. S., Saltzman, E. S., Banta, J. R., Pasteris, D. R., Carter, M. M., and Kahl, J. D. W.: 20th century industrial black carbon emis-sions altered Arctic climate forcing, Science, 317, 1381–1384, 2007.
Ménégoz, M., Krinner, G., Balkanski, Y., Boucher, O., Cozic, A., Lim, S., Ginot, P., Laj, P., Gallée, H., Wagnon, P., Marinoni, A., and Jacobi, H. W.: Snow cover sensitivity to black carbon depo-sition in the Himalayas: from atmospheric and ice core measure-ments to regional climate simulations, Atmos. Chem. Phys., 14, 4237–4249, doi:10.5194/acp-14-4237-2014, 2014.
Menon, S., Hansen, J., Nazarenko, L., and Luo, Y.: Climate effects of black carbon aerosols in China and India, Science, 297, 2250– 2253, 2002.
Ming, J., Cachier, H., Xiao, C., Qin, D., Kang, S., Hou, S., and Xu, J.: Black carbon record based on a shallow Himalayan ice core and its climatic implications, Atmos. Chem. Phys., 8, 1343– 1352, doi:10.5194/acp-8-1343-2008, 2008.
Ming, J., Xiao, C., Du, Z., and Yang, X.: An overview of black carbon deposition in High Asia glaciers and its im-pacts on radiation balance, Adv. Water Resour., 55, 80–87, doi:10.1016/j.advwatres.2012.05.015, 2013.
Neale, R. B., Chen, C.-C., Gettelman, A., Lauritzen, P. H., Park, S., Williamson, D. L., Conley, A. J., Garcia, R., Kinnison, D., Lamarque, J.-F., Marsh, D., Mills, M., Smith, A. K., Tilmes, S., Vitt, F., Cameron-Smith, P., Collins, W. D., Iacono, M. J., Easter, R. C., Ghan, S. J., Liu, X., Rasch, P. J., and Taylor, M. A.: De-scription of the NCAR Community Atmosphere Model (CAM
5.0), NCAR/TN-486+STR, available at: http://www.cesm.ucar.
edu/models/cesm1.0/cam/docs/description/cam5_desc.pdf (last access: 25 November 2014), 2012.
Novakov, T., Andreae, M. O., Gabriel, R., Kirchstetter, T. W., Mayol-Bracero, O. L., and Ramanathan, V.: Origin of carbona-ceous aerosols over the tropical Indian Ocean: Biomass burning or fossil fuels, Geophys. Res. Lett., 27, 4061–4064, 2000. Novakov, T., Ramanathan, V., Hansen, J. E., Kirchstetter, T. W.,
Sato, M., Sinton, J. E., and Sathaye, J. A.: Large historical changes of fossil-fuel black carbon aerosols, Geophys. Res. Lett., 30, 1324, doi:10.1029/2002GL016345, 2003.
Pachauri, R. K.: The future of India’s economic growth: the natural resources and energy dimension, Futures, 36, 703–713, 2004. Qian, Y., Flanner, M. G., Leung, L. R., and Wang, W.:
Sensitiv-ity studies on the impacts of Tibetan Plateau snowpack pollu-tion on the Asian hydrological cycle and monsoon climate, At-mos. Chem. Phys., 11, 1929–1948, doi:10.5194/acp-11-1929-2011, 2011.
Qian, Y., Wang, H., Zhang, R., Flanner, M. G., and Rasch, P. J.: A Sensitivity Study on Modeling Black Carbon in Snow and its Radiative Forcing over the Arctic and Northern China, Environ. Res. Lett., 9, 064001, doi:10.1088/1748-9326/9/6/064001, 2014. Qian, Y., Yasunari, T. J., Doherty, S. J., Flanner, M. G., Lau, W. K. M., Ming, J., Wang, H., Wang, M., Warren, S. G., and Zhang, R.: Light-absorbing Particles in Snow and Ice: Measurement and Modeling of Climatic and Hydrological Impact, Adv. Atmos. Sci., 32, 64–91, doi:10.1007/s00376-014-0010-0, 2015.
Rajput, P., Sarin, M., Sharma, D, and Singh, D.: Characteristics and emission budget of carbonaceous species from post-harvest agricultural-waste burning in source region of the Indo-Gangetic Plain, Tellus B, 66, 21026, doi:10.3402/tellusb.v66.21026, 2014. Ram, K., Sarin, M. M., and Hegde, P.: Long-term record of aerosol optical properties and chemical composition from a high-altitude site (Manora Peak) in Central Himalaya, Atmos. Chem. Phys., 10, 11791–11803, doi:10.5194/acp-10-11791-2010, 2010. Ramanathan, V. and Carmichael, G.: Global and regional climate
changes due to black carbon, Nat. Geosci., 1, 221–227, 2008. Ramanathan, V., Chung, C., Kim, D., Bettge, T., Buja, L., Kiehl,
J. T., Washington, W. M., Fu, Q., Sikka, D. R., and Wild, M.: Atmospheric brown clouds: impacts on South Asian climate and hydrological cycle, P. Natl. Acad. Sci. USA, 102, 5326–5333, 2005.
Ramanathan, V., Ramana, M. V., Roberts, G., Kim, D., Corrigan, C., Chung, C., and Winker, D.: Warming trends in Asia amplified by brown clouds solar absorption, Nature, 448, 575–578, 2007. Reddy, M. S. and Venkataraman, C.: Inventory of aerosol and
sul-phur dioxide emissions from India. Part II – biomass combustion, Atmos. Environ., 36, 699–712, 2002.
Revelle, R.: Energy use in rural India, Science, 192, 969–975, 1976. Rienecker, M. M., Suarez, M. J., Gelaro, R., Todling, R., Bacmeis-ter, J., Liu, E., Bosilovich, M. G., Schubert, S. D., Takacs, L., Kim, G.-K., Bloom, S., Chen, J., Collins, D., Conaty, A., da Silva, A., Gu, W., Joiner, J., Koster, R. D., Lucchesi, R., and Molod, A.: MERRA – NASA’s Modern-Era Retrospective Anal-ysis for Research and Applications, J. Clim., 24, 3624–3648, 2011.
Sarka, S., Chokngamwong, R., Cervone, G., Singh, R. P., and Kafatos, M.: Variability of aerosol optical depth and aerosol forc-ing over India, Adv. Space Res., 37, 2153–2159, 2006.
Sathaye, J. and Tyler, S.: Transitions in household energy use in urban China, India, the Philippines, Thailand, and Hong Kong, Annu. Rev. Energ. Environ., 16, 295–335, 1991.
Stone, E. A., Lough, G. C., Schauer, J. J., Praveen, P. S., Corri-gan, C. E, and Ramanathan, V.: Understanding the origin of black carbon in the atmospheric brown cloud over the Indian Ocean, J. Geophys. Res., 112, D22S23, doi:10.1029/2006JD008118, 2007. Streets, D. G. and Waldhoff, S. T.: Biofuel use in Asia and
acidify-ing emissions, Energy, 23, 1029–1042, 1998.
Tie, X., Wu, D., and Brasseur, G.: Lung cancer mortality and expo-sure to atmospheric aerosol particles in Guangzhou, China, At-mos. Environ., 43, 2375–2377, 2009.
Venkataraman, C., Habib, G., Eiguren-Fernandez, A., Miguel, A. H., and Friedlander, S. K.: Residential biofuels in South Asia: carbonaceous aerosol emissions and climate impacts, Science, 307, 1454–1456, 2005.
Venkataraman, C., Sagar, A. D., Habib, G., Lam, N., and Smith, K. R.: The Indian National Initiative for advanced biomass cook-stoves: the benefits of clean combustion, Energy Sustain. Dev., 14, 63–72, 2010.
Wang, H., Rasch, P. J., Easter, R. C., Singh, B., Zhang, R., Ma, P. L., Qian, Y., and Beagley, N.: Using an explicit emission tag-ging method in global modeling of source-receptor relationships for black carbon in the Arctic: Variations, Sources and Trans-port pathways, J. Geophys. Res.-Atmos., 119, 12888–12909, doi:10.1002/2014JD022297, 2014.
Wang, X., Doherty, S. J., and Huang, J.: Black carbon and other light-absorbing impurities in snow across North-ern China, J. Geophys. Res. Atmos., 118, 1471–1492, doi:10.1029/2012JD018291, 2013.
Warren, S. G. and Wiscombe, W. J.: A model for the spectral albedo of snow. II: snow containing atmospheric aerosols, J. Atmos. Sci., 37, 2734–2745, 1980.
Wiscombe, W. J. and Warren, S. G.: A model for the spectral albedo of snow. I: Pure snow, J. Atmos. Sci., 37, 2712–2733, 1980. Xu, B., Cao, J., Hansen, J., Yao, T., Joswiak, D. R., Wang, N.,Wu,
G., Wang, M., Zhao, H., Yang, W., Liu, X., and He, J.: Black soot and the survival of Tibetan glaciers, P. Natl. Acad. Sci. USA, 106, 22114–22118, 2009a.
Xu, B., Wang, M., Joswiak, D. R., Cao, J., Yao, T., Wu, G., Yang, W., and Zhao, H.: Deposition of anthropogenic aerosols in a southeastern Tibetan glacier, J. Geophys. Res., 114, D17209, doi:10.1029/2008JD011510, 2009b.
Yang, M., Howell, S. G., Zhuang, J., and Huebert, B. J.: Attri-bution of aerosol light absorption to black carbon, brown car-bon, and dust in China – interpretations of atmospheric measure-ments during EAST-AIRE, Atmos. Chem. Phys., 9, 2035–2050, doi:10.5194/acp-9-2035-2009, 2009.
Zhao, S., Ming, J., Sun, J., and Xiao, C.: Observation of carbona-ceous aerosols during 2006–2009 in Nyainqêntanglha Mountains and the implications for glaciers, Environ. Sci. Pollut. Res., 20, 5827–5838, doi:10.1007/s11356-013-1548-6, 2013.