and
TECHNISCHEN UNIVERSITÄT DARMSTADT
INSTITUTE OF ELECTRONIC MATERIALS
GREGÓRIO COUTO FARIA
Structure and dynamics of
poly(9,9-dioctylfluoren-2,7-diyl-
co
-benzothiadiazole)
(F8BT) and correlations with its electrical
properties
und
UNIVERSIDADE DE SÃO PAULO
INSTITUTO DE FÍSICA DE SÃO CARLOS
Vom Fachbereich Material- und Geowissenschaften zur Erlangung des akademischen Grades Doktor rerum naturalis (Dr. rer. nat.) genehmigte Dissertation von M. Sc. GREGÓRIO COUTO FARIA, geboren am 05.01.1984 in
São Carlos, Brasilien
Structure and dynamics of
poly(9,9-dioctylfluoren-2,7-diyl-
co
-benzothiadiazole)
(F8BT) and correlations with its electrical
properties
Datum der Prüfung: 16.09.2011
São Carlos/Darmstadt D 17
STRUCTURE AND DYNAMICS OF
POLY(9,9-DIOCTYLFLUOREN-2,7-DIYL-
CO
-BENZOTHIADIAZOLE) (F8BT) AND
CORRELATIONS WITH ITS ELECTRICAL
PROPERTIES
Tese apresentada ao Programa de Pós-Graduação do Instituto de Física de São Carlos da Universidade de São Paulo – Brasil e Technischen Universität Darmstadt - Alemanha para obtenção da Dupla Titulação de Doutor em Ciência
Área de concentração: Física Aplicada
Orientadores/Advisors:
Prof. Dr. Eduardo Ribeiro de Azevêdo Prof. Dr. Heinz von Seggern
Versão Corrigida/Final Version
STRUCTURE AND DYNAMICS OF
POLY(9,9-DIOCTYLFLUOREN-2,7-DIYL-
CO
-BENZOTHIADIAZOLE) (F8BT) AND
CORRELATIONS WITH ITS ELECTRICAL
PROPERTIES
Thesis submitted to the Graduate Program of the Instituto de Física de São Carlos/Universidade de São Paulo – Brazil and to Fachbereich Material- und Geowissenschaften/Technischen Universität Darmstadt - Germany in order to obtain the Double Degree of Doctor in Science.
Advisors/Orientadores: Prof. Dr. Heinz von Seggern
Prof. Dr. Eduardo Ribeiro de Azevêdo
Final Version/Versão Corrigida
PESQUISA, DESDE QUE CITADA A FONTE.
REPRODUCTION IS AUTHORIZED WITH APPROPRIATE CITATION
Ficha catalográfica elaborada pelo Serviço de Biblioteca e Informação - IFSC/USP
Faria, Gregório Couto.
Structure and dynamics of poly(9,9-dioctylfluoren-2,7-diyl-co -benzothiadiazole) (F8BT) and correlations with its electrical properties. orientadores/advisors Eduardo Ribeiro de Azevêdo; Heinz von Seggern. Versão Corrigida. São Carlos/Darmstadt 2011.
184 p.
Tese (Doutorado com Dupla Titulacao em Ciencias) – Instituto de Física de São Carlos/Universidade de São Paulo - Brasil e Fachbereich Material- und Geowissenschaften/Technischen Universität Darmstadt – Germany, 2011.
After three years and four months of Ph.D. into two Universities, leading with several different techniques, living in two different countries, I have learned one thing: I could never have done any of these, particularly the research and writing that went into this thesis, without the help, support and encouragement of a lot of people. Therefore, I would like to thank all who directly or indirectly helped me during this period.
First of all, I deeply thank my Brazilian advisor, Prof. Eduardo Ribeiro de Azevêdo, whose friendship, help, advice and supervision was invaluable. I really appreciate his vast knowledge and skill in many areas (e.g., basics physics, fundaments of NMR, quantum mechanics, polymers science and electrical properties). Without his help, this work would not be possible.
A very special thanks goes out to Prof. Heinz von Seggern, my Germany advisor, to be so kind with me during my times in Darmstadt. You have given so much of yourself to help and to teach me a lot of new things. You also have given me the courage to succeed in most of my electrical properties. Many thanks.
I am indebt with Mrs. Bruna Medeiro Hamabata for her patience and dedication helping me revises the English grammar of my text. Thanks for your enthusiasm, even at 10:00 o'clock at night!
I would also like to thank all of my friends from Instituto de Física de São Carlos: Giovani Gozzi, Rafael Henriques Longaresi, Alexandre Maciel, Washington Souza, Marcos Felipe Sampaio, Márcio Cobo, Oigres Bernardinelli, Wesley Bezerra. Not only are you the people I can discuss my research with and goof off with, but also you are confidants who I can discuss my troubles with and who stand by me through thick and thin
Bernd Stoll to be so kind and helpful during the implementation of the Photo-CELIV technique. I want let them know that my times in Darmstadt were one of the best of my life.
Finally, I would like to dedicate this work to my family: my grandfather Francisco Couto, my parents Roberto and Marta Faria, to my syster Julia Faria, and specially, to my grandmother, Ceníria Flávio Simões Couto. Without your unending support and love from childhood to now, I never would have made it through this process or any of the tough times in my life. Thank you. This thesis is also dedicated to my parents in law Gerson Edson and Sônia Toledo Piza for being always in my side. I also must acknowledge my fiancé, partner and best friend, Maria Elisa Toledo Piza, without whose love, encouragement and moral support I would not have finished this thesis.
FARIA, G.F. Korrelation zwischen der molekularen Dynamik und physikalischen Struktur eines Polyfluorenderivats mit den optoelektronischen Eigenschaften von daraus hergestellten Bauteilen. 2011. 180p. Doktorarbeit (Doktor der Naturwissenschaften) - Technischen Universität Darmstadt, Fachbereich Material- und Geowissenschaften, Darmstadt, Germany and Instituto de Física de São Carlos, Universidade de São Paulo, São Carlos, Brazil, 2011.
Der erste Teil der Arbeit befasst sich mit der Untersuchung der molekularen Dynamik und Konformation sowie der molekularen Packung von Polyfluoren-basierten Polymerschichten. Die hauptsächlich verwendeten Analysemethoden waren die Röntgenweitwinkelbeugung (WAXD), die Festkörper-NMR und die dynamisch-mechanische Analyse (DMTA). In dem zweiten Teil der Arbeit wurden polymere Leuchtdioden (PLEDs) mit dem Polyfluorenderivat als Funktionsschicht hergestellt und deren optoelektronische Eigenschaften charakterisiert. Dazu wurden temperaturabhängige Strom-Spannungs-Kennlinien, Impedanzmessungen und Beweglichkeitsmessungen durchgeführt. Das Hauptziel der vorliegenden Arbeit war es, Korrelationen zwischen den molekularen Phänomenen, die im ersten Teil der Arbeit identifiziert wurden, und den Eigenschaften der PLEDs, die im zweiten Teil ermittelt wurden, zu finden.
FARIA, G.F. Structure and dynamics of
poly(9,9-dioctylfluoren-2,7-diyl-co-benzothiadiazole) (F8BT) and correlations with its electrical
properties. 2011. 180p. Thesis (Ph.D in Science) – Instituto de Física de São Carlos, Universidade de São Paulo, São Carlos and Technischen Universität Darmstadt – Germany, 2011.
The PHD project has two main goals. The first one is specifically related to investigations on molecular dynamics, structural conformations and packing of polyfluorene-based polymers. For this purpose, Wide Angle X-Ray Diffraction (WAXD), Solid-State Nuclear Magnetic Resonance (NMR) and Dynamical-Mechanical Thermal Analysis (DMTA) are being used as the main techniques. The second goal is to correlate molecular phenomena, as characterized in the first part, with opto-electronic properties of polyfluorene when used as active layer in an electronic device, such as a Polymer Light-Emitting Diode (PLED). In the second part, fabrication of devices and their electrical characterization as a function of temperature are the main objectives. Impedance Spectroscopy, Current-Voltage characterization of the devices and Time-Of-Flight (TOF) techniques are among the main techniques to be used in the second part of the project. Therefore, the project combines fundamental studies on molecular dynamics with technological performance of organic electronic
Figure 1 – Illustration of the use of polymers as insulating material:
high-voltage wires and houseware objects…………... 37
Figure 2 – The projected global organic electronic market from 2008
until 2017: It is expected to reach the total of 19 billion
dollars of business on 2017
26…..………... 39
Figure 3 - Images from the first full Sony OLED television to go on
sale. Inset: OLED television resolution versus conventional
LED television.
.……...……... 40
Figure 4 - a) Illustration of the main-chain dimerization due to the
Peierls Instability: The band gap in polymeric systems
appears since the length of single and double bound are
different; therefore, the repeat unit has two atoms and the
π
orbital is divided in two; b) Illustration of the sp
2hybridization:
π
orbital of two consecutives carbons
overlaps, giving rise to a delocalized orbital, providing a
“highway” for charge mobility along the polymer
chain………... 42
Figure 6 – Molecular structure of different polyacetylene isomers: a)
the
cis-polyacetylene
and
b)
the
trans-polyacetylene.….………... 44
Figure 7 - Model for transport in low and high-MW films. a) Charge
carriers are trapped on nanorods (highlighted in grey) in the
low MW case. b) Long chains in high-MW films bridge the
ordered regions and soften the boundaries. Figure adapted
from reference 20.
………... 46
Figure 8 – X-ray analysis of a) out of plane and b) in plane diffraction
of P3HT samples with different molecular weight. Note that
low molecular weight films seem to produce high ordered
structure. Figure adapted from reference 20……….. 48
Figure 9 - Molecular structure of Polyparaphenylene vinylene (PPV)
(top)
and
its
derivatives:
poly(2-methoxy-5-(n-hexadecyloxy)-p-phenylene vinylene) (MH-PPV) and
poly[2-methoxy-5-(2
-ethyl-hexyloxy)-1,4-phenylene
vinylene] (MEH-PPV) (botton)……… 52
Poly[(9,9-dioctilfluorenil-2,7-hexil)-fluorenil-2,7-diil-2,5-diphenil-1,2,4-oxadiazole]………… 53
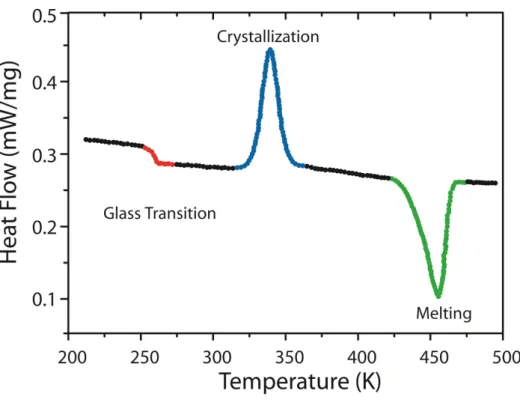
Figure 11 – Example of Differential Scanning Calorimetry (DSC)
experimental results on Polyethylene polymer film: Glass
Transition (T
g) in red, crystallization in blue and the
melting of the ordered structure in green……… 56
Figure 12 - Temperature dependent of the loss tangent measured by
Dynamical-Mechanics Thermal Analysis (DMTA) on
Polyethylene polymer film:
γ
,
β
and
α
are the relaxation of
different segments on the molecule. Figure adapted from
reference 62………. 58
Figure 13 –
1H Nuclear Magnetic Resonance (NMR) signal of Ethanol.
The chemical-shifts differentiate the distinct hydrogen in
the molecule: The two protons of the CH
2group
neighboring the oxygen are further to the left in the
spectrum, whilst the hydrogens of the CH
3group that is
fast regime: isotropic movement. It is possible to observe
that the natural motion of the molecule average the
1H-
1H
coupling, producing a narrowing of the line shape……… 69
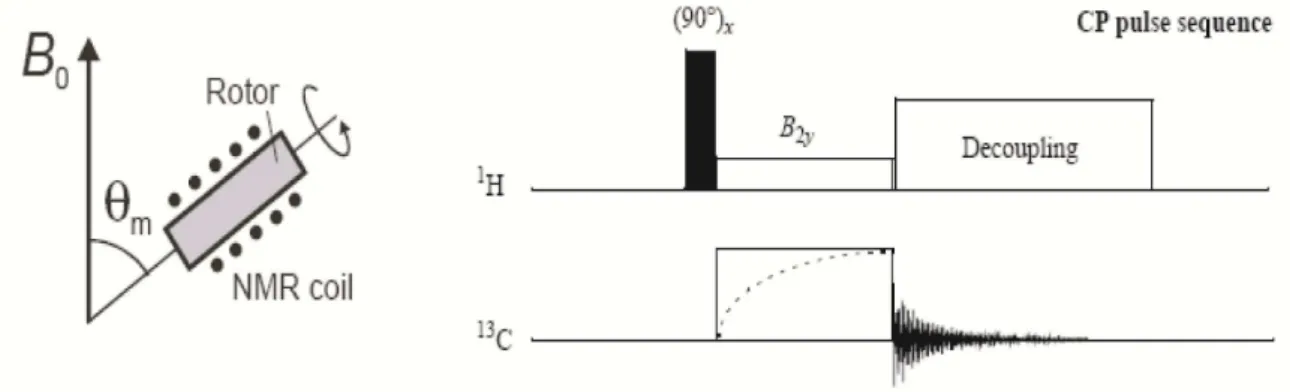
Figure 15 – Schematic illustration of the Magic Angle Spinning (MAS).
When no spinning is applied, the NMR signal is broad,
since it is not possible to align all the internuclear vector in
the magic angle direction (left); however, as shown at the
right side of the figure, when a rotation of
ω
ris applied, the
alignment of the spin around the magic angle is achieved
and a narrowing of the spectra is observed……… 73
Figure 16 – Laboratory, temporary and rotor coordinate systems………. 74
Figure 17 – a) Sample rotation with the internuclear vector aligned
along a direction different from the rotation axis, b)
schematic representation of magnetization dephasing due to
MAS and rotational echo……….. 77
curves with the dipolar coupling intensity……….. 84
Figure 20 – Comparison between the spin dynamics simulation (points)
and equation 43 (lines): Anderson and Weiss approximation
fits fairly good until t
1/t
r= 0.5……… 86
Figure 21 – Top: Exchange NMR sequence and; Botton: examples of
the 2D-signal for several reorientation angles………. 88
Figure 22 - Pulse sequences of the CODEX experiment. Pulse-moving
scheme of the CSA recoupling periods t
evoland t
reconvfor (b)
CONTRA scheme. The length of the mixing period tm must
be actively synchronized with the MAS rotation. Adapted
from reference 80……….. 89
polymer characterized by broad and diffusive rings……… 93
Figure 25 - Idealization (left) and real (right) Current-Voltage (IxV)
characteristics for organic crystals, such as Pentacene.
Observe that, four regions can be found in a regular IxV: an
Ohmic regime, in which the current is proportional to the
electric field; the trap-limited SCLC regime, already
discussed; the Trap-Filled regime, where all traps in the
sample are filled, and finally, the trap-free SCLC……… 99
Figure 26 – Dielectric loss example for the Poly(aryletherketone).
Observe the appearance of the two main relaxation
processes. Inset: Arrhenius plot for both relaxations.
Adapted from reference 62……….. 104
Figure 27 – Illustration of TOF transient: The intersection between the
plateau and the extension of the tail is given by the transit
time………. 106
Figure 28 - Schematic illustration of the Photo-CELIV method. V
maxis the top voltage applied; λ is the nanosecond laser pulse;
Δj is the extracted transiente current; j(0) is the
displacement current; τ
pulseis the length of the voltage pulse;
molecular structure of F8BT……….. 110
Figure 29 – Molecule Structure of the F8BT polymer material……… 112
Figure 30 – Illustration of the sandwich-like devices built for the
electrical measurements: The polymer films were grown on
cleaned ITO substrates and the aluminum cathode were
thermally evaporated………. 113
Figure 31 – Differential Scanning Calorimetry (DSC) data for F8BT
polymer film; (Top) the heating and (Bottom) the cooling
stage……….. 116
Figure 32 – WAXD measurement setup: Left) Sample holder and
detector and Right) Sample holder for each of the
experimental geometries (normal and parallel incidences)….. 118
Figure 33 – Wide Angle X-Ray Diffraction (WAXD) results of F8BT
films at 298 K for incidences, normal and parallel. Top: 2D
images and, Botton: 1D pattern. The inset in the middle
represents the lamellar
β
-phase………. 120
excitation frequencies and, (Right) the Arrhenius plot for
the low-temperature
β
-relaxation………. 123
Figure 36 –
1H NMR results: (Left) spectra for several temperatures.
As the temperature increase the signals get narrower: and
(Right) the line width versus temperature. Two transition
regions is observed, which were attributed to the transition
already measured by DSC and DMTA………..125
Figure 37 – CPMAS results for two temperatures (193 and 373
Kelvins) and the correspondent assignment of carbons and
lines……… 127
Figure 38 - DIPSHIFT curves obtained at several temperatures and
from different carbons on the polymer chain: side chain (a
and b) and main chain (c). The Arrhenius plot of the side
chain carbons are presented at d………. 129
Figure 39 - CONTRA results of: a) carbons 3 and 5; b) carbon 7. It is
possible to observe that the reorientation angle of the main
chain increase with temperature……….. 131
experimental IxV curves of thick films devices………..136
Figure 42 – Top: Absorption Spectrum for F8BT: The laser incidence
wavelength was choose at the maximum of absorption (470
nm). Botton: Comparison between electrons and holes TOF
transient: Observe that electron transient is stronge than
that of holes……….. 139
Figure 43 – Top: Typical current mode TOF transient for electrons at
T = 340 K; the inset we have the same curve in a log-log
representation. Bottom: the calculated mobility for each
measured temperature……….. 140
Figure 44 – Top: Cole-Cole diagram for selected temperature are
presented and Botton: The Real Impedance versus
temperature for selected frequencies are illustrated……… 144
Figure 45 – Arrhenius Plot for the two high-temperature peaks
observed in the real impedance versus temperature curves,
as signed by the inset……… 145
observed in the real impedance versus temperature curves,
as signed by the inset……… 149
Figure 48 - Experimental Current-Voltage characteristics for F8BT
thin-film device for several temperatures………. 151
Figure 49 – Current-Voltage fitting using the model described at
chapter 2. The fitting were made on the SCLC regime for
different temperatures……….. 153
Figure 50 - Calculated mobility at zero-field for each measured
temperature in a
ln − 2graph, studied by the GDM
model.
155
Figure 51 – Absorption spectrum of F8BT: CELIV laser excitation
wavelength was choose to be at 335 nm………. 156
Figure 52 – a) Photo-CELIV current extraction obtained for the
Al/F8BT/ITO device at 350 K. b) Photo-CELIV current
profile for the Al/F8BT/ITO device at several
temperatures. As an inset are the
∆J/J(0)values plotted as
relaxation - tan
δ
- in order to correlate changes in the
mobility with molecular relaxations. b) Plot of t
1/2, t
maxand
t
1/2/t
maxobtained from the CELIV measurements as a
function of 1000/T
2and T………. 161
Figure 54 – Comparison between mobility measured by CELIV and
modeled by Current-Voltage characteristics of thin-film
devices. The blue circle is the dielectric loss in order to
illustrate the correlation between the changes observed on
the mobility curves and the molecular dynamics measured
and discussed in chapter 2……… 165
AC Alternated Current
CELIV Current-Extraction by Linear Increasing Voltage
CODEX Centerband-Only Detection of Exchange
CONTRA Constant Time Recoupling of Anisotropy
CP Cross Polarization
DD Dipolar Decoupling
DIPSHIFT Dipolar Chemical Shift Correlation
DMTA Dinamical-Mechanics Thermal Analysis
DSC Differential Scanning Calorimetry
F8BT Poly(9,9-dioctylfluorene-co-benzothiadiazole)
GPC Gel Permeation Chromatography
HOMO Highest Occupied Molecular Orbital
IS Impedance Spectroscopy
IV Current-Voltage
LC Liquid Crystal
LCD Liquid Crystal Display
LG Lee-Goldburg
LNLS Brazilian Synchrotron Laboratories
Mn Number Average Molecular Weight
Mw Average Molecular Weight
PAS Principal Axes System
PF Polyfluorene
PL Photoluminescence
PLED Polymer Light-Emitting Diodes
PMLG Phase-Modulated Lee-Goldburg
PPV Poly(phenylenevinylene)
rf Radio Frequency
NMR Nuclear Magnetic Resonance
Tg Glass Transition
TOF Time of Flight
TPPM Two Pulse Phase Modulation
1
Introduction
... 35
1.1
Historical Perspective ... 35
1.2
Polymer Materials: Toward Conjugated Systems ... 39
1.3
Importance of Charge Transport and Its Correlation with
Structure and Dynamics ... 43
1.4
Outline of the Thesis ... 47
2
Materials and Techniques
... 51
2.1
Material: Poly(9,9-di-n-octylfluorene-alt-benzothiadiazole)
(F8BT) ... 51
2.2
Thermal Methods ... 53
2.3
Nuclear Magnetic Resonance Technique (NMR) ... 56
2.3.1 Chemical Shift ... 61
2.3.2 Dipolar Interaction ... 62
2.3.3 Static Hydrogen Spectra (
1H) ... 66
2.3.4 Excitation and Detection of Organic Compounds ... 70
2.3.5
1H Dipolar Decoupling ... 71
2.3.6 Magic Angle Spinning (MAS) ... 70
2.3.7 Cross Polarization (CP) ... 80
2.3.8 Cross Polarization Magic Angle Spinning Experiment
2.5.2 Impedance Spectroscopy (AC) ... 100
2.5.3 Time of Flight Technique (TOF) ... 104
2.5.4 Current Extraction by Linear Increasing Voltage ... 108
2.6 Fim and Device Preparation ... 111
3
Molecular Relaxation, Dynamics and X-Ray
Results
... 113
3.1
Structural Results: Differential Scanning Calorimetry and
Wide Angle X-Ray Diffraction ... 115
3.2. Molecular Dynamic Results: Dinamical Mechanical
Thermal Analysis and Nuclear Magnetic Resonance ... 120
4
Electrical Results
... 133
Properties
... ...163
6.
Conclusion and Perspectives
... 169
1 Introduction
In the introduction, it will be presented a brief historic perspective on the polymer science as a field of research. The conjugated polymer material shall be introduced and the importance of understanding charge transport features in this material is addressed. Finally, the first chapter ends by outlining the scope of this thesis.
1.1
Historical Perspective
Organic materials, such as polymers, have been mainly used as insulator materials due to its low conductivity properties. Also, because of its mechanical properties, such as malleability and low cost processing, polymers have stimulated many applications in a day-to-day life of our society. For instance, protection of high voltage wires and houseware objects, as illustrated in figure 1.
However, this scenario started to broaden in the early 1960s, when organic crystals, such as anthracene, were exploited because of their semiconducting properties1. This period contributed heavily for the theoretical understanding of
electronic properties of such organic molecules. Nevertheless, no significant breakthroughs concerning advances for industrial application have been reached2.
The interest of xerography companies in organic semiconductors, started in the 1980s, gave prominence to this field, and most photocopiers and laser printing machines still exploit their photoconductivity properties. Nonetheless, it was just in the very beginning of the 1990s that the polymer has appeared as a protagonist of organic electronics. Jeremy Burroughes and co-workers published the discovery of Polymer Light-Emitting Diodes (PLED) using conjugated polymers as activity layer3. This impressive contribution has opened a great perspective both for
industrial application, such as optoelectronic devices, and for academic purposes 3-11.
Many spin-off companies have come to the market and some prototypes of monochromatic signs displays, and similar prototype devices made by conjugated polymers technology were promptly launched on the market. Subsequently, both Organic Photovoltaic Cells (OPV) and Organic Field-Effect Transistors (OFET) joined the range of polymer electronics, giving the field extra possibilities of studies and applications11-13. However, problems related to the instability and low
efficiency of such class of material, compared to inorganic ones, have partially delayed the large-scale industrial production14-19. Some of these problems are
related to molecular structure, dynamics and morphology20-25, which make such
Figure 2 – The projected global organic electronic market from 2008 until 2017: It is expected to reach the total of 19 billion dollars of business on 201726.
Despite the problems with instability and efficiency, the current global organic electronic market is increasing significantly, and it is expected to reach approximately 19 billion Dollars in 201726 (see figure 2). In late 2007, Sony
presented its first prototype of an 11-inch all organic active display27. The flexible
version was also presented as a prototype in 201028. Last february (2011), the
same company introduced two model of professional OLED television at the market, the very first all-organic television to go on sale29 (see figure 3). These
Figure 3 - Images from the first full Sony OLED television to go on sale. Inset: OLED television resolution versus conventional LED television.
The OLED technology is, then, a reality; however, much needs to be done, especially for better understanding the properties of such class of materials. Therefore, it is important to elucidate molecular features of conjugated polymer materials and correlate them with optoelectronic properties. It is well established that, differently from most inorganic semiconductors and metals, polymer films normally have a random or partially oriented structures, being characterized by loops, coils and kinks leading to entanglement of the polymer chain and the formation of ordered regions30. Their highly disordered morphology is the
system requires an adequate overlap of the π orbital between adjacent molecules:
thus, it is expected that, the more planar the structure, the better the conduction20,30. At this point, one might be able to evaluate the importance of
studying and understanding correlations between molecular structure, morphology and dynamics with optoelectronic properties of polymeric materials.
In this sense, this thesis intends to contribute to the development of this technology, even a little. For the better understanding of the concepts used throughout this thesis, a brief overview of polymer material will be presented in the following sub-chapter.
1.2
Polymer Materials: Toward Conjugated Systems
As mentioned before, polymer materials have been mainly used for insulating applications. The insulate properties arise from the fact that each carbon in the backbone is generally bonded with other four distinct atoms31. Therefore, the
polymer’s main-chain is composed by σ-bond31. A classical example is the
polyethylene (- CH2 -), where each carbon is surrounded by two carbons and two
hydrogens and, thus, only single bond are involved. In this type of system, the transition between σ and σ* orbital requires energies of more than 6 eV31. These
Conjugated polymers are characterized by a molecular structure that features alternating single and double bonds32. The conducting/semiconducting properties
of such class of material derive from the dimerized structure due to the Pierls instability with two carbon atoms in the repeat unit33-35, as illustrated in figure
4a. Chemically, carbon-carbon double bonds are formed by the “hybridization” between two 2p orbitals and the 2s orbital, called hybrid sp2 orbital31, as one may
see in figure 4b. These orbital lies on a plane, directed at 120o to one another,
forming three σ molecular orbitals from the three “valence electrons”. The very last “valence electron”, which is located in the perpendicular pz orbital, overlaps
with the adjacent pz electron in order to form the other hybrid orbital, known as
π orbital. This orbital is spread out (delocalized) over the polymer chain.
Figure 4 - a) Illustration of the main-chain dimerization due to the Peierls Instability: The band gap in polymeric systems appears since the length of single and double bound are different; therefore, the repeat unit has two atoms and the ππππ orbital is divided in two; b) Illustration of the sp2 hybridization: ππππ orbital of two
consecutives carbons overlaps, giving rise to a delocalized orbital, providing a “highway” for charge mobility along the polymer chain.
The lower energy π orbital is the valence band, while the high-energy π*
and π* bands (bounding and anti-bounding, respectively). Since each band
supports two electrons, the π one is completely filled, while the π* is empty. There
will be an energy gap between the mentioned bands, which is the reason of the semiconducting properties of CP materials. Many conjugated polymers present a band gap in the range of 1 to 4 eV, which is located exactly on the visible range of electromagnetic radiation, see figure 5. This is also the reason why such class of polymer has been applied successfully to optoelectronic devices32.
Figure 5 – Electromagnetic Spectrum: The energy between 1 and 4 eV covers all the visible range. Most of the conjugated polymer emits light in this range of frequency, being then applied with success in optoelectronics devices.
The conducting/semiconducting properties of polymeric materials were accidentally discovered in the 1970s by Shirakawa and co-workers36. At that time,
they were working on new ways of synthesizing polyacetylene (CHn) by
MacDiarmid, Heeger and a talented group of graduate and post-doctoral researchers, Shirakawa submitted a paper reporting that, by doping the trans-polyacetylene with iodine, one may find that the measured conductivity of such system could be a thousand times better than the undoped film36. Consequently,
in 2000, the authors were laureate by the Chemistry Nobel Prize37.
Figure 6 – Molecular structure of different polyacetylene isomers: a) the cis-polyacetylene and b) the trans-polyacetylene.
An important feature of Conjugated Polymers is their easy processing. Nowadays conjugated polymers are usually synthesized with attached alkyls side-chains, which make them soluble in convenient organic solvents, such as xylene, chloroform and toluene8,11,13. Therefore, film deposition can be easily obtained by
hopping and thus, to electrical conduction, although it is beneficial for optical properties, since intermolecular overlap promotes excimer formation38.
1.3
Importance of Charge Transport and Its
Correlation with Structure and Dynamics
The bulk state of polymer normally includes both amorphous and crystalline portions. While the amorphous polymer do not contain any crystalline region, the so-called “crystalline” polymer (generally treated as semi-crystalline), contain an appreciable amount of amorphous material30. When the semi-crystalline polymer
melts, it normally becomes amorphous. The amorphous polymers, however, do not present melting processes, since they have no crystalline portion to quench.
The microscopic picture of an amorphous and semi-crystalline polymer is shown at figure 7. The bulk structure of an amorphous material can be linked to a pot of spaghetti, where the spaghetti strands weave randomly in and out among each other. Even being amorphous, such structure might present some order. An examination of the relative positions of adjacent strands on the spaghetti-picture will reveal that there exist short regions where the strands appear to lie more or less parallel20.
Concerning the semi-crystalline polymer, their bulks are never totally crystalline due to the long-chain nature of polymeric materials and their subsequent entanglements. The crystallization dynamics phenomena are rather complex30. It might depend of several aspects, but one is important to mention.
due to the random fashion do not (with few exceptions). An example is the high regular and semi-crystalline polyamides (nylons®).
Figure 7 - Model for transport in low and high-MW films. a) Charge carriers are trapped on nanorods (highlighted in grey) in the low MW case. b) Long chains in high-MW films bridge the ordered regions and soften the boundaries. Figure adapted from reference 20.
conjugated polymers depend sensitively on the physical conformation of the polymer chains. Generally, it is expected that the polymer chain packs neatly, in such a way that the π orbitals between adjacent molecules overlap efficiently. In
this situation, the conduction orbital is, indeed, delocalized throughout the polymer chains and the charge carriers that are excited to this level can be readily driven out by an external electric field39. As a result, the charge carrier mobility
increase and a better output performance can be derived.
However, this is not the situation one faces experimentally. Kline and co-worker20, have published an interesting paper comparing the charge transport of
Figure 8 – X-ray analysis of a) out of plane and b) in plane diffraction of P3HT samples with different molecular weight. Note that low molecular weight films seem to produce high ordered structure. Figure adapted from reference 20.
It is not from now that annealing technique has been frequently used to achieve desired morphology and electrical properties of polymer films. Each researcher or research groups have their own assembly receipt to obtain the desired film morphology. Annealing processes involve thermal treatment designed to produce a specific transition, such as glass transition or crystal-to-crystal phase transition, (commonly addressed as crystalline transition), which promotes structural transitions and/or morphological reorientation.
Actually, it is not only the electrical properties that are influenced by film morphology or molecular relaxation. It has been shown that the photoluminescence and absorption properties were also morphological dependent38. Indeed, the long conjugated length can be treated as a number of
diffusing throughout the conjugated chain, and, therefore, partially dissipate their energy non-radiactively. Thus, one might expect differences in the photoluminescence profile depending on the morphology and conformation.
By this introduction one may scale the importance of studying the morphology and structure of polymer films and their influence on the desired features, e.g., opto-electronic properties. In the following pages, it will be presented a more detailed discussion of this influence and correlation.
1.4
Outline of the Thesis
The historical introduction and a rapid discussion about polymeric materials, as well as the importance of understanding the correlation between molecular and optoelectronic properties, were addressed in this first chapter.
Chapter 2 deals with the description of the material and technique used throughout this research. A brief theoretical introduction is given for each technique and the most important details and discussion of the technique in question is made for the better understanding of the results of this thesis.
Chapter 3 is devoted to the presentation and initial discussion of the measurements of the molecular relaxation, dynamics and structure while chapter 4 is related to the electrical characterization of thick and thin film devices. A brief correlation between chapter 3 and 4 is established.
Chapter 5 is reserved to the main discussion of this thesis. Results presented in chapter 3 and 4 are compared and the correlation between the molecular and electronic properties of the analyzed material are outlined and discussed.
2
Materials and Techniques
In this chapter, it will be briefly discussed the basic aspects of polyfluorene materials, the main experimental techniques and the theoretical introduction of concepts used throughout this thesis.
2.1
Material:
Poly(9,9-di-n-octylfluorene-alt-benzothiadiazole) (F8BT)
As mentioned before, the first evidence of high electric conductivities in synthetic polymers was obtained with polyacetylene, which, unfortunately, is difficult to process and unstable in the presence of oxygen. However, due to the high potential for innovation of such class of materials, more stable and easy-processing polymers were rapidly investigated and developed by the chemists and researchers. This progress has led to the aromatic-based polymers, which were found to be much more stable, efficient and easier to process.
It was not surprising that the first class of light-emitting polymers was the family of polyparaphenylene vinylene (PPV)40-43. PPVs are fully aromatic
examples are illustrated in figure 9. Numerous impressive contributions have been published using these materials, especially those by the group of Sir Richard Friend from Cambridge University, England3-11,13,32. Indeed, as mentioned, the
pioneer works on polymer light-emitting diodes were developed by them9. In order
to estimate the impact of this pioneer work on the literature, up to now this article has been cited more than 6000 times44.
Figure 9 - Molecular structure of Polyparaphenylene vinylene (PPV) (top) and its derivatives: poly(2-methoxy-5-(n-hexadecyloxy)-p-phenylene vinylene) (MH-PPV) and poly[2-methoxy-5-(2 -ethyl-hexyloxy)-1,4-phenylene vinylene] (MEH-PPV) (botton).
However, despite being more stable and easier to process, PPVs have limited band gap, low efficiency and require high operating voltages for industrial applications. In this context, Fukuda and co-workers45 published the development
of the first polyfluorene: poly(9,9-dialkyl-fluorene)s, illustrated in figure 10a. The polyfluorene family have received considerable attention45-58 due to its rigid
the aliphatic species – see arrow at figure 10a), which provides the possibility to improve the solubility and assembly, without significantly increasing the steric interactions in the polymer backbone. Moreover, polyfluorenes can be synthesized together with different co-polymers, resulting in derivatives that emit lights spanning in the entire visible range with appreciable efficiency and operating voltage45,48-51. Examples of polyfluorene derivatives are shown in figure 10. The
color of the illustration refers to the molecule’s emission wavelength.
Figure 10 - Examples of several Polyfluorene chemical structure: a) Poly(9,9-dialkyl-fluorene), b) Poly[(9,9-dioctilfluorenil-2,7-diil)-co-{1,4 vinilenofenileno)], c) Poly(9,9-di-n-octylfluorene-alt-benzothiadiazole) and d) Poly[9,9-di-(2-etil-hexil)-fluorenil-2,7-diil-2,5-diphenil-1,2,4-oxadiazole].
benzothiaiazole molecule (see molecular structure in figure 10c). It has been extensively used as activity layer in reports involving highly efficient light-emitting diodes59, photovoltaic cells60 and, recently, the light-emitting
transistors61.
In all cases, F8BT has demonstrated high hole and electron mobility and highly efficient performance. However, the mechanisms that control the conduction of charge carriers (intra and/or interchain charge transport) are not yet well understood. These mechanisms are clearly influenced by the polymer packing structure, since many structural defects or parameters can affect the optoelectronic and charge transport properties of conjugated polymers: for instance, the interchain π-spacing, can affect the rate of charge and exciton
transfer between molecules, and the torsion angle between neighboring units, might affect the planarity and effective conjugation length of the backbone.
Indeed, both the polymer structure and main-chain torsion angles are closely connected with the polymer relaxation processes38. The most studied relaxation
phenomenon is the glass-transition. The basis for such phenomenon is the onset of collective molecular motion in the polymer main-chain. At low temperatures, only vibrational motions are possible, and the polymer is hard and glassy. At the glass transition temperature, (Tg), portions of the polymer soften and its viscoelastic
behavior changes. The onset of the molecular motion specifically that in the backbone, may induce changes in the structural packing and torsion angles of the molecule and, thus, directly influence the charge transport properties.
2.2
Thermal Methods
It is well known that polymeric materials undergo molecular relaxation that may interfere with their physical and chemical properties. Polymer relaxation is classified according to the temperature it normally occurs: the lower temperature processes are called γ-relaxation, and are usually associated to mobile groups, such
as, methyl (CH3) ending-chain groups; the so-called β-relaxation occurs at
intermediate temperature and is related to the quasi-mobile groups (aliphatic segments); and, finally, there is α-relaxation, which occurs at higher temperatures
and refers to the rigid groups, such as the main-chain30.
For semi-crystalline polymers, the α-relaxation is usually related to the
reorientation of the crystalline portion, while the higher temperature process is the crystalline-amorphous transition (melting).
Throughout the work analyzed here, we have used mainly two techniques to measure the F8BT’s molecular relaxations, namely: Differential Scanning Calorimetry (DSC)30,62 and Dynamical-Mechanics Thermal Analysis
(DMTA)30,38,62.
melting is expected to be endothermic. Figure 11 illustrates a typical curve for polymer material.
Figure 11 – Example of Differential Scanning Calorimetry (DSC) experimental results on Polyethylene polymer film: Glass Transition (Tg) in red, crystallization in blue
and the melting of the ordered structure in green.
The DMTA measurement is, as well as the DSC, a powerful technique to measure and detect molecular relaxation. Indeed, the DMTA can be even more precise than the DSC63. It also has a practical advantage: as it involves
time-dependent excitation (with different frequencies), which offers the possibility of frequency selectivity.
The DMTA technique determines the Young Modulus of the material by applying a mechanical-tension excitation63. The real part of the Young Modulus is
denoted as Storage Modulus (E’), while the imaginary part is known as Loss
stored elastically during a deformation, and the loss modulus is a measurement of the energy converted to heat or absorbed by the analyzed system.
Another quantity which is widely used is the Loss Tangent:
= (10)
where δ is the angle between the in-phase and out-of-phase components in the
cyclic motion.
The determination of the Young Modulus by the DMTA technique is made by the measurement of the δ phase. A frequency-controlled dynamic stress is applied
to the testing sample and the correspondent material’s deformation phase and amplitude response is measured. When the material undergoes a relaxation process its viscoelasticity properties change. Consequently, there will be a change in the δ phase. For instance, the maxima of tanδ versus temperature curve, and
also of E’’, are generally used as the definition of the glass transition (Tg). DMTA is a thermal analysis technique, which means that the measurement occurs under controlled temperature scanning.
As an example the dynamic mechanical response of polyethylene is illustrated in figure 12. The higher temperature tanδ peak is attributed to the glass
transition, while the intermediate-temperature peak to the, so-called, β-relaxation
(onset of motions of the side-chain in branched polymers). The lower-temperature peak, assigned as γ-relaxation was regarded as the relaxation of ending-chain
Figure 12 - Temperature dependent of the loss tangent measured by Dynamical-Mechanics Thermal Analysis (DMTA) on Polyethylene polymer film: γγγγ, ββββ and αααα are the relaxation of different segments on the molecule. Figure adapted from reference 62.
The thermal analysis techniques presented above are essential for location the temperature of the relaxation; nonetheless, they are limited to provide a clear microscopic view of the behavior of molecules and atoms during such a transition. To compensate for this, we have used Nuclear Magnetic Resonance (NMR) techniques, as discussed below.
2.3
Nuclear Magnetic Resonance Technique (NMR)
The phenomenon of nuclear magnetic resonance is generally observed in nuclei having now-vanishing total angular momentum, = ℏ , where ℏ = , being ℎ the Plank constant and the nuclear spin64. Such phenomenon arises due to the
presence of a static magnetic field (""""!). In the case of protons (spin moment: I = 1/2), the Hamiltonian of the interaction between the spin magnetic moment and
!
"""" = !#$ is:
% = − &. """" = ℏ(−( ! !) ) = −ℏ*! ) (2)
where & = (ℏ is the nuclear magnetic moment, ( is the giromagnetic ratio and
*! is the Larmor frequency. The allowed values of the z-component of ) are:
) = +, + = , − 1, … − (3)
where + is the spin magnetic quantum number. For a nucleus of spin ) =½, the possible energies are calculated according to the following expression:
= ±ℏ2 ( ! (4)
Hence, if an electromagnetic radiation of frequency 1 = 23 = ℏ( ! is applied
to a sample containing a collection of nuclei with ) =½, this radiation can be absorbed by the sample, which results in transitions between the energy levels given by equation 4. This is the basic phenomenon of Nuclear Magnetic Resonance (NMR).
Though the naive discussion above applies to a single spin, it is easily to generalize to the macroscopic magnetization, which is defined as the total magnetic moment:
4"" = 5 6 6
When a macroscopic sample is placed in an external magnetic field, the nuclear magnetic moment of individual ½-spins can align in one of the two possible energies given by equation 4. Therefore, the total macroscopic magnetization will be given by the ratio of the populations of the two “orientations”. At room temperature, the population of spins in the lower energy level, N+, slightly outnumbers the population in the upper level (N-). This ratio is given by the Boltzmann distribution, and for room temperature is approximately 10-6. Indeed, the NMR signal is due to only this small fraction of net population.
At equilibrium, the net magnetization vector lies along the direction of the applied magnetic field and is called the equilibrium magnetization (Mo). In this configuration, the Z component of magnetization, MZ, is equals Mo, and there is
no transverse (MX or MY) magnetization. It is possible to disturb this equilibrium
situation by applying an oscillating magnetic field (known as "8), which is
perpendicular to "!. By using frequencies similar to the Larmor frequency (in
radio-frequency range - MHz), it is possible to induce energies transitions between the energy levels, changing the total equilibrium magnetization. The spins respond to this pulse in such a way that the magnetization vector rotates about the direction of the applied "8 field. The rotation angle depends on the length of
time the field is on, τ, and its magnitude "8.
A 90o (or ) pulse is the one which rotates the magnetization vector clockwise
by 90o about the X or Y plane (the phase of the RF pulse, defines the rotation
direction). A 180o (or 9) pulse will rotate down the magnetization vector by 180
degrees along the -Z axis. When "8 is turned off, the disturbed magnetization
executes a precession movement about ":, which can be detected as an induced
Nevertheless, the effect of magnetic resonance is not as straightforward as described above. In real systems and molecules the nuclear resonance frequency may vary due to the spin interactions. The most important spin interactions for organic compounds are the so-called chemical-shift and the magnetic dipolar coupling. These interactions will be briefly discussed for solid systems in the next two sections.
2.3.1
Chemical Shift
The Chemical-Shift arises from the coupling of the nuclear spin and the electron’s orbital movements64,65. These movements generate local magnetic fields
in the nucleus, changing its local magnetic field. Since the magnetic resonance frequency is dependent on the resulting magnetic field over the nuclei, the NMR signals are expected to resonate with frequencies shifted from the natural nuclei Larmor frequency (γ !). Thus, the nuclear resonance frequency depends on the
chemical environment - and similar atoms placed in distinct electronic environments - and may lead to a different resonance frequency65.
Figure 13 – 1H Nuclear Magnetic Resonance (NMR) signal of Ethanol. The chemical-shifts
differentiate the distinct hydrogen in the molecule: The two protons of the CH2
group neighboring the oxygen are further to the left in the spectrum, whilst the hydrogens of the CH3 group that is most remote from the oxygen produce a
signal towards the right of the spectrum. The hydrogene attached to oxygen is ‘deshielded’ due to the electronegative nature of oxygen and this shifts its signal towards the left in the spectrum
In general, the chemical shift Hamiltonian is given by:
%;< = ∙ >?@ ∙ """" A = (ℏ> ∙ ?@ ∙ ! """" A! (6)
where ?@ is a second order tensor, representing the proportionality factor between
"! and the local magnetic fields originated from the electrons’ spatial orbital
motion. Such movements are induced by the application of the static magnetic field (Faraday Law). Assuming that "! = !#$, the chemical shift Hamiltonian
%;< = (ℏ> C?C)+ E?E)+ )?))A ! (7)
The induced magnetic fields are small compared to !; consequently, the chemical shift parameters ?6G are of the order of 10-6, resulting in shifts of the
Zeeman energy levels of the order of parts per million (ppm). Therefore, the chemical shift might be treated as a first-order perturbation with respect to the Zeeman Interaction and, the effective Hamiltonian can be simplified and expressed as follows65:
%;< = (ℏ()?))) ! (8)
Taking into account both Zeeman and chemical shift interactions, the full Hamiltonian results in
% = %)+ %;< = −ℏ(( !)(1 − ?))) )) (9)
Nonetheless, it is convenient to express the Hamiltonian in terms of coordinate system in which the chemical shift tensor ?@ turns diagonal. This axis frame is known as the principal axis system (PAS), or xPAS, yPAS, zPAS and, to correlate
PAS to the laboratory axis frame (LF), where the resonance frequencies are measured, it is normally used an Euler rotation, according to which:
?@JK = LM(N, O, 0)?@PQRLMS8(N, O, 0) (10)
where, the matrix rotation LM and ?@PQR are given by:
LT(N, O, 0) = Ucos ϕ cos O sin N cos O − sin O− sin N cos N 0
cos N sin O sin N sin O cos O [ ?\
PQR = ]?CC
PQR 0 0
0 ?EEPQR 0
0 0 ?))PQR
By doing so, the NMR Hamiltonian can be expressed in terms of θ and φ:
%;< = (ℏ )_?``PQR(sin O cos N ) + ?aaPQR(sin O sin N) + ?bbPQRcos O c ! (12)
It can also be expressed in relation to the average value of the interaction, the isotropic term (?6<:PQR), the anisotropic factor (δ) and the asymmetry parameter (d)
listed below: 3 PAS zz PAS yy PAS xx PAS
iso = σ + σ + σ
σ , δ = σPASiso −σPASzz ,
δ σ − σ = η PAS xx PAS yy (13)
Using these values, the secular chemical shift Hamiltonian becomes:
%<e; = f3g?
6<:PQR !,!+ hig ,!ji klm
noS8
+8d sin O cos 2Np (14)
where C is a Constant equal to (ℏ, , !,!= −&qrs
fi and ,! = hi ) !.
2.3.2
Dipolar Interaction
Classically, the dipolar energy of two interacting magnetic moments 8 and is given by:
= 8t∙i −3( 8∙ t)( ∙ t)tu (15)
where t is the distance vector between 8 and . To express the dipolar Hamiltonian we take 8= (ℏ 8 and = (ℏ , and we assume that the
gyromagnetic factors and spins might be different. By generalizing for N spins, the dipolar Hamiltonian can be represented by64,66:
%v = 5 5 G ∙ w ∙x y
z{8 y
G{8
z (16)
where w| is defined by
w}~{ (8( ℏ •}⋅ •~− 3>•} ⋅ tGz/‚tt Gz‚A ∙ >•~⋅ tGz/‚tGz‚A
Gzi (17)
where •8, • , and •i are the basis vectors of the coordinate system in which the
tensor w| is represented.
Taking two spins, 8 and , and expressing 8C, C, 8E and E in terms of the raising and lowering operators 8ƒ, ƒ,
8S, and S, and switching the Cartesian
coordinates into spherical coordinates, we are able to rewrite the dipolar Hamiltonian in a convenient form:
where
(19)
and O is the angle between the distance vector t and "!.
The Zeeman Effect corresponds to interactions of a nuclear moment with magnetic fields of the order of 1-10 Tesla, while the dipolar interaction corresponds to interactions with a field of about 1 Gauss. Therefore, the dipolar interaction can also be treated as a first-order perturbation with respect to the Zeeman Interaction and the effective dipolar Hamiltonian can be shortened to the first two elements A and B64-66:
%v =(8( ℏti („ + ) (20)
If the dipolar interaction occurs among unlike spins (hetero-nuclear dipolar interaction), only the term A is necessary for the first-order perturbation calculations. Consequently the Hamiltonian is given by:
%ve…e†: = (8( ℏti (3 cos O − 1) 8) ) (21)
For similar spins (homo-nuclear dipolar interaction), both terms are included, and the Hamiltonian is expressed as follows:
(
)
(
)(
)
(
)
(
)
2 1 2 21 2 1 2
1 2 1 2
1 3cos 1 1 3cos 4 3 sin cos 2 z z i z z
A I I
B I I I I
C I I I I e
θ θ θ θ + − − + + + − = − = − + − = − +
(
1 2 1 2)
(
)
2 2 1 2 2 2 1 2 3 sin cos 2 3 sin 4 3 sin 4 i z z i i
D I I I I e
E I I e
%v:}: = (8( ℏti (3 cosiO − 1)‡3 8) )− 8∙ ˆ (22)
A common property of the Hamiltonians shown in equation 21 and 22 is that they are diagonal in the Iz basis and have the same angular dependence
(3 cosiO − 1). Furthermore, both the dipolar and the chemical shift interaction
(equation 14) have, as well, the same angular dependence. Therefore, the nuclear spin interaction Hamiltonian can be generalized and re-written in a general way:
%<e; = f3g?
6<:PQR !,!+ ‰32 g ,!Š3 cos O − 12 +12 d sin O cos 2N‹ (23)
Where, !,! = −&qrs
fi and ,! will depend on the type of the spin interaction, as
organized in table 1.
Table 1 – Irreducible tensor components of the nuclear spin interaction.
Interaction Chemical Shift Dipolar
,! ‰23 ) ! ‰16 >38) ) − 8∙ A
Hence, the transition energies and, consequently, the anisotropic part of the NMR frequencies, can be written in a general form, for all spin interactions, as:
*(O, N) = *6<:+ *Œ~6<:(O, N) = *6<:+ •3 cos
iO − 1
The anisotropy of the internal interaction in the solid state makes NMR a unique tool for probing molecular orientation, local structure, relative conformation between sites, and molecular motion. Many of the Solid-State NMR techniques used to study these properties are based on the anisotropy of the internal interactions.
These methods allow detailed studies of dynamics occurring over a wide range of frequencies. The fast and intermediate dynamics (within the kHz frequency scale) can be characterized, to some extent, by line-shape analysis or methods that involve the correlation between dipolar and chemical shift interaction. Slow dynamics (1Hz – 1kHz) can be studied by the so-called Exchange NMR experiments, where relatively slow conformation transitions or segmental reorientations are observed due to changes in the orientation-dependent NMR frequencies.
In the following sections, some of these methods and their capability to probe molecular dynamics will be addressed.
2.3.3
Static Hydrogen Spectra (
1H)
The 1H NMR measurements are particularly interesting, since, by a simple
line-shape analysis as a function of temperature, it is possible to investigate the molecular dynamics and, therefore, the molecular relaxation processes. The analysis of the behavior of the NMR line shapes is one of the most traditional procedures for probing molecular dynamics using solid-state NMR64.
In the case of 1H NMR measurements, the dominating interaction is the
homo-nuclear dipolar interaction (1H-1H), shown in equation 22. In amorphous or
are randomly oriented. Thus, the dependence of the anisotropic interaction on the molecular orientation produces a strong broadening. Besides, multi-spin effects result in a Gaussian line shape65, in which the width is proportional to < >, i.e.,
the mean of the multi-spin reorientation.
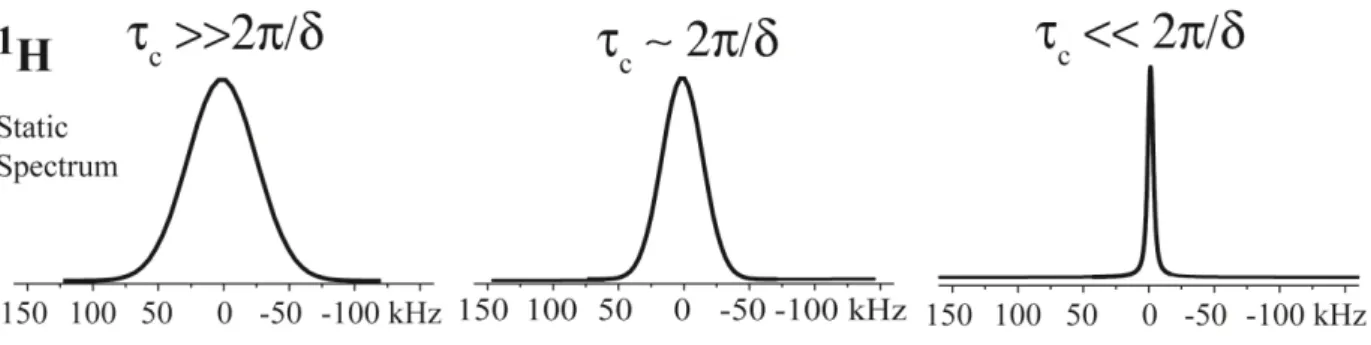
The molecular motion is normally described by its correlation time (τc). One
might observe three situations concerning the dynamic regimes: the slow regime, characterized by k ≫ “’, the intermediate regime ( k≈ “’) and the fast regime
( k ≪ “’). The molecular dynamic motion affects the anisotropic term of equation 24 through the orientation of the molecule with respect to the external magnetic field. The 1H line width, seen in figure 14, changes mainly when the motion is in
the fast regime. The width spectra depend on the geometry of the molecular motion, i.e., number of jump sites, reorientation angles, etc.
Figure 14 - Series of powder line shapes simulated for different cases: left) rigid regime, centre) intermediated regime and right) fast regime: isotropic movement. It is possible to observe that the natural motion of the molecule average the 1H-1H
coupling, producing a narrowing of the line shape.
As the motion becomes faster, the line width narrows due to the averaging of the 1H-1H coupling, which is known as motional narrowing64-67. Therefore, by
onset of molecular dynamics on the sample, simply by observing its motional narrowing.
The experiment itself is rather simple. An excitation pulse is applied in resonance with the 1H, and the subsequent response is measured. The spectra are
obtained for several temperatures, and the width of the line shape at half height is analyzed.
2.3.4
Excitation and Detection of Organic
Compounds
The atoms and molecules in liquid samples usually execute fast and random reorientation, which average out the anisotropic component of the spin interactions, and the remaining contribution is only due to the spin interactions presenting isotropic components, i.e., isotropic chemical shift and scalar couplings65. Thus, solution NMR yields very narrow lines, which are normally
used to analyze the chemical composition and structure of the sample.
Solid-state samples belong to a distinct physical chemistry reality. In such systems, the molecules normally have restrictions on their movements leading to a non-average (or partially average) anisotropic component of the spin interactions. Since the anisotropic components are orientation-dependent, in non-oriented samples, (i.e., amorphous or semi-crystalline), there will be a substantial distribution of the resonance frequencies, which results in a broad spectrum, making it very difficult to distinguish different carbons in the molecule based on their isotropic chemical shift difference.
In organic compounds another challenge needs to be overcome. The natural abundance of 13C is just 1%, and its gyromagnetic constant is low (γ
MHz/T). This usually leads to a low NMR signal and long relaxation times. Thus, to increase the resolution and sensibility of the 13C NMR spectra it is
necessary to use a combination of special NMR techniques, namely: 1H Dipolar
Decoupling, Magic Angles Spinning (MAS) and Cross-Polarization (CP). In the next sections, we will briefly describe the main feature of these methodologies.
2.3.5
1H Dipolar Decoupling
In general decoupling techniques are used to suppress the dipolar interaction between two nuclear spins. Here we shall discuss the heteronuclear Carbon-Hydrogen decoupling, which is used to eliminate the 13C-1H dipolar coupling
during the 13C acquisition, avoiding a strong spectra broadening due to the
anisotropic nature of this interaction.
The most commonly used 1H decoupling method consists of a continuous
irradiation in resonance with hydrogen, while the carbon signal is measured. Such irradiation will artificially rotate the hydrogen’s magnetization in such a way that the dipolar field in the carbon site is averaged out68,69. To efficiently suppress the
C-H dipolar coupling the intensity of the applied irradiation field (B1) must
satisfy the relation:
( 8> ∆*—6˜ (25)
where ∆*—6˜ is the spectral line broadening induced by the dipolar interaction.


![Figure 9 - Molecular structure of Polyparaphenylene vinylene (PPV) (top) and its derivatives: poly(2-methoxy-5-(n-hexadecyloxy)-p-phenylene vinylene) (MH-PPV) and poly[2-methoxy-5-(2 -ethyl-hexyloxy)-1,4-phenylene vinylene] (MEH-PPV) (bot](https://thumb-eu.123doks.com/thumbv2/123dok_br/18504208.370812/52.892.167.704.418.739/molecular-structure-polyparaphenylene-vinylene-derivatives-hexadecyloxy-phenylene-phenylene.webp)
![Figure 10 - Examples of several Polyfluorene chemical structure: a) Poly(9,9-dialkyl- Poly(9,9-dialkyl-fluorene), b) Poly[(9,9-dioctilfluorenil-2,7-diil)-co-{1,4 vinilenofenileno)], c) Poly(9,9-di-n-octylfluorene-alt-benzothiadiazole) and](https://thumb-eu.123doks.com/thumbv2/123dok_br/18504208.370812/53.892.128.816.482.842/examples-polyfluorene-chemical-structure-dioctilfluorenil-vinilenofenileno-octylfluorene-benzothiadiazole.webp)