A
rti
g
o
*e-mail: [email protected]
ANALYSIS OF A COMMERCIAL PORTABLE LITHIUM-ION BATTERY UNDER LOW CURRENT CHARGE-DISCHARGE CYCLES
Stephany Pires da Silva, Paulo Rogério Catarini da Silva, Alexandre Urbano e Jair Scarminio* Departamento de Física, Universidade Estadual de Londrina, 86057-970, Londrina – PR, Brasil
Recebido em 16/11/2015; aceito em 18/04/2016; publicado na web em 17/06/2016
The dependence between the transferred charge and the corresponding transference time to charge and discharge a portable cell phone Li-ion battery (LiCoO2/C) under cycles of low intensity currents was studied in detail. The voltage curve profile between 3.0 and 4.2
V and the charging and discharging time are strongly influenced by the applied current intensity. A linear dependence between the stored and extracted charges, into and from the battery, with the intensity of applied current was also observed. Allometric equations were found to describe the correlation between the charge transference time and the applied current intensity to charge and discharge the battery.
Keywords: lithium-ion battery; charging and discharging; CC protocol, low currents.
INTRODUCTION
Batteries of Li-ions (BILs) operate over reversible electrochemical oxidation and reduction reactions between a LixMO2 cathode (M: Co, Ni, Mn and its compounds) and a carbon
(graphite) based anode, with Li salts dissolved in organic compound solution as the electrolyte. Under conditions of electrolyte chemical stability and redox reaction reversibility, the batteries of LixCoO2
cathodes operate between the voltages of 3.7 to 4.2 V, with the Li concentration in the 0.5 < x < 1.0 range.1 The spontaneous reaction
(in discharge) occurs by the electrochemical insertion of Li+ cations
into the LixCoO2 compound (under Co reduction) in conjunction
with the oxidation of the C anode (with the output of Li+ ions from
the C material to the electrolyte), lowering the battery voltage. When x ≅ 1.0 the battery is fully discharged and external electric power should be provided to cathode oxidation and anode reduction reactions. When x = 0.5 the battery is fully charged and its voltage is 4.2 V.2 Due to the redox reaction simplicity, the BIL’s are very
stable devices when properly operated between its voltage and current limits. However, its charge capacity decreases progressively with the number of charge-discharge cycles.
Different protocols have been proposed to charge the BILs, including: application of a constant current followed by a constant voltage (CC+CV protocol),3 current pulses,4 continuously
decre-asing or multi-stage currents,5,6 constant current (CC),7 and other
strategies and algorithms that seek to maximize the storage charge and minimize the charging time.8 They have in common the feature
that at some stage in the charging process, a continuous, variable or pulsed current is applied, which may be preceded or followed by the application of a voltage.
Commercial battery chargers commonly use the CC+CV protocol, where a constant current (CC) is applied until the battery reaches 4.2 V, followed by a step where the voltage is maintained at this value (CV) until the current between the battery electrodes fall to a prede-termined low value.3 Studies show that the CC step in the CC+CV
charging protocol can charge up to 80% or even more of the battery charge capacity, for currents up to 0.5C.7 The storage charge and the
charging time will depend, in this step, on the battery states of charge (SOC) and health (SOH) and on the intensity of the applied electrical
current, since low charging current intensities imply long charging times and high charge storage, while under highly charging currents (higher than 0.5 C), the charge stored in the battery will be lower, but within shorter charging times.9
Apart from directly influencing the charge capacity and the battery charging time, the intensity of the charging current contributes to the kinetics of formation of the solid-electrolyte interface passivation layer (SEI) on the anode surface, during the first battery charging cycles.10 This can be responsible for Li electroplating the graphite
anode during the charging processes11,12 and for increasing the battery
potential during their charging and discharging, due to polarization effects. The SEI, the electrodeposited Li and polarization potential have influences on battery performance and determine, together with other parameters, its life cycle.
A BIL is discharged when operating as a power sources for electri-cal and electronic devices. The intensity of the discharging current will depend on the power required by the device. The discharging time is a function of the battery SOH, the stored charge in it, the battery SOC, and the current intensity required along the discharge. Discharges can occur under continuous current or even for high-frequency current pulses as in cell phones, in the GSM protocol.13
Although many studies about charge and discharge processes on BIL can be found, most of them are performed by applying charging and discharging currents from medium to high intensities (higher than 0.5 C). We present a detailed analysis of charge and discharge parameters of a commercial cell-phone lithium-ion battery, when submitted to continuous charge and discharge cycles under cons-tant charging and discharging currents of low intensities (0.04C to 0.52 C). The effects of the applied current intensity on the voltage profile, on the charging and discharging time, on the stored charge (charge capacity) and extracted charge (discharge capacity), and the functional dependence between the charging and discharging time with the applied current intensity were studied.
EXPERIMENTAL
The studies were performed on a commercial LiCoO2/C cell
the electrolyte. The three strips are wound as a jelly roll and inserted into the battery case.
Table 1 and 2 show the matrices designed for the battery charging and discharging tests, performed under the CC protocol, as well as the results obtained. The variables studied were: the intensity of the charging (ic) and discharging (id) currents, the corresponding charging
(tc) and discharging (td) times, the inserted (Qc) and extracted (Qd )
charges into and from the battery, respectively (charge and discharge capacities).
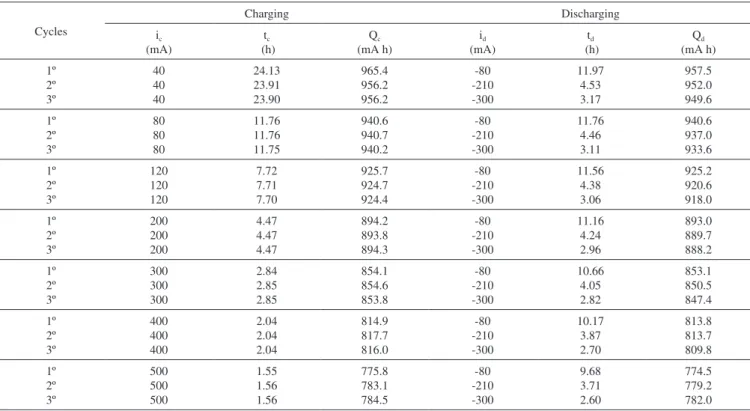
In the charging tests (Table 1) ic currents equal to 40, 80, 120,
200, 300, 400 and 500 mA (C rate between 0,04C and 0,52C) were applied to charge the battery from 3.0 to 4.2 V. At 4.2 V, the battery circuit was open (OCV) until equilibrium voltage was reached after 15 minutes, followed by discharges at constant currents, id, of -80 mA
(0.8C), -210 mA (0.22C) and -300 mA (0.31C), down to 3.0 V. The OCV assures the relaxation of battery overvoltage before each discharge.
For each one of the seven charging currents, the battery was discharged under the three discharging currents, resulting in twenty one charge-discharge cycles, as shown in Table 1. Discharged to 3.0 V, the battery was kept at this voltage until the current dropped to 5 mA. So, each new charging cycle was started with the battery on the same residual charge and at 3.0 V.
Table 2 shows the test matrix designed to perform the battery discharge studies in CC of different intensities and the obtained results. The variables were the intensity of the CC applied to dis-charge (id) the battery, the corresponding discharging time (td), the
extracted charge (Qd) (discharge capacity) and the CC and CC+CV
charging protocols, employed to charge the battery. Discharges were performed after charging at 120 and 500 mA (CC protocol) and under 500 mA + 4.2 V (CC+CV protocol). In the CV step of the CC+CV protocol the battery was kept at 4.2 V until the current decays to 1.0 mA. The CC discharges were performed at currents equal to -40, -80, -120, -200, -300, -400 and -500 mA, as shown in Table 2. The battery was cycled between 3.0 and 4.2 V. At 4.2 V, the battery circuit was
opened for 15 minutes and at 3.0 V the voltage was maintained until the battery current dropped to 5.0 mA, when a new charging cycle is then started. In total, twenty one charge-discharge cycles were continuously performed, wherein seven discharges were carried out for each one of three charging processes.
A capacity fading experiment was conducted to follow how the charge-discharge cycles performed during all the experiments of this work could change the battery SOH and, accordingly, have influence on the results to be shown, by continuously cycling an identical battery between 3.0 and 4.2 voltage limits, under the CC+CV (0.7C + 4.2 V) and CC (0.5 C) protocols, to charge and discharge the battery, respectively.
An Arbin BT2000 battery tester was used in the charge-discharge experiments, by connecting the auxiliary and work cables to the negative and positive battery poles, respectively.
RESULTS AND DISCUSSIONS
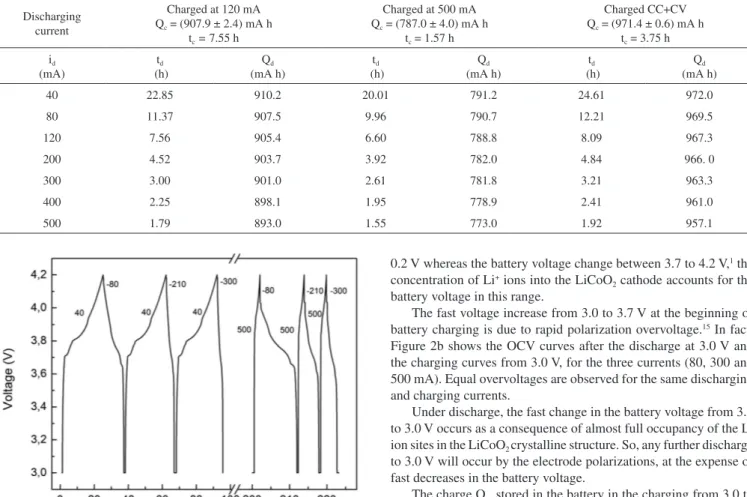
Figure 1 shows the first three and last three of twenty-one con-tinuous charge-discharge cycles, for the experiments described in Table 1. Similar curves were obtained for the experiments described in Table 2. Results extracted from these curves were displayed on Tables 1 and 2 and on Figures 2 to 5.
Figure 1 and Figure 2a show that the voltage curve profile between 3.0 and 4.2 V and the corresponding charging and discharging times are both dependent on the intensity of the applied current. Two distinct regions can be identified in these voltage curves, one for which the voltage rapidly changes in the 3.0 to 3.7 V range, followed by a second region in which the voltage change more smoothly between 3.7 and 4.2 V, with a profile very dependent on the applied current intensity.
The change in the battery voltage between 3.7 and 4.2 V is due mainly to Li+ insertion (the voltage decreases) and extraction (the
voltage increases) into and from the LiCoO2 cathode, as evidenced
by the cyclic voltammetries of the LiCoO2/Li cell presented in the
literature, wherein redox currents are set up only in this voltage
Table 1. Matrix of tests designed to charge the battery with seven CC, each one followed by three CC discharges, and the obtained results for tc, Qc, td and Qd
range, with an oxidation peak around 3.7 V.14 High currents imply
fast changes in the concentration of Li+ ions into the lamellar planes
in the LiCoO2 structure
2 and, as a consequence, fast changes in the
battery voltage in a short time. Under low currents the opposite oc-curs. Given that the carbon anode voltage does not change more than
0.2 V whereas the battery voltage change between 3.7 to 4.2 V,1 the
concentration of Li+ ions into the LiCoO
2 cathode accounts for the
battery voltage in this range.
The fast voltage increase from 3.0 to 3.7 V at the beginning of battery charging is due to rapid polarization overvoltage.15 In fact,
Figure 2b shows the OCV curves after the discharge at 3.0 V and the charging curves from 3.0 V, for the three currents (80, 300 and 500 mA). Equal overvoltages are observed for the same discharging and charging currents.
Under discharge, the fast change in the battery voltage from 3.7 to 3.0 V occurs as a consequence of almost full occupancy of the Li ion sites in the LiCoO2 crystalline structure. So, any further discharge
to 3.0 V will occur by the electrode polarizations, at the expense of fast decreases in the battery voltage.
The charge Qc, stored in the battery in the charging from 3.0 to
4.2 V by the seven currents ic, as described in Figure 1 and Table 1,
is shown in Figure 3. A linear decrease of the charge capacity with the intensity of the charging current was obtained, a behavior that is also observed from published data for charging currents lower than 1C, but that departs from linearity for higher currents.16,17
Figure 3 shows also the extracted charge Qd by the seven
dischar-ging currents id, after the battery was charged by the 120 and 500 mA
currents and by the 500 mA + 4.2 V CC+CV protocol, as described in Table 2. The extracted charge also decreases linearly with the intensity of the discharging current, for each of these three battery charging procedures. However, literature data indicates a non-linear Table 2. Matrix of tests designed to discharge the battery with seven discharging currents id, after three different charging processes, and the results obtained
for td and Qd
Discharging current
Charged at 120 mA Qc = (907.9 ± 2.4) mA h
tc = 7.55 h
Charged at 500 mA Qc = (787.0 ± 4.0) mA h
tc = 1.57 h
Charged CC+CV Qc = (971.4 ± 0.6) mA h
tc = 3.75 h
id
(mA)
td
(h)
Qd
(mA h)
td
(h)
Qd
(mA h)
td
(h)
Qd
(mA h)
40 22.85 910.2 20.01 791.2 24.61 972.0
80 11.37 907.5 9.96 790.7 12.21 969.5
120 7.56 905.4 6.60 788.8 8.09 967.3
200 4.52 903.7 3.92 782.0 4.84 966. 0
300 3.00 901.0 2.61 781.8 3.21 963.3
400 2.25 898.1 1.95 778.9 2.41 961.0
500 1.79 893.0 1.55 773.0 1.92 957.1
Figure 1. The first three and last three of twenty-one charge and discharge cycles applied to the battery, as described in Table 1. The numbers on the cur-ves are the applied currents (in mA) to charge (+) and discharge (-) the battery
discharge capacity decreasing for discharge currents higher than 1 C.5
The observed decrease in the charge and discharge capacities with the current intensity is caused by the polarization overvoltage, with the value being proportional to the current intensity.
Figure 3 (open circles) shows that when charged at 40 mA, the battery charging capacity is 180 mA h greater than when charged at 500 mA. However, after being charged by the 120 and 500 mA CC charging currents and by the CC+CV protocol, almost all stored charge is extracted from the battery, even at the higher discharging currents: the discharging capacity for the 40 mA discharging current is only16.0 ± 1 mA h higher than the discharging capacity under the 500 mA discharging current. This effect stems from the asymmetric kinetics of insertion and extraction of Li+ ions into and from the
LiCoO2 cathode. The thermodynamic response for this effect is the
asymmetry in the charging and discharging voltage curves under de same current intensity, as can be observed in Figure 2a.
The effect of the charging protocol on the battery charging ty can be observed from Table 2 and Figure 3: battery charge capaci-ties equal to 907.9 ± 2.3, 787.7 ± 4.0 and 971.4 ± 0.6 mA h, were ob-tained for charging at 120 mA, 500 mA and at 500 mA + 4.2 V (CV), respectively. The CV step increases the battery charge capacity in 7% and 23% on the charge stored by the 120 and 500 mA CC steps, respectively. These results show that the battery SOC depends on the intensity of the charging current applied in the CC step but also on the charging protocol. A detailed study about the effect of the CC and CV protocols on the charge capacity was presented for the MCMB/LiCoO 2 cell.3
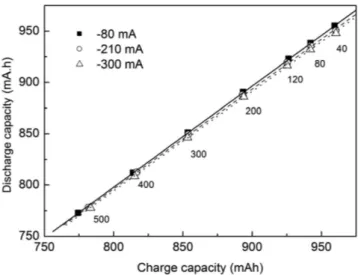
Figure 4 shows the charge extracted (Qd) in discharges
per-formed at -80, -210 and -300 mA as a function of the stored charge (Qc) in the battery for the seven charging currents, as described in
Table 1. A linear dependence between Qd and Qc is observed, with
the charge capacity increasing with decreasing charging current intensity. The battery discharge capacity diminishes when the discharging current increases from -80 mA to -300 mA and this effect is more pronounced the greater the battery charge capacity. The slope of the linear fittings show coulombic efficiencies equals to 0.987, 0.973 and 0.969 for discharges at -80, -210 and -300 mA, respectively.
The time to charge the battery from 3.0 to 4.2 V and to discharge it from 4.2 to 3.0 V is very dependent on the current intensity as shown in Figure 5, drawn from data of Table 1 for battery charging
and from data of Table 2, for the three battery dischargings. Both, the charging and discharging times, decreases asymptotically with the current intensity, as also observed in other studies performed on LiCoO2 cells.
3,17
Figure 5 shows that the discharge time, td, depends on the
dis-charge current intensity, id, but also on the battery state of charge
(SOC) before the discharges. At low discharging currents an ap-preciable difference between the td values with the battery SOC
is observed, that progressively decreases as the discharge current intensity increases. The battery state of health (SOH) must be also considered if it is not new in use.18
The experimental data of Figure 5 can be fitted by allometric equations, as shown in Table 3, where the equation on line a) refers to battery charging and the items b), c) and d) refer to battery discharg-ing, for the three chargings described in Table 2.
The fitted equations are similar to those proposed by Peukert (t . ik = C, where k and C are constants) to describe the dependence
between the current intensity to discharge a fully charged lead-acid battery and the discharging time.19 This equation has been improved
Figure 3. Charge capacity and discharge capacity as function of the current intensity. The battery was discharged after being charged at 120 mA, 500 mA and on 500 mA + 4.2 V
Figure 4. Charge capacity as function of the seven charging currents and the discharge capacity as function of three discharging currents (-80, -210 and -300 mA). The numbers beside the symbols indicate the charging currents and the lines are linear fittings for the discharge current data
Table 3. Fitted equations for the charging and discharging times, as a function of applied current. C5: battery charge capacity measured in a discharge of five hours.
Data from: Fitted equation Charge capacity C5 (mA h)
a) charging time x current, Table 1 data t.i1.043 = 1123.0
---b) discharging time x current, Table 2 data for battery charged on 500 mA t.i1.010 = 828.2 787
c) discharging time x current, Table 2 data for battery charged on 120 mA t.i1.007 = 938.3 904
d) discharging: time x current, Table 2 data for battery charged on 500 mA + 4.2 V t.i1.011 = 1025.2 967
for lithium-ion batteries considering thermal effects, high discharge currents and long discharge times.20
Table 3 shows that allometric equations can be employed to fit the data of not only battery discharging but also the data of the bat-tery charging. k values around 1.01 were obtained for the b), c) and d) discharges. The C values can be related to the battery discharge capacity since they increase in the sequence b) to c) to d).
From the allometric equations of Table 3, the discharging cur-rent (i5) applied to discharge the battery in five hours (t5 = 5 h) can
be calculated, and from this the corresponding charge C5 = i5.t5 is
obtained, as showed in Table 3. The C5 value is the charge extracted
from the battery in a discharge of 5 hours, after it was fully charged, as described in items b), c) and d) of Table 3. Technically, C5 is the
battery charge.
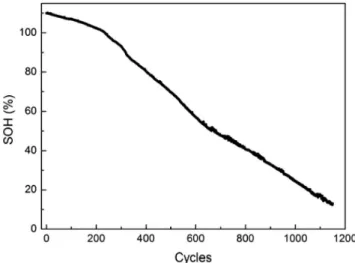
In battery cycling experiments, besides the battery SOC also the battery SOH, or equivalently the charge capacity, should be consid-ered since it decreases with the number of charge-discharge cycles, as showed in Figure 6 obtained from a battery of the same manufacturer and model as employed in this study. It can be seen that for a fresh battery, significant losses in the battery SOH for charge-discharge cycles below than one hundred are not observed. Considering that in the study presented here, no more than sixty charge-discharge cycles were performed on a fresh battery (SOH = 98%), the decrease in the battery SOH during all cycles was very small, having a secondary effect on the results presented.
CONCLUSION
We show that to charge and discharge a portable lithium-ion battery between 3.0 and 4.2 V under low charging and discharging currents (0.04 C to 0.52 C), the stored and extracted charge (char-ge and dischar(char-ge capacities), into and from the battery, decrease Figure 6. The battery SOH dependence upon continuous charge-discharge cycles. Note: the measured SOH in a pristine battery is higher than the nominal value furnished by the manufacturer
linearly with the intensity of the applied current. The time to charge or to discharge the battery between these voltages decreases with increasing applied current intensity, with a functional dependence fitted by an allometric function, as already obtained by Peukert for lead-acid batteries. Under discharge currents of low intensities battery coulometric efficiency higher than 97% was obtained. The results presented here may be useful to design batteries for portable electric devices, avoiding the fast deleterious effects of high current operations. It should be stressed that the cycling experiments were performed under the condition of very small change in the battery SOH value of the fresh battery (SOH = 98%).
ACKNOWLEDGMENTS
The authors wish to thank Sercomtel Celular SA for providing the battery samples employed in this study. S. P. da Silva and J. Scarminio are grateful to the Conselho Nacional de Pesquisa (CNPq - Brazil) for their scholarships.
REFERENCES
1. Zhang, S. S.; Xu, K.; Jow, T. R.; J. Power Sources2006, 160, 1403. 2. Reimers, J. N.; Dahn, J. R.; J. Electrochem. Soc. 1992,139, 2091. 3. Zhang, S. S.; Xu, K.; Jow, T. R.; J. Power Sources2006, 160,1349. 4. Li, J.; Murphy, E.; Winnick, J.; Kohl, P.; J. Power Sources2001, 102,
302.
5. Sikha, G.; Ramadass, P.; Haran, B. S.; White, R. E.; Popov, B. N.; J.
Power Sources2003, 122, 67.
6. Liu, Y.-H.; Teng, J.-H.; Lin, Y.-C.; IEEE Trans. Ind. Electron. Control
Instrum. 2005, 52, 1328.
7. Zhang, S. S.; J. Power Sources2006, 161, 1385.
8. Huang, S.-J.; Huang, B.-G.; Pai, F.-S.; IEEE Transactions on Power
Electronics 2013, 28, 1555.
9. Lian-xing, L.; Xin-cun, T.; Yi, Q.; Hong-tao, L.; J. Cent. South Univ.
Technol. (Engl. Ed.) 2011, 18, 319
10. Verma, P.; Maire, P.; Novák, P.; Electrochim. Acta2010, 55, 6332. 11. Li, Z.; Huang, J.; Liaw, B. Y.; Metzler, V.; Zhang, J.; J. Power Sources
2014, 254, 168.
12. Legrand, N.; Knosp, B.; Desprez, P.; Lapicque, F.; Raël, S.; J. Power
Sources2014, 245, 208.
13. Jossen, A.; J. Power Sources2006, 154, 530.
14. Scrosati, B.; Garche, J.; J. Power Sources2010, 195, 2419. 15. Bernardi, D. M.; Go, J.-Y.; J. Power Sources2011, 196, 412. 16. Ramadass, P.; Haran, B.; White, R.; Popov, B. N.; J. Power Sources
2002, 111, 210.
17. Guo, Z.; Liaw, B. Y.; Qiu, X.; Gao, L.; Zhang, C.; J. Power Sources
2015, 274, 957.
18. Floriano, R.; Santos, A. O.; Urbano, A.; Cardoso, L. P.; Scarminio, J.;
Int. J. Res. Rev. Appl. Sci. 2013, 17, 158.
19. Doerffel, D., Sharkh, S. A.; J. Power Sources2006, 155, 395. 20. Omar, N.; Van den Bossche, P.; Coosemans, T.; Van Mierlo, J.; Energies