www.soil-journal.net/1/273/2015/ doi:10.5194/soil-1-273-2015
© Author(s) 2015. CC Attribution 3.0 License.
SOIL
The use of soil electrical resistivity to monitor plant and
soil water relationships in vineyards
L. Brillante1, O. Mathieu1, B. Bois1,2, C. van Leeuwen3, and J. Lévêque1
1UMR CNRS 6282 Biogéosciences, Université de Bourgogne, 6 Boulevard Gabriel, 21000 Dijon, France 2Institut Universitaire de la Vigne et du Vin “Jules Guyot”, Rue Claude Laudrey, BP 27877,
21078 Dijon, France
3Bordeaux Sciences Agro, ISVV, Ecophysiology and Functional Genomics of Grapevines, UMR 1287,
Université de Bordeaux, 33140 Villenave d’Ornon, France
Correspondence to:L. Brillante (brillanteluca@live.it)
Received: 13 October 2014 – Published in SOIL Discuss.: 29 October 2014 Revised: 26 February 2015 – Accepted: 27 February 2015 – Published: 17 March 2015
Abstract. Soil water availability deeply affects plant physiology. In viticulture it is considered a major contrib-utor to the “terroir” effect. The assessment of soil water in field conditions is a difficult task, especially over large surfaces. New techniques are therefore required in order to better explore variations of soil water content in space and time with low disturbance and with great precision. Electrical resistivity tomography (ERT) meets these requirements for applications in plant sciences, agriculture and ecology. In this paper, possible techniques to develop models that allow the use of ERT to spatialise soil water available to plants are reviewed. An ap-plication of soil water monitoring using ERT in a grapevine plot in Burgundy (north-east France) during the vintage 2013 is presented. We observed the lateral heterogeneity of ERT-derived fraction of transpirable soil wa-ter (FTSW) variations, and differences in wawa-ter uptake depend on grapevine wawa-ter status (leaf wawa-ter potentials measured both at predawn and at solar noon and contemporary to ERT monitoring). Active zones in soils for water movements were identified. The use of ERT in ecophysiological studies, with parallel monitoring of plant water status, is still rare. These methods are promising because they have the potential to reveal a hidden part of a major function of plant development: the capacity to extract water from the soil.
1 Introduction
In viticulture and oenology it is acknowledged that the nat-ural environment has a major impact on the yield and vege-tative growth of grapevines and therefore on the sensory at-tributes of the final product. This link between the character-istics of a wine and its origin is called the “terroir” effect (van Leeuwen and Seguin, 2006). It has been studied on a scien-tific basis since the 1960s (Seguin, 1969). This relationship is not mediated through the effect of particular soil minerals or flavour compounds, although the popular wine press often er-roneously describes it thus (van Leeuwen and Seguin, 2006). The terroir effect must be sought in interactions at the ecosys-tem level. Major factors in the terroir effect are the supplies of water and nitrogen (van Leeuwen, 2010). Water and
Loveys et al., 2000; Stoll et al., 2000). It maintains reason-ably high yields because vines pick up water from the wet soil zones, while quality is high because roots produce Ab-scisic Acid (ABA) in the dry zones of the soil profile. In nat-ural conditions, such spatial soil water heterogeneity can also be found. The magnitude of such variations in soil moisture and their impact on vine physiology has rarely been stud-ied (one of the few being Bauerle et al., 2008). Soil moisture spatial variations might play a key role in the terroir effect. In a recent review, Schultz and Stoll (2010) remarked that soil water (SW) monitoring is a challenging task because root distribution is generally unknown and it is therefore difficult to understand how much water is effectively absorbed in each soil layer.
The reason why such spatial variations in soil water avail-ability have rarely been considered is that, at present, soil water measurements are generally obtained with in-soil de-vices such as time domain reflectometers (TDR), which can be difficult to use in field conditions. Furthermore, these de-vices only measure a very small volume of the soil, and even when the number of probes is increased, no information is generally obtained about the lateral variation of SW and only a vertical soil moisture profile can be established. In addition, the number of such devices cannot be increased indefinitely without major perturbations of the system and incurring pro-hibitive costs. Geophysical imaging techniques, which are rapid, cost-effective and cause only low perturbation of the soil, have recently been proposed as a good proxy for the spa-tialisation of soil water measurements (Michot et al., 2003; Beff et al., 2013; Garré et al., 2011, to name but a few). As the technique is recent and a generalised method does not ex-ist, there have been no reviews on the possible approaches to spatially measure soil water and its availability through these geophysical techniques, especially those based on electrical resistivity (ER), which are the most promising.
Vineyards are being studied, within an interdisciplinary view of the soil system (Brevik et al., 2015), due to the high erosion rates (Novara et al., 2011; Lieskovský and Kender-essy, 2014; Martínez-Casasnovas et al., 2013), their spe-cial man-made landforms (Tarolli et al., 2015) and pollution (Fernández-Calviño et al., 2013; Novara et al., 2013; Parras-Alcántara et al., 2013). This article concentrates on soil water relationships in vineyards and will review the use of ERT to spatially measure soil water and its availability to plants.
First, the grapevine physiological response to drought will be briefly reviewed, with special regard to plant and soil rela-tionships, as well as soil properties that affect plant water sta-tus. Then, the concept of soil water availability to plants will be discussed. Finally, the contribution of geophysical meth-ods, and in particular ER, to the study of plant and soil wa-ter relationships in vineyards will be discussed. These tools are very promising for the quantification and visualisation of plant and soil water relationships.
Part 1: A review about the use of ERT to spatially quantify soil water and its availability to plants
2 Plant and soil water relationships in terroir
The effect of water on fruit production has received great in-terest because it directly affects both the quantity and quality of the final product. Water deficits have a physiological im-pact at the whole-plant level. The need to acquire knowledge on plant–soil–atmosphere water relationships is further in-creased by the current context of global warming. A number of studies have therefore flourished on the subject in recent years and have shown that, in addition to trees, grapevines can now be considered as model plants from both physiologi-cal and molecular points of view. Among the reasons for such success that can be mentioned here are the great progress made in grapevine genomics (Jaillon et al., 2007) and the long history of ecophysiological research for this plant. A complete physiological and molecular update can be found in Lovisolo et al. (2010). In this section we will provide only a brief overview of water relationships between plants and soils and their effects on terroir.
In grapevine a moderate water deficit reduces berry size and increases technological quality (higher sugar levels and lower acidity, for example). The reason is that the vegeta-tive and reproducvegeta-tive organs are competing sinks for carbo-hydrates produced by photosynthesis. Apexes are the most important sinks when fruits are not present. When fruits de-velop, they become progressively more important sinks for carbohydrates. During water stress, apexes reduce and then stop their growth, but the reduction in the vegetative growth varies across vegetative organs and physiological processes (Pellegrino et al., 2005a). If shoot growth stops before verai-son, there is no competition for carbohydrates between fruits and apexes during ripening. Red wines benefit from a mod-erate water deficit, while sparkling or white wines do not, nor table grapes (Sadras and Schultz, 2012). Soils favourable to the installation of a moderate water deficit during the summer, which are generally well suited to the production of high-quality red wines, have been described in France (Seguin, 1975; Choné et al., 2001a; van Leeuwen et al., 2009), Italy (Storchi et al., 2005; Tomasi et al., 2013), Hun-gary (Zsófi et al., 2009), the USA (Chapman et al., 2005) and in many other regions in the world. Research into the effect of water deficit on the quality of white wines is rare, but one such study was performed by des Gachons et al. (2005). The effect of water deficit on grape quality potential can be neg-ative, because it causes an increase in phenolic compounds, which is not considered favourable for the quality of white wine (Sadras and Schultz, 2012). White wine also needs a certain level of acidity, which is rapidly degraded during wa-ter deficit (Ollat et al., 2002).
affect the absorption process and have a direct physiologi-cal effect on plants. When the texture of the soil is fine, the soil matrix potential is low because of greater forces retain-ing water in capillary pores and at the surface of clay min-erals. Therefore, the plant water potential must be more neg-ative to allow absorption, even if soil volumetric water con-tent is higher in fine-textured soils compared to sandy soils. Indeed, at the wilting point, the soil volumetric water con-tent of fine-textured soil is always higher than that of coarse-textured soils (Kramer and Boyer, 1995). Water in macro-and meso-pores is generally more easily available to plants, but it is also more mobile, as it is not retained by capillary forces. Sandy soils have higher macro- and meso-porosity than clayey soils, and the available water tends to be highly variable in time. Contact between roots and soil, which is necessary for absorption, is favoured in fine-textured soils and more difficult in coarse-textured soils, as well as in soils rich in gravels. These parameters influencing soil water po-tential and water absorption by vines have an important effect on the terroir effect, which is probably indirect and mediated by the physiological adaptations of vines to the surrounding environment (van Leeuwen, 2010). In Bordeaux vineyards, wines produced on clayey soils, where the soil matrix poten-tial is lower, are higher in anthocyanin content than those pro-duced on sandy soils (van Leeuwen et al., 2004). Grapes also ripen faster on clayey soils. In Tuscany, moderately saline soils have been shown to produce the best wines (as evalu-ated by a sensory panel) even if water is not limited, proba-bly because the lower osmotic potential induces a moderate water deficit, as measured byδ13C (Costantini et al., 2009, 2010). Soil texture modifies the plant’s response to drought, as shown by Tramontini et al. (2012), who studied the ef-fect of texture on grapevine physiology in neighbouring soils during the same vintage. They observed that gravel soils lim-ited stomatal conductance and predawn water potential more than clayey and sandy soils. In sandy soils, stomatal conduc-tance was highly variable, while it was less in clayey soil. On gravel soils, stomatal conductance was constantly low, independent of the level of water stress. Some authors have attributed the reported physiological differences observed in various soils to differences in root–shoot signalling mediated by ABA (Lovisolo et al., 2010; Ferrandino and Lovisolo, 2014). The water-holding capacity of a soil varies with soil depth. In deeper soils, vine vigour is higher and phenology is delayed (Bodin and Morlat, 2006). Soil depth can also have a direct effect on plant physiology, independent of the wa-ter amount, which is known as the bonsai effect (Passioura, 2002). However, the influence of such physiological modifi-cations in field conditions should be further investigated.
With increasingly dry soil conditions, the root / shoot biomass ratio increases (Dry et al., 2000; Hsiao and Xu, 2000). While root growth continues in the most humid soil layers (Bauerle et al., 2008), generally located at greater depths, shoot growth is quickly inhibited by water deficit (Schultz and Matthews, 1988; Lebon et al., 2006). The
ex-ploitation of soil water tends to be as complete as possible. Indeed, the use of lateral resources plays a very important role during drought periods (Bauerle et al., 2008). Plants can also lose water during the absorption process at root level. This process is called hydraulic lift, i.e. water redistribution through plant roots from wet to dry soil layers. The amount of water involved can be extremely significant (2–154 %), and the movement of water has been documented in every direc-tion, including lateral transfer (Smart et al., 2005). The phe-nomenon has several physiological and environmental impli-cations: it increases the survival of roots and maintains root– soil contact in the more easily drying part of the soil, moist-ens nutrients in the shallower soil layers, and keeps fine roots alive in this part of the soil (Neumann and Cardon, 2012; Pri-eto et al., 2012).
3 Assessing the soil water availability to plants
The available water capacity of a soil (also called soil water holding capacity, SWHC) has been defined as the difference between two limits of soil water content. The upper limit is the volumetric soil water content at field capacity (the maxi-mum amount of soil water, excluding free water, that a soil is able to store in the root zone), while the lower limit is the vol-umetric soil water content at the permanent wilting point (the amount below which water is so strongly retained that plants are unable to absorb it). Field capacity corresponds to a soil potential −0.33 kPa (pF = 2.45), while the permanent wilt-ing point has been defined at−15 kPa (pF = 4.2) (Richards and Weaver, 1944). The concept of plant available soil wa-ter capacity, in the form described here, was first introduced by Veihmeyer and Hendrickson (1950). Its simplicity helped to popularise it for irrigation purposes, but it is far from be-ing unanimously accepted in the scientific community. It has been argued that the definition of the two extremes lacks a universal physical basis (Hillel, 1998), and also that water cannot be considered equally available in the expected range because availability decreases as the soil dries out and soil water potential decreases (Richards and Wadleigh, 1952). Furthermore, it is obvious that water availability to plants cannot be assessed without considering the plant. Roots are not uniformly distributed in the soil, water availability is het-erogeneous in space and time, and such heterogeneity affects plant physiology at the whole-plant level. Finally it has been observed that plants, including grapevines (Costantini et al., 2009), can absorb water at lower levels than the theoretical wilting point (i.e.−15 kPa). It is worth noting that Veihmeyer and Hendrickson (1950) already reported a similar observa-tion for plants grown in containers. These observaobserva-tions can-not be discounted and have to be taken into account both for irrigation scheduling and for ecophysiological research.
availability for plants (because root absorption is the first cause of water content variation in soils) and also to evaluate soil water capacity on the basis of the physiological response of plants. TTSW is defined as the difference between soil wa-ter at field capacity and soil wawa-ter measured when plants are no longer able to extract water from the soil, which depends on the plant species. Both limits are directly estimated in the field, and not in the laboratory, by moisture release curves. The idea was first advanced by Ritchie (1981) and then suc-cessfully experimented with both in herbaceous crops (La-cape et al., 1998; Lecoeur and Guilioni, 1998; Guilioni and Lhomme, 2006, to name but a few) and in woody species (Sinclair et al., 2005; Lu et al., 2010, to name but a few). In grapevines the concept has been used in the most recently developed water balance model (Lebon et al., 2003; Pelle-grino et al., 2006; Celette et al., 2010). Water balance mod-elling is an interesting approach to assess vine water status in both irrigated and non-irrigated vineyards, especially when coupled to plant-based measurements (van Leeuwen et al., 2010). Soil moisture can be difficult to measure in field con-ditions because the grapevine is a deep-rooting species, often grown on soils rich in gravels. Hence, measuring soil water potential with tensiometers, or soil water content using time domain reflectometry (TDR) or neutron moisture probes, can be difficult or even impossible to implement. Furthermore, these devices measure only a very small volume of soil, and even when the measurement is replicated by increasing the number of probes, no information is generally obtained about the lateral variation of the TTSW. Only a vertical soil mois-ture profile can be established. In addition, multiplying the number of such devices can lead to major perturbations of the system and prohibitive costs. The estimation of TTSW with such devices depends greatly on the position of access tubes or probes and can therefore yield misleading informa-tion. Geophysical imaging measurements such as electrical resistivity provide visual quantification of soil water content in two or three dimensions and assess its variations over time. Electrical resistivity is therefore a powerful tool to study soil water relationships at high spatial and temporal resolution.
4 Electrical imaging of the soil water
Applications of geophysical imaging techniques, and specif-ically electrspecif-ically based techniques, have been tested and reviewed in hydrology (Robinson et al., 2008), ecology (Jayawickreme et al., 2014), plant science (Attia Al Hagrey, 2007), soil sciences and agronomy (Samouelian et al., 2005, which also reviews the basic principles). They offer promis-ing perspectives in agronomy, for both production and re-search. The main techniques are based on the direct or in-direct measurement of electrical resistivity (or of its oppo-site, electrical conductivity), such as electrical resistivity to-mography (ERT, or electrical resistivity imaging, ERI) and electromagnetic induction (EMI). Measurements can also be
recorded with mobile devices, and several commercial sen-sors have been developed to assist in soil mapping. The success of electrical resistivity is based on its sensitivity to soil properties, including water (Friedman, 2005; Hadz-ick et al., 2011; Brillante et al., 2014a). It can be imple-mented for many purposes, like soil texture mapping (Tri-antafilis and Lesch, 2005); assessment of coarse element con-tent in soils (Tetegan et al., 2012); the study of soil structure and compaction (Besson et al., 2004), soil hydraulic con-ductivity (Doussan and Ruy, 2009), and soil horizonation (Tabbagh et al., 2000); assessment of the effect of different tillage systems (Basso et al., 2010); map root distribution and quantification of biomass (Amato et al., 2008, 2009; Rossi et al., 2011) and absorption (Srayeddin and Doussan, 2009); agricultural management, especially in precision agriculture (Jaynes et al., 2005; Lesch et al., 2005; Corwin and Lesch, 2005; Andrenelli et al., 2013; André et al., 2012); and in the evaluation of soil volume wetness and transpirable soil water both at the plot scale (Michot et al., 2003; Attia Al Hagrey, 2007; Werban et al., 2008; Garré et al., 2011, 2013; Brillante et al., 2014a, to name but a few) and at the field scale (Besson et al., 2010), with interesting perspectives for applications in plant ecophysiology.
4.1 Acquiring data
The relationship between ER and SW has been observed in many studies, by many authors and in many different settings (see Sect. 4.3). It is dependant on soil characteristics and is therefore site-specific. Hence, in order to use ER to moni-tor soil water it is necessary to perform a calibration, which can be carried out in the field or in the laboratory. The fol-lowing section will review and compare the procedures used to acquire data to explore the relationship between ER and SW. Modelling details will be described, but the technical and practical aspects of ERT measurements will not be dis-cussed (see the tutorial provided by Loke, 2014).
4.1.1 Laboratory methods
with repacked samples should be avoided because of the possibility of large systematic errors. On the other hand, Nadler (1991) observed that ER–SW relationships were sta-ble, whether measured on “field”, “packed” or “severely dis-turbed samples”. Soil structure is not the only problem. Mi-chot et al. (2003) used both laboratory (measuring the re-sistivity of cylindrical soil cores) and field methods (with the 4P method, described hereafter). They had to discard the first method because the saturation water conductivity of the cylindrical soil cores was different from the conductivity of the soil solution. In addition, they noticed great variability in the resistivity values obtained for different volumes of soil, for the same soil moisture content: the higher the volume of the soil core, the higher the electrical resistivity.
4.1.2 Field methods
Field methods permit calibrations specifically adapted to the local context. They are more difficult to implement and the control over the environment is lower than for laboratory methods. In field conditions, it can take a long period of time to obtain a variation in soil water content large enough to fit the model, particularly in deeper soil layers, except for irrigated vineyards located in dry regions. Different meth-ods have been used to examine SW–ER relationships in the field, using electrical resistivity, whether inverted or not. Two methods can be used to measure the bulk ER (i.e. not in-verted) of a soil in undisturbed conditions and then to explore ER–SW relationships. The first is the 4P method (principles and an example of application are provided in Michot et al., 2003). This method uses four electrodes inserted perpendic-ularly to the soil profile in a trench. The major part of each electrode is isolated, except the end, to ensure a punctiform contact with the soil (1–2 cm, or more in stony soils). Be-cause the soil surrounds the electrodes in all directions and current propagation is not limited by the air, as is the case when electrodes are at the soil surface, the function that al-lows the measurement of the potential difference,1V, uses 4π instead of 2π. The second technique, which is easier to implement, uses the electrical conductivity given by TDR probes to fit the relationship between ER and SW (an ex-ample is in Beff et al., 2013). If the TDR device is combined with a datalogger, a large amount of data may be acquired easily, rapidly and efficiently.
When inverted electrical resistivity is used, the inversion uses a grid with the spatial resolution that best fits the soil wa-ter measurements. The cells corresponding to the soil layer where soil water measurements are available are selected, and their ER is laterally averaged. The final data that will be used for the spatialisation and imaging in ERT are used to fit the relationships (an example of the procedure is provided in Brillante et al., 2014a). The drawback of this approach is that the inversion process, whether for the ERT technique or for any other imaging technique, only yields estimated values of ER (there is no single solution). The true value approached
by inversion is the bulk ER data of a specific region of soil. The bulk ER data would be the most accurate choice, but they are more complicated to obtain because the device used for measuring has to be inserted in the specific region of inter-est, while with inversion the device can generally be at the soil surface. An advantage of the use of inverted ER is that a greater amount of data can be acquired, therefore provid-ing greater spatial coverage, both vertically and laterally. In addition, Brillante et al. (unpublished data) tested both possi-bilities, and concluded that if the inversion process converges with a low associated error (lower than 5 %), then the dif-ference between inverted ER and bulk ER is low enough to justify the use of inverted data. The iteration to select and fit the model also has to be defined. One possibility is to use the iteration with the best performances in the relationship with SW; another is to use the iteration with the lowest error (as measured by RMSE, and lower than 5 %).
4.2 Temperature correction
Electrical current in soils is mainly electrolytic, i.e. based on the displacement of ions in pore water. The electrical resis-tivity of soil therefore depends on the amount of water in the pores and its concentration in electrolytes. The ER de-creases with a decrease in soil water content (Samouelian et al., 2005). However, the electrical resistivity is also de-pendent on other soil characteristics, such as the amount of gravels and clay, salinity and temperature, the latter of which because of kinetic effects on ion mobility in pore water. Be-fore fitting any relationship between ER and soil water con-tent, it is important to adapt the ER to the reference temper-ature of 25◦C (Samouelian et al., 2005). A linear correction equation is generally used to increase (or reduce) ER by a factorαif soil temperature is higher (or lower) than the ref-erence temperature (Campbell et al., 1948). The value of the correction factor is approximately equal to 2 % (in the liter-ature, the factor varies from 1.9 % in Amente et al., 2000, to 2.5 % in Brunet et al., 2010). It has also been observed that theαfactor can vary slightly for a given soil depending on its temperature (Illiceto, 1969). Although some studies have ne-glected this correction (in particular when temperature vari-ations are low), its use should be considered good practice (Brevik et al., 2004; Nijland et al., 2010).
is heterogeneous, this has to be taken into account in the re-lationship. One possible solution is to fit specific relation-ships for each soil layer (see Michot et al., 2003; Beff et al., 2013; Garré et al., 2011, among others). This method is ef-ficient when SW probes are fixed in the soil. The fitting of many individual relationships for a number of thin and regu-larly spaced soil layers (for example, every 0.1 m in Brillante et al., 2014a) can be accurate when soil water is measured by probes inserted in access tubes. The separation of data between the soil surface and the deeper soil layers also im-proves the fit (Hadzick et al., 2011). Another solution is to include soil properties in the model to used to develop pe-dotransfer functions (Hadzick et al., 2011; Brillante et al., 2014a). Many authors have developed semi-empirical geo-physical models to describe the relationships and investigate the main soil factors involved. Other authors have developed purely empirically relationships. In the following sections, different methods used to spatialise SW by ER are reviewed in two groups: petro-physical models and experimental cali-brations.
4.3.1 Petro-physical models
The first petro-physical model linking ER to SW was pro-posed by Archie (1942) and is shown in Eq. (1) in terms of electrical resistivity:
ρ= a
φmθnσ w
, (1)
whereρis the electrical resistivity of the fluid-saturated rock, φdenotes the porosity,σwrepresent the electrical
conductiv-ity of the brine,θ is the brine saturation,mis the cementa-tion exponent, nthe saturation exponent anda is the tortu-osity factor. It was developed in pure sand without any clay and can be useful for coarse-grained soil with limited clay content (examples of applications are given in Attia Al Ha-grey, 2007; Brunet et al., 2010). Indeed, clays can have a di-rect effect on soil resistivity because clay minerals are elec-trically charged and can directly conduct electric current at their surface. The model developed by Waxman and Smits (1968) was based on the Archie model, with the inclusion of a term accounting for the cation exchange capacity (CEC) of the medium. Like the Archie model, the Waxman and Smits model was also developed for geological applications, but it has been successfully applied in soil contexts (Garré et al., 2011). Other modifications of the Archie law have been pro-posed by other authors (Revil et al., 1998, 2007; Linde et al., 2006; Shah and Singh, 2005), often with increasing complex-ity in order to better capture the details of the electrical flow in geological contexts. Many of these petro-physical models were tested, in a laboratory experiment, for application on loamy soils by Laloy et al. (2011). The Archie law has been largely applied because of its simplicity (Frohlich and Parke, 1989), as has the Waxman and Smits model, the latter es-pecially in its simplified form (as in Garré et al., 2011; Beff
et al., 2013). The generalised form of Archie’s law (proposed by Shah and Singh, 2005, with an interesting application in Schwartz et al., 2008) appears to be a valid alternative when the soil contains clay and the conductivity of the soil matrix cannot be neglected.
The use of such petro-physical models is interesting from a geophysical perspective. They allow for comparison with other studies, as the estimated parameters can be reused in similar contexts. They also allow for further understanding of the electrical resistivity of soils. However, in some situa-tions, there is no consensus about the meaning of some pa-rameters in the models, which may have been included only with the aim of improving the fit (e.g. as thea coefficients in the modified Archie law by Winsauer et al., 1952). More-over, and particularly for the most useful models, the factors influencing the ER–SW relationships are loosely compressed into a few global parameters (as in the simplified Waxman and Smits models), meaning that their precise interpretation remains possible, although it is more difficult (Garré et al., 2011).
4.3.2 Experimental calibrations
The use of a petro-physical model is not the only way to pre-dict soil water content by ER. It is also possible to use a direct empirical calibration, by regression analysis, and with paral-lel measurements of the volumetric soil water content. This can be the most direct approach if the aim is merely to use ER as an ancillary variable to spatialise SW. This technique has an accuracy that is comparable to the application of a petro-physical model, and it has successfully been used by many authors (among others Michot et al., 2003; Calamita et al., 2012; Brillante et al., 2014a). A linear regression anal-ysis was suggested by Gupta and Hanks (1972). However, the relationship between SW and ER appears linear only when considering a limited range of variations of these variables. When looking at the data collected from different studies by Calamita et al. (2012), it appears obvious that the global re-lationship is not linear (as in all petro-physical models pre-viously reviewed). Some adjustments are therefore needed in order to account for the lack of linearity (Calamita et al., 2012, and Brillante et al., 2014a, reviewed some possibili-ties of adjustment). Alternatively, non-linear regression tech-niques have also been used. Extrapolation (i.e. forecasting outside the observed range of data) should be avoided be-cause, in this type of calibration, only the form of relationship relative to the observed data is modelled. Once the relation-ship has been established, it is applied to transform inverted ER data obtained with ERT method to spatialise the soil wa-ter content.
to allow a wider use of the technique without the necessary process of calibration and modelling, which is currently the most time-consuming part of the work. Because of the easy application of these experimental functions, it can be worth comparing them to the other methods previously reviewed.
Part 2: Applying the electrical resistivity to monitor the fraction of transpirable soil water, in relation to grapevine water potentials – a case study
5 Material and methods
5.1 Experimental site
The results presented in this study are derived from data collected over 2 years (2012–2013) in an experimental plot located in a commercial vineyard (Domaine Louis Latour, Aloxe-Corton, Burgundy) in France. Each plot is a 7 m×7 m area composed of 49 grapevines (Vitis vinifera, L.), culti-var Chardonnay B. grafted on the SO4 rootstock
(interspe-cific cross betweenVitis ripariaMichx. andVitis berlandieri Planch.). Vines were guyot-pruned and trained in a vertically shoot position trellis system with the first training wire at 0.5 m and the fruiting cane trimmed at 1.20 m; distance be-tween plants was approximately 0.9 m. Plant position was taken with a differential GPS (DGPS Trimble Geo XH V6, precision<5–10 cm). The soil is a Calcaric Cambisol (Aric, Colluvic, Loamic, Protocalcic) according to the World Ref-erence Base for Soil Resources (IUSS Working Group WRB, 2014), located in a foot-slope positions. The colluvium is mainly composed of fine earth eroded from the soils of the upper part of the slope, but also gravel (20 % in volume in the first metre of the profile). The parent material was a marl– limestone series dating from the middle Oxfordian. Figure 1 illustrates the plot location and equipment. Each plot was equipped with three Tecanat™ access tubes for TDR soil water measurement profiles and with 24 stainless steel elec-trodes for ERT measurements. Meteorological data were col-lected from an on-site weather station.
5.2 FTSW measurement and spatialisation
In 2012 and 2013, SW was measured weekly from bunch clo-sure to grape maturity (approx. mid-June to mid-September, 28 dates) by TDR (TRIME-T3 IMKO GmbH, Ettlingen, Germany; precision±2 %). From SW measurements FTSW data were computed as defined in the work by Pellegrino et al. (2005b). The minimum and maximum SW values nec-essary to compute the FTSW were found with a complete search over all available measurements for each depth. Plants reached a minimum value of approximately−0.4 MPa, nec-essary to approximate the lower bound of FTSW during 2012. On the same days, electrical resistivity measure-ments were performed using a multichannel resistivity me-ter (Syscal Junior, Iris Instruments, Orleans, France) with
Figure 1.Scheme in 3-D which illustrates the equipment of the experimental plot in the vineyard with devices for hydric and geo-physical field-data acquisition. This image has already appeared in Brillante et al. (2014a), courtesy of Elsevier.
24 stainless steel electrodes to generate high-resolution 2-D electrical resistivity images along the vine rows, with pix-els of 0.375 m by 0.1 m. The total length of the geophysi-cal transect was 17.25 m. The centre of the geophysigeophysi-cal tran-sect is where the sensitivity of the electrical measurement is higher and the investigation is deeper. Grapevines of the ex-perimental plots where therefore chosen in correspondence of the transect centre (length of the grapevine plots 7 m). A pedotransfer function specifically developed in this soil and published in Brillante et al. (2014b) was used to obtain 2-D images of the FTSW. The random forest model used for the pedotransfer function had an RMSE of 17 % in FTSW.
5.3 Plant physiological measurements
Predawn leaf9pdand solar noon stem9stemwater potentials
(Choné et al., 2001b) were monitored weekly with a pressure chamber (PMS Instruments Inc., Albany, OR, USA). Eight grapevines were measured for9pd and 12 for9stem. Plant
water potentials were measured on the same day of soil water and electrical resistivity measurements.
6 Results and discussion
Figure 2.Weekly estimation of the fraction of transpirable soil water (FTSW) in a vineyard soil spatialised in 2-D by electrical resistivity tomography. Green-filled dots represent fully developed plants and empty dots represent very young plants (1 year). The bottom-left panel shows the grapevine water stress variation as measured by leaf water potentials, and the bottom-right panel the ombrothermic diagram of 2013 vintages, temperatures and precipitations.
depletion. Because of the relative scale, the amount of water needed to bring the FTSW of two depleted pixels with the same FTSW to 100 can be different, and these maps can-not be read in this way. Regions of the soil that are only marginally explored by roots, where all the FTSW corre-spond to 0.01–0.02 cm3cm−3(1–2 %vol.) of SW, very soon reach their extreme low and high values. A low FTSW value is not necessarily the sign of greater root absorption but is pri-marily the sign of the depletion of the water reservoir. How-ever such confusion disappears when looking at the map time series as a whole.
In Fig. 2 it appears that the FTSW and grapevine leaf wa-ter potentials follow a similar temporal patwa-tern, with alwa-ternat- alternat-ing phases of depletion and replenishment, even at a weekly scale. The pattern is also obviously related to the amount of rainfall. Soil water tended to deplete throughout the season, but heavy rains replenished the reservoir several times during the season, especially at the end of July and the end of
Au-gust. The grapevine water deficit followed the same pattern, even if it never indicated a severe plant water stress, but a moderate one. It is very interesting to observe that the midday 9stem appears to be more sensitive than9pd to even slight
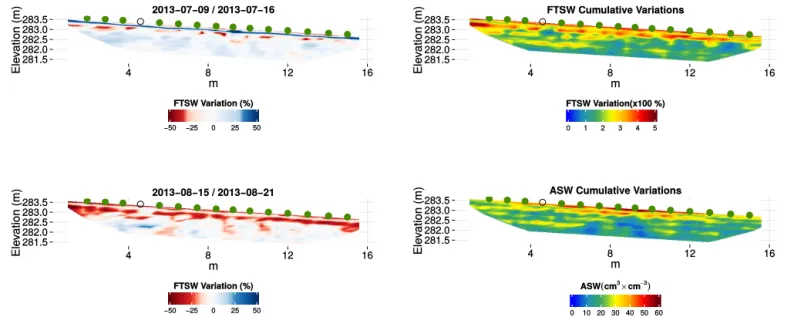
Figure 3.Variations in FTSW between two periods. White colour-ing is mapped to the error associated with the computation of the difference; further explanation can be found in the text. Green-filled dots represent fully developed plants and empty dots represent very young plants (1 year).
Figure 3 plots the variations of ER between two periods (16–23 July 2013 and 15–21 August 2013), characterised by a steeper reduction in the FTSW compared to other days. These measurements were carried out at the end of the two longest dry periods, with a parallel drop in leaf water poten-tials. Variation maps, if compared to TDR-based FTSW, may have higher errors than single date maps because of the cu-mulation of errors when computing the differences between the FTSW for various dates. The colour palette chosen for presenting these maps takes into account the error (as mea-sured by RMSE). White is used for pixels that do not vary, and a gradient red or blue is used once the threshold of RMSE is passed. Hence, when red or blue is used, the difference in FTSW for different dates is significant. When looking at 16 and 23 July and 15 and 21 August in Fig. 2 it appears that the soil globally dries out, but, looking at Fig. 3, it becomes ob-vious that these differences are very localised. In July, when the water deficit is still low, the regions of greater variations of FTSW are located at the soil surface. In the map from 21 August, where the water deficit is higher (the predawn leaf water potential lower), greater reduction of FTSW is ob-served between the grapevines, as well as in deeper layers of the soil. It is also interesting that FTSW variations are re-duced for both maps at the location of a young vine. It ap-pears that regions of great variations in FTSW alternate with regions of lower variation. However, the spatial organisation appears dependent on the level of water deficit experienced by the grapevines. On 16 July, the predawn leaf water po-tential is less negative than on 21 August and, with a lower water deficit, water absorption remains localised at the soil
Figure 4.Cumulative variations of FTSW and ASW in a vine-yard soil. These were obtained by summing the absolute values of the variations between two successive measurements for these vari-ables (28 measurements). Green-filled dots represent fully devel-oped plants and empty dots represent very young plants (1 year).
surface. Lateral heterogeneity of FTSW is greater than in Au-gust. Indeed, in the August map, the soil regions located im-mediately beneath the grapevines appear to show the greatest FTSW variations, but they also seem to increase the exploita-tion of water in the area between plants.
Finally, Fig. 4 summarises the spatio-temporal soil water relationships by cumulating the absolute values of all varia-tions observed over 2 years (computed from the 28 dates of measurement) in order to qualitatively detect hotspots in soil for water absorption in relation to the observed water deficit during the monitoring period.
7 Conclusions
modelling approaches to calibrate ER with TDR measure-ments. However, some of the reported techniques are still in their infancy, such as the use of pedotransfer functions in SW estimation, and therefore their validity will be assessed in time. A case study is presented at the end of the article, with the purpose of showing the technique and to stimulate curiosity in non-expert readers.
In conclusion, we believe that ERT is a technique with a great future in agronomic scenarios, both from a research and production point of view. It will allow for answers to new questions on plant and soil relationships, and it will also open the way to new techniques for water management in agricul-tural scenarios.
Acknowledgements. This work was funded by the Conseil Régional de Bourgogne and the Bureau Interprofessionnel des Vins de Bourgogne (BIVB). The authors wish to thank Domaine La-tour for the access to the vineyard; Carmela Chateau Smith for assistance with English; Sarah De Ciantis, Céline Faivre-Primot, Thomas Marchal and Basile Pauthier for help in laboratory analysis and field-data acquisition. The authors wish also to thank the anonymous reviewers for help in improving the quality of the manuscript.
Edited by: A. Cerdà
References
Amato, M., Basso, B., Celano, G., Bitella, G., Morelli, G., and Rossi, R.: In situ detection of tree root distribution and biomass by multi-electrode resistivity imaging, Tree Physiology, 28, 1441–1448, 2008.
Amato, M., Bitella, G., Rossi, R., Gómez, J. A., Lovelli, S., and Gomes, J. J. F.: Multi-electrode 3D resistivity imaging of alfalfa root zone, European J. Agronomy, 31, 213–222, doi:10.1016/j.eja.2009.08.005, 2009.
Amente, G., Baker, J., and Reece, C.: Estimation of soil solution electrical conductivity from bulk soil electrical conductivity in sandy soils, Soil Sci. Soc. Am. J., 64, 1931–1939, 2000. André, F., van Leeuwen, C., Saussez, S., Van Durmen, R., Bogaert,
P., Moghadas, D., de Rességuier, L., Delvaux, B., Vereecken, H., and Lambot, S.: High-resolution imaging of a vineyard in south of France using ground-penetrating radar, electromagnetic induc-tion and electrical resistivity tomography, J. Appl. Geophys., 78, 113–122, doi:10.1016/j.jappgeo.2011.08.002, 2012.
Andrenelli, M. C., Magini, S., Pellegrini, S., Perria, R., Vignozzi, N., and Costantini, E. A. C.: The use of the ARP© system to reduce the costs of soil survey for precision viticulture, J. Appl. Geophys., 99, 24–34, doi:10.1016/j.jappgeo.2013.09.012, 2013. Archie, G. E.: The electrical resistivity log as an aid in determining some reservoir characteristics, Transactions of the AIME, 146, 54–62, 1942.
Attia Al Hagrey, S.: Geophysical imaging of root-zone, trunk, and moisture heterogeneity, J. Exp. Botany, 58, 839–854, doi:10.1093/jxb/erl237, 2007.
Basso, B., Amato, M., Bitella, G., Rossi, R., Kravchenko, A., Sar-tori, L., Carvahlo, L. M., and Gomes, J.: Two-dimensional spatial
and temporal variation of soil physical properties in tillage sys-tems using electrical resistivity tomography, Agronomy J., 102, 440, doi:10.2134/agronj2009.0298, 2010.
Bauerle, T. L., Smart, D. R., Bauerle, W. L., Stockert, C., and Eissenstat, D. M.: Root foraging in response to heterogeneous soil moisture in two grapevines that differ in potential growth rate, New Phytologist, 179, 857–866, doi:10.1111/j.1469-8137.2008.02489.x, 2008.
Beff, L., Günther, T., Vandoorne, B., Couvreur, V., and Javaux, M.: Three-dimensional monitoring of soil water content in a maize field using Electrical Resistivity Tomography, Hydrol. Earth Syst. Sci., 17, 595–609, doi:10.5194/hess-17-595-2013, 2013.
Bernard-Ubertosi, M., Dudoignon, P., and Pons, Y.: Characteriza-tion of structural profiles in clay-rich marsh soils by cone resis-tance and resistivity measurements, Soil Sci. Soc. Am. J., 73, 46, doi:10.2136/sssaj2007.0347, 2009.
Besson, A., Cousin, I., Samouëlian, A., Boizard, H., and Richard, G.: Structural heterogeneity of the soil tilled layer as character-ized by 2D electrical resistivity surveying, Soil Tillage Re., 79, 239–249, doi:10.1016/j.still.2004.07.012, 2004.
Besson, A., Cousin, I., Bourennane, H., Nicoullaud, B., Pasquier, C., Richard, G., Dorigny, A., and King, D.: The spatial and tem-poral organization of soil water at the field scale as described by electrical resistivity measurements, European J. Soil Sci., 61, 120–132, doi:10.1111/j.1365-2389.2009.01211.x, 2010. Bodin, F. and Morlat, R.: Characterization of viticultural terroirs
using a simple field model based on soil depth I. Validation of the water supply regime, phenology and vine vigour, in the Anjou vineyard (France), Plant Soil, 281, 37–54, doi:10.1007/s11104-005-3768-0, 2006.
Brevik, E. C., Fenton, T. E., and Horton, R.: Effect of daily soil temperature fluctuations on soil electrical conductivity as mea-sured with the Geonics EM-38, Precision Agriculture, 5, 145– 152, 2004.
Brevik, E. C., Cerdà, A., Mataix-Solera, J., Pereg, L., Quinton, J. N., Six, J., and Van Oost, K.: The interdisciplinary nature ofSOIL, SOIL, 1, 117–129, doi:10.5194/soil-1-117-2015, 2015. Brillante, L., Bois, B., Mathieu, O., Bichet, V., Michot, D., and
Lévêque, J.: Monitoring soil volume wetness in heterogeneous soils by electrical resistivity. A field-based pedotransfer func-tion, J. Hydrol., 516, 55–66, doi:10.1016/j.jhydrol.2014.01.052, 2014a.
Brillante, L., Bois, B., Mathieu, O., and Leveque, J.: Spatio-temporal analysis of grapevine water behaviour in hillslope vine-yards. The example of Corton Hill, Burgundy, in: Xth Interna-tional Terroir Congress, p. 6, 2014b.
Brunet, P., Clément, R., and Bouvier, C.: Monitoring soil water con-tent and deficit using Electrical Resistivity Tomography (ERT) – A case study in the Cevennes area, France, J. Hydrol., 380, 146– 153, doi:10.1016/j.jhydrol.2009.10.032, 2010.
Calamita, G., Brocca, L., Perrone, A., Piscitelli, S., Lapenna, V., Melone, F., and Moramarco, T.: Electrical resistivity and TDR methods for soil moisture estimation in central Italy test-sites, J. Hydrol., 454–455, 101–112, doi:10.1016/j.jhydrol.2012.06.001, 2012.
pressure to electrical conductivity and ion concentration for soil extracts, Soil Sci. Soc. Am. Proc., 13, 66–69, 1948.
Celette, F., Ripoche, A., and Gary, C.: WaLIS – A simple model to simulate water partitioning in a crop association: The example of an intercropped vineyard, Agric. Water Manag., 97, 1749–1759, doi:10.1016/j.agwat.2010.06.008, 2010.
Chapman, D. M., Roby, G., Ebeler, S. E., Guinard, J.-X., and Matthews, M. A.: Sensory attributes of Cabernet Sauvignon wines made from vines with different water status, Australian J. Grape Wine Res., 11, 339–347, 2005.
Choné, X., Van Leeuwen, C., Chery, P., and Ribéreau-Gayon, P.: Terroir influence on water status and nitrogen status of non-irrigated cabernet sauvignon (Vitis vinifera). Vegetative develop-ment, must and wine composition (Example of a Medoc top es-tate vineyard, Saint Julien Area, Bordeaux , 1997), South African J. Enology Viticulture, 22, 8–26, 2001a.
Choné, X., van Leeuwen, C., Dubourdieu, D., and Gaudil-lère, J. P.: Stem water potential is a sensitive indicator of grapevine water status, Annals of Botany, 87, 477–483, doi:10.1006/anbo.2000.1361, 2001b.
Corwin, D. L. and Lesch, S. M.: Characterizing soil spatial vari-ability with apparent soil electrical conductivity, Comput. Electr. Agriculture, 46, 135–152, doi:10.1016/j.compag.2004.11.003, 2005.
Costantini, E. A. C., Pellegrini, S., Bucelli, P., Storchi, P., Vi-gnozzi, N., Barbetti, R., and Campagnolo, S.: Relevance of the Lin’s and Host hydropedological models to predict grape yield and wine quality, Hydrol. Earth Syst. Sci., 13, 1635–1648, doi:10.5194/hess-13-1635-2009, 2009.
Costantini, E. A. C., Pellegrini, S., Bucelli, P., Barbetti, R., Cam-pagnolo, S., Storchi, P., Magini, S., and Perria, R.: Mapping suit-ability for Sangiovese wine by means ofδ13C and geophysical sensors in soils with moderate salinity, European J. Agronomy, 33, 208–217, doi:10.1016/j.eja.2010.05.007, 2010.
des Gachons, C. P., van Leeuwen, C., Tominaga, T., Soyer, J. P., Gaudillère, J. P., and Dubourdieu, D.: Influence of water and nitrogen deficit on fruit ripening and aroma potential ofVitis vinifera L cv Sauvignon blanc in field conditions, J. Sci. Food Agric., 85, 73–85, doi:10.1002/jsfa.1919, 2005.
Doussan, C. and Ruy, S.: Prediction of unsaturated soil hydraulic conductivity with electrical conductivity, Water Resour. Res., 45, 1–12, doi:10.1029/2008WR007309, 2009.
Dry, P., Loveys, B. R., Botting, D., and During, H.: Effects of par-tial root-zone drying on grapevine vigour, yeld, composition of fruit and use of water, in: Proceedings of the 9th Australian Wine Industry Technical Conference, pp. 126–131, 1996.
Dry, P. R., Loveys, B. R., and During, H.: Partial drying of the root-zone of grape. II. Changes in the pattern of root development, Vitis, 39, 9–12, 2000.
Fernández-Calviño, D., Garrido-Rodríguez, B., López-Periago, J. E., Paradelo, M., and Arias-Estévez, M.: Spatial distribution of copper fractions in a vineyard soil, Land Degradation Develop., 24, 556–563, doi:10.1002/ldr.1150, 2013.
Ferrandino, A. and Lovisolo, C.: Abiotic stress effects on grapevine (Vitis vinifera L.): Focus on abscisic acid-mediated consequences on secondary metabolism and berry quality, Environ. Exp. Botany, 103, 138–147, doi:10.1016/j.envexpbot.2013.10.012, 2014.
Friedman, S. P.: Soil properties influencing apparent electrical conductivity: a review, Comput. Electr. Agric., 46, 45–70, doi:10.1016/j.compag.2004.11.001, 2005.
Frohlich, R. K. and Parke, C. D.: The electrical resistivity of the vadose zone – Field Survey, Groundwater, 27, 524–530, 1989. Garré, S., Javaux, M., Vanderborght, J., Pagès, L., and Vereecken,
H.: Three-dimensional electrical resistivity tomography to mon-itor root zone water dynamics, Vadose Zone J., 10, 412–424, doi:10.2136/vzj2010.0079, 2011.
Garré, S., Coteur, I., Wongleecharoen, C., Kongkaew, T., Diels, J., and Vanderborght, J.: Noninvasive monitoring of soil wa-ter dynamics in mixed cropping systems: a case study in ratchaburi province, Thailand, Vadose Zone J., 12, 1–12, doi:10.2136/vzj2012.0129, 2013.
Guilioni, L. and Lhomme, J. P.: Modelling the daily course of capit-ulum temperature in a sunflower canopy, Agric. For. Meteorol., 138, 258–272, doi:10.1016/j.agrformet.2006.05.010, 2006. Gupta, S. C. and Hanks, R. J.: Influence of water content on
elec-trical conductivity of the soil, Soil Sci. Soc. Am. Proc., 36, 855– 857, 1972.
Hadzick, Z. Z., Guber, A. K., Pachepsky, Y. A., and Hill, R. L.: Pedotransfer functions in soil electrical resistivity estimation, Geoderma, 164, 195–202, doi:10.1016/j.geoderma.2011.06.004, 2011.
Hillel, D.: Environmental soil physics, Academic Press, San Diego, CA, 1998.
Hsiao, T. C. and Xu, L. K.: Sensitivity of growth of roots versus leaves to water stress: biophysical analysis and relation to water transport, J. Exp. Botany, 51, 1595–1616, 2000.
Illiceto, V.: Contribution à la prospection géophysique des sites archéologiques, PhD thesis, Université de Paris, 1969.
IUSS Working Group WRB: World reference base for soil resources 2014. International soil classification system for naming soils and creating legends for soil maps, FAO, Rome, world soil edn., 2014.
Jaillon, O., Aury, J.-M., Noel, B., Policriti, A., Clepet, C., Casagrande, A., Choisne, N., Aubourg, S., Vitulo, N., Jubin, C., Vezzi, A., Legeai, F., Hugueney, P., Dasilva, C., Horner, D., Mica, E., Jublot, D., Poulain, J., Bruyère, C., Billault, A., Segurens, B., Gouyvenoux, M., Ugarte, E., Cattonaro, F., An-thouard, V., Vico, V., Del Fabbro, C., Alaux, M., Di Gaspero, G., Dumas, V., Felice, N., Paillard, S., Juman, I., Moroldo, M., Scalabrin, S., Canaguier, A., Le Clainche, I., Malacrida, G., Du-rand, E., Pesole, G., Laucou, V., Chatelet, P., Merdinoglu, D., Delledonne, M., Pezzotti, M., Lecharny, A., Scarpelli, C., Ar-tiguenave, F., Pè, M. E., Valle, G., Morgante, M., Caboche, M., Adam-Blondon, A.-F., Weissenbach, J., Quétier, F., and Wincker, P.: The grapevine genome sequence suggests ancestral hexaploidization in major angiosperm phyla, Nature, 449, 463– 467, doi:10.1038/nature06148, 2007.
Jayawickreme, D. H., Jobbágy, E. G., and Jackson, R. B.: Geophys-ical subsurface imaging for ecologGeophys-ical applications, New Phytol-ogist, 201, 1170–1175, 2014.
Jaynes, D. B., Colvin, T. S., and Kaspar, T. C.: Iden-tifying potential soybean management zones from multi-year yield data, Comput. Electronics Agric., 46, 309–327, doi:10.1016/j.compag.2004.11.011, 2005.
Lacape, M. J., Wery, J., and Annerose, D. J. M.: Relationships between plant and soil water status in five field-grown cotton (Gossypium hirsutumL .) cultivars, Field Crops Res., 57, 29–43, doi:10.1016/S0378-4290(97)00111-1, 1998.
Laloy, E., Javaux, M., Vanclooster, M., Roisin, C., and Bielders, C. L.: Electrical resistivity in a loamy soil: identification of the appropriate pedo-electrical model, Vadose Zone J., 10, 1023– 1033, doi:10.2136/vzj2010.0095, 2011.
Lebon, E., Dumas, V., Pieri, P., and Schultz, H. R.: Modelling the seasonal dynamics of the soil water balance of vineyards, Func-tional Plant Biol., 30, 699–710, doi:10.1071/FP02222, 2003. Lebon, E., Pellegrino, A., Louarn, G., and Lecoeur, J.: Branch
development controls leaf area dynamics in grapevine (Vitis vinifera) growing in drying soil, Annals of Botany, 98, 175–185, doi:10.1093/aob/mcl085, 2006.
Lecoeur, J. and Guilioni, L.: Rate of leaf production in response to soil water deficits in field pea, Field Crops Res., 57, 319–328, doi:10.1016/S0378-4290(98)00076-8, 1998.
Lesch, S. M., Corwin, D. L., and Robinson, D. A.: Apparent soil electrical conductivity mapping as an agricultural management tool in arid zone soils, Comput. Electronics Agric., 46, 351–378, doi:10.1016/j.compag.2004.11.007, 2005.
Lieskovský, J. and Kenderessy, P.: Modelling the Effect of Veg-etation Cover and Different Tillage Practices on Soil Erosion in Vineyards: a Case Study in Vráble (Slovakia) Using WA-TEM/SEDEM, Land Degradation Development, 25, 288–296, 2014.
Linde, N., Binley, A., Tryggvason, A., Pedersen, L. B., and Revil, A.: Improved hydrogeophysical characterization using joint inversion of cross-hole electrical resistance and ground-penetrating radar traveltime data, Water Resour. Res., 42, 1–16, doi:10.1029/2006WR005131, 2006.
Loke, M. H.: Tutorial 2-D and 3-D electrical imaging surveys, February, Geotomo Software, 2014.
Loveys, B. R., Dry, P. R., Stoll, M., and Mc Carthy, M. G.: Using plant physiology to improve the water use efficiency of horticul-tural crops, Acta Horticulturae, 537, 187–197, 2000.
Lovisolo, C., Perrone, I., Carra, A., Ferrandino, A., Flexas, J., Medrano, H., and Schubert, A.: Drought-induced changes in de-velopment and function of grapevine (Vitis spp.) organs and in their hydraulic and non-hydraulic interactions at the whole-plant level: a physiological and molecular update, Funct. Plant Biol., 37, 98–116, 2010.
Lu, Y., Equiza, M. A., Deng, X., and Tyree, M. T.: Recovery of
Populus tremuloidesseedlings following severe drought causing total leaf mortality and extreme stem embolism, Physiol. Plant., 140, 246–257, doi:10.1111/j.1399-3054.2010.01397.x, 2010. Martínez-Casasnovas, J. A., Ramos, M. C., and Benites, G.: Soil
and water assessment tool soil loss simulation at the sub-basin scale in the alt penedès-anoia vineyard region (NE spain) in the 2000s, Land Degradation Develop., published online first, doi:10.1002/ldr.2240, 2013.
Michot, D.: Intérêt de la géophysique de subsurface et de la télédé-tection multispectrale pour la cartographie des sols et le suivi de leur fonctionnement hydrique à l’échelle intraparcellaire, PhD thesis, Université Paris, 6, 2003.
Michot, D., Benderitter, Y., Dorigny, A., Nicoullaud, B., King, D., and Tabbagh, A.: Spatial and temporal monitoring of soil water content with an irrigated corn crop cover using surface
electri-cal resistivity tomography, Water Resour. Res., 39, 14–1–14–20, doi:10.1029/2002WR001581, 2003.
Nadler, A.: Effect of soil structure on bulk soil electrical conduc-tivity (ECa) using the TDR and 4P techniques, Soil Sci., 152, 199–203, 1991.
Neumann, R. B. and Cardon, Z. G.: The magnitude of hydraulic redistribution by plant roots: a review and synthesis of em-pirical and modeling studies, New Phytologist, 194, 337–352, doi:10.1111/j.1469-8137.2012.04088.x, 2012.
Nijland, W., van der Meijde, M., Addink, E. A., and de Jong, S. M.: Detection of soil moisture and vegetation water abstraction in a Mediterranean natural area using electrical resistivity tomog-raphy, Catena, 81, 209–216, doi:10.1016/j.catena.2010.03.005, 2010.
Novara, A., Gristina, L., Saladino, S. S., Santoro, A., and Cerdà, A.: Soil erosion assessment on tillage and alternative soil man-agements in a Sicilian vineyard, Soil Tillage Res., 117, 140–147, doi:10.1016/j.still.2011.09.007, 2011.
Novara, A., Gristina, L., Guaitoli, F., Santoro, A., and Cerdà, A.: Managing soil nitrate with cover crops and buffer strips in Si-cilian vineyards, Solid Earth, 4, 255–262, doi:10.5194/se-4-255-2013, 2013.
Ollat, N., Diakou-Verdin, P., Carde, J. P., Barrieu, F., and Gaudillère, J. P.: Grape berry development: a review, J. Int. Scie. Vigne Vin, 36, 109–131, 2002.
Parras-Alcántara, L., Martín-Carrillo, M., and Lozano-García, B.: Impacts of land use change in soil carbon and nitrogen in a Mediterranean agricultural area (Southern Spain), Solid Earth, 4, 167–177, doi:10.5194/se-4-167-2013, 2013.
Passioura, J. B.: Soil conditions and plant growth, Plant, Cell Envi-ron., 25, 311–318, 2002.
Pellegrino, A., Lebon, E., Simonneau, T., and J, W.: Towards a sim-ple indicator of water stress in grapevine (Vitis viniferaL.) based on the differential sensitivities of vegetative growth components, Aust. J. Grape Wine Res., 11, 306–315, doi:10.1111/j.1755-0238.2005.tb00030.x, 2005a.
Pellegrino, A., Lebon, E., Voltz, M., and Wery, J.: Relationships be-tween plant and soil water status in vine (Vitis vinifera L.), Plant Soil, 266, 129–142, doi:10.1007/s11104-005-0874-y, 2005b. Pellegrino, A., Gozé, E., Lebon, E., and Wery, J.: A
model-based diagnosis tool to evaluate the water stress experienced by grapevine in field sites, European J. Agronomy, 25, 49–59, doi:10.1016/j.eja.2006.03.003, 2006.
Prieto, I., Armas, C., and Pugnaire, F. I.: Water release through plant roots: new insights into its consequences at the plant and ecosys-tem level, New Phytologist, 193, 830–841, doi:10.1111/j.1469-8137.2011.04039.x, 2012.
Revil, A., Cathles, L. M., Losh, S., and Nunn, J. A.: Electrical con-ductivity in shaly sands with geophysical applications, J. Geo-phys. Res., 103, 23925, doi:10.1029/98JB02125, 1998. Revil, A., Linde, N., Cerepi, A., Jougnot, D., Matthai,
S., and Finsterle, S.: Electrokinetic coupling in unsatu-rated porous media, J. Coll. Interface Sci., 313, 315–327, doi:10.1016/j.jcis.2007.03.037, 2007.
Richards, L. A. and Weaver, L. R.: Moisture retention by some irri-gated soils as related to soil-moisture tension, J. Agric. Res., 69, 215–235, 1944.
Ritchie, J. T.: Water dynamics in the soil-plant-atmosphere system, Plant Soil, 58, 81–96, doi:10.1007/BF02180050, 1981. Robinson, D. A., Campbell, C. S., Hopmans, J. W., Hornbuckle,
B. K., Jones, S. B., Knight, R., Ogden, F., Selker, J., and Wen-droth, O.: Soil moisture measurement for ecological and hydro-logical watershed – scale observatories: a review, Vadose Zone J., 7, 358–389, doi:10.2136/vzj2007.0143, 2008.
Rossi, R., Amato, M., Bitella, G., Bochicchio, R., Ferreira Gomes, J. J., Lovelli, S., Martorella, E., and Favale, P.: Electrical re-sistivity tomography as a non-destructive method for mapping root biomass in an orchard, European J. Soil Sci., 62, 206–215, doi:10.1111/j.1365-2389.2010.01329.x, 2011.
Sadras, V. O. and Schultz, H. R.: Grapevine, in: Crop yield response to water, edited by: Steduto, P., Hsiao, T., Fereres, E., and Raes, D., p. 501, FAO, Rome, Italy, 2012.
Samouelian, A., Cousin, I., Tabbagh, A., Bruand, A., and Richard, G.: Electrical resistivity survey in soil science: a review, Soil Tillage Res., 83, 173–193, doi:10.1016/j.still.2004.10.004, 2005. Schultz, H. R. and Matthews, M. A.: Resistance to Water Trans-port in Shoots ofVitis viniferaL., Plant Physiology, 88, 718–724, doi:10.1104/pp.88.3.718, 1988.
Schultz, H. R. and Stoll, M.: Some critical issues in environmental physiology of grapevines : future challenges and current limita-tions, Aust. J. Grape Wine Res., 16, 4–24, doi:10.1111/j.1755-0238.2009.00074.x, 2010.
Schwartz, B. F., Schreiber, M. E., and Yan, T.: Quantifying field-scale soil moisture using electrical resistivity imaging, J. Hydrol., 362, 234–246, doi:10.1016/j.jhydrol.2008.08.027, 2008. Seguin, G.: Alimentation en eau de la vigne dans des sols du
Haut-Médoc, Connaissance Vigne Vin, 2, 23–34, 1969.
Seguin, G.: Alimentation en eau de la vigne et composition chim-ique des mouts dans les grand crus du Médoc. Phénomènes de regulation, Connaissance Vigne Vin, 9, 23–34, 1975.
Shah, P. H. and Singh, D. N.: Generalized Archie’s law for estima-tion of soil electrical conductivity, J. ASTM Int., 2, 1–20, 2005. Sinclair, T. R., Holbrook, N. M., and Zwieniecki, M. A.: Daily
tran-spiration rates of woody species on drying soil, Tree Physiology, 25, 1469–1472, 2005.
Smart, D. R., Carlisle, E., Goebel, M., and Núñez, B. A.: Transverse hydraulic redistribution by a grapevine, Plant, Cell Environ., 28, 157–166, doi:10.1111/j.1365-3040.2004.01254.x, 2005. Srayeddin, I. and Doussan, C.: Estimation of the spatial
variabil-ity of root water uptake of maize and sorghum at the field scale by electrical resistivity tomography, Plant Soil, 319, 185–207, doi:10.1007/s11104-008-9860-5, 2009.
Stoll, M., Loveys, B., and Dry, P.: Hormonal changes induced by partial rootzone drying of irrigated grapevine, J. Exp. Botany, 51, 1627–1634, 2000.
Storchi, P., Constantini, E. A. C., and Buceli, P.: The influence of climate and soil on viticultural and enological parameters of San-giovese grapevines under non-irrigated conditions, Acta Horti-culturae, 689, 333–340, 2005.
Tabbagh, A., Dabas, M., Hesse, A., and Panissod, C.: Soil resistiv-ity: a non-invasive tool to map soil structure horizonation, Geo-derma, 97, 393–404, 2000.
Tarolli, P., Sofia, G., Calligaro, S., Prosdocimi, M., Preti, F., and Dalla Fontana, G.: Vineyards in terraced landscapes: new op-portunities from Lidar data, Land Degradation Develop., 26, 92– 102, 2015.
Tetegan, M., Pasquier, C., Besson, A., Nicoullaud, B., Bouthier, A., Bourennane, H., Desbourdes, C., King, D., and Cousin, I.: Field-scale estimation of the volume percentage of rock frag-ments in stony soils by electrical resistivity, Catena, 92, 67–74, doi:10.1016/j.catena.2011.09.005, 2012.
Tomasi, D., Gaiotti, F., and Jones, G. V.: The power of the terroir: the case study of Prosecco wine, Springer Basel, 2013.
Tramontini, S., Leeuwen, C., Domec, J.-C., Destrac-Irvine, A., Basteau, C., Vitali, M., Mosbach-Schulz, O., and Lovisolo, C.: Impact of soil texture and water availability on the hydraulic con-trol of plant and grape-berry development, Plant Soil, 368, 215– 230, doi:10.1007/s11104-012-1507-x, 2012.
Triantafilis, J. and Lesch, S. M.: Mapping clay content variation us-ing electromagnetic induction techniques, Comput. Electronics Agric., 46, 203–237, doi:10.1016/j.compag.2004.11.006, 2005. van Leeuwen, C.: Terroir: the effect of the physical environment
on vine growth , grape ripening and wine sensory attributes, in: Managing Wine Quality. Volume 1: Viticulture and wine quality, edited by: Reynolds, A., chap. 9, p. 624, Woodhead Publishing, Cambridge, UK, 1 edn., available at: http://www.sciencedirect. com/science/book/9781845694845 (last access date: 12 March 2015), 2010.
van Leeuwen, C. and Seguin, G.: The concept of terroir in viticul-ture, J. Wine Res., 17, 1–10, doi:10.1080/09571260600633135, 2006.
van Leeuwen, C., Friant, P., Choné, X., Tregoat, O., Koundouras, S., and Dubourdieu, D.: Influence of climate, soil, and cultivar on terroir, Am. J. Enol. Viticulture, 55, 207–217, 2004. van Leeuwen, C., Tregoat, O., and Choné, X.: Vine water status is
a key factor in grape ripening and vintage quality for red bor-deaux wine. How can it be assessed for vineyard management purposes?, J. Int. Sci. Vigne Vin, 43, 121–134, 2009.
van Leeuwen, C., Pieri, P., and Vivin, P.: Comparison of three oper-ational tools for the assessment of vine water status: stem water potential, carbon isotope discrimination measured on grape sugar and water balance, in: Methodologies and Results in Grapevine Research, edited by: Delrot, S., Medrano, H., Or, E., Bavaresco, L., and Grando, S., chap. 7, pp. 87–106, Springer Netherlands, 1 edn., doi:10.1007/978-90-481-9283-0, 2010.
Veihmeyer, F. J. and Hendrickson, A. H.: Soil moisture in relation to plant growth, Annu. Rev. Plant Physiology, 1, 285–305, 1950. Waxman, M. H. and Smits, L. J. M.: Electrical conductivities in oil-bearing shaly sands, Soc. Pet. Eng. J., 8, 107–122, doi:10.2118/1863-A, 1968.
Werban, U., Attia al Hagrey, S., and Rabbel, W.: Monitor-ing of root-zone water content in the laboratory by 2D geo-electrical tomography, J. Plant Nut. Soil Sci., 171, 927–935, doi:10.1002/jpln.200700145, 2008.