Article
J. Braz. Chem. Soc., Vol. 26, No. 1, 40-50, 2015. Printed in Brazil - ©2015 Sociedade Brasileira de Química 0103 - 5053 $6.00+0.00
A
*e-mail: [email protected]
Evaluation of Two Statistical Tools (Least Squares Regression and Artificial Neural
Network) in the Multivariate Optimization of Solid-Phase Extraction for Cadmium
Determination in Leachate Samples
Hélio R. Sousa Filho, Daniel M. Oliveira, Valfredo A. Lemos and Marcos A. Bezerra*
Universidade Estadual do Sudoeste da Bahia, Campus de Jequié, Rua José Moreira Sobrinho, s/n, 45206-190 Jequié-BA, Brazil
Este trabalho propõe a otimização multivariada de um procedimento para determinação de cádmio em amostras de chorume usando-se espectrometria de absorção atômica com chama após a extração em fase sólida usando-se uma minicoluna empacotada com Amberlite XAD-4 modificada com ácido 3,4-diidróxibenzoico. As variáveis relacionadas à pré-concentração (pH, razão de amostragem e concentração do tampão) foram otimizadas usando-se planejamento Doehlert. Duas ferramentas para modelagem estatística (regressão por mínimos quadrados e redes neurais artificiais) foram aplicadas aos dados e seus desempenhos foram comparados. Procedimentos de digestão do chorume por aquecimento em meio ácido e por radiação ultravioleta foram avaliados sendo este último mais adequado para evitar a perda de Cd por volatilização. O procedimento desenvolvido apresentou um fator de enriquecimento de 9 vezes com limites de detecção e de quantificação (3sb) de 0,72 e 2,4 µg L-1, respectivamente, e precisão - expressa como porcentagem
do desvio padrão relativo - de 4,0 e 6,4% (RSD%, n = 4 para 5,0 e 20,0 µg L-1, respectivamente). Testes de adição/recuperação de Cd foram realizados obtendo-se valores entre 97 e 112%. O procedimento foi aplicado na determinação de cádmio em amostras de chorume coletadas no aterro sanitário do município de Jaguaquara-BA, Brasil.
This work proposes the use of multivariate optimization as a procedure for cadmium determination in leachate samples via flame atomic absorption spectrometry after solid phase extraction using a minicolumn packed with Amberlite XAD-4 modified with 3,4-dihydroxybenzoic acid. The variables related with the preconcentration (pH, sampling flow rate and buffer concentration) were optimized using Doehlert design. Two statistical modeling tools (least squares regression and artificial neural networks) have been applied to the data and their performances were compared. Digestion procedures of the leachate by heating in acid medium and ultraviolet radiation were evaluated being the latter more appropriate to prevent loss of Cd by volatilization. The developed procedure has promoted an enrichment factor of 9, with detection and quantification limits (3sb) of 0.72 and 2.4 µg L-1, respectively, and precision - expressed as relative standard
deviation percentage - of 4.0 and 6.4% (RSD%, n = 4 for 5.0 and 20.0 µg L-1, respectively).
Addition/recovery tests for Cd were carried out and values between 97 and 112% were obtained. The procedure was applied for cadmium determination in leachate samples collected at the sanitary landfill of Jaguaquara-BA, Brazil.
Keywords: cadmium, landfill leachate, solid-phase extraction, Doehlert design, least squares regression, artificial neural network
Introduction
The production of a dark liquid called leachate is common in sanitary landfills. This residue results from the decomposition of waste mass plus the rainwater percolating
into the landfill, and the trash moisture.1 The contamination
of soil, air or water by composites such as the leachate is extremely harmful to the environment. Leachate can contain high concentrations of chemical compounds and potentially toxic metals that can modify the ideal conditions
of the ecosystem.2
resulting from the production of alloys, the manufacture of products containing Cd, batteries and leachate from sanitary landfills can be mentioned. Cadmium is very toxic to humans and other animals. Products containing Cd (inks, enamels and alloys) are possible sources of contamination to foods and beverages and can cause acute toxicity. Among the adverse health effects caused by exposure to this metal or its derivatives, the following are noteworthy: chronic lung diseases, emphysema, kidney disorders, anemia, liver
and bone diseases, and others.3
Amongst the types of metals present in the complex matrix of leachate, Cd can hardly be quantified by flame atomization atomic absorption spectrometry (FAAS), since the quantification limit of the analytical technique is not sufficiently low. Furthermore, the difficulties increase with losses provoked by the volatility of this analyte when the sample is digested by heating in open systems, the low metal concentrations in the examined matrices, and the occurrence of matrix effects. So, the pretreatment of samples requires an effective preconcentration stage so as to lower the instrumental detection and quantification
limits.4-6 This procedure allows quantifying Cd by FAAS,
since the interfering substances are eliminated and the analyte is isolated from the matrix components at a higher
concentration.5
Solid phase extraction (SPE) is one of the preconcentration methods commonly applied in environmental analyses. SPE methods are based on analyte sorption onto the solid surface of a determined material (commonly silica, XAD resins, polyurethane foam, etc., impregnated or modified with a complexing agent) followed by elution with adequate
solvents.7 Solid phase extraction in minicolumns is a
procedure that involves variables that must be optimized for each type of analyte and type of solid phase used such as pH, sample flow rate and buffer volume. Nowadays, multivariate optimization is used in this optimization, since it does not either require a great deal of experiments and reagents or consumes much time; in addition, it allows the
evaluation of interactions between the different variables.8,9
As for the work involving SPE, the use of multivariate experimental design methodologies for response surface generation, such as the Doehlert design, is possible in the search for the optimum extraction conditions. The use of this methodology allows simultaneous improvements of the responses that are influenced by factor-level combinations. In the case of SPE, the major contributing factors in the extraction are pH, which is a key parameter in the retention
of the analyte,10 sampling flow rate and buffer concentration.
Fitting the mathematical functions to the results obtained by combining different levels of variables allows predicting the result as well as the influences of each factor in a given
experiment. This type of methodology has advantages such
as savings in time, materials and costs.11 In conjunction
with the statistical techniques, the Doehlert matrix can be applied to generate response surfaces and study the behavior of the variables. This methodology allows finding the optimum conditions of an experiment. Essentially, the most efficient way is to look at a combination of factors which result in the best response of a process or in the best
features of a product.12
Mathematical functions that generate response surfaces can be fitted to experimental data using the classical least square methodology or alternative methodologies, such as artificial neural networks (ANN). ANN provide an attractive possibility for providing non-linear modeling for response surfaces. In classical response surface methodology (RSM), the number of terms in the polynomial equation is limited to the number of experimental design points. On the other hand, ANN methodology allows the modeling of complex relationships without this limitation. Its analysis is quite flexible in regard to the number and form of the experimental data having better predictive power than regression models. Regression analyses are dependent on predetermined statistical significance levels, and less significant terms are usually not included in the model. With the ANN method, all data are used making the models
more accurate.12,15
Accordingly, the objective of this study was to determine the Cd concentrations at trace level in landfill leachate samples through the development of an effective methodology that makes use of solid phase extraction and flame atomic absorption spectrometry. The response surfaces methodology, associated with least squares regression and artificial neural networks, was applied in the mathematical optimization and search of optimum values for the most significant variables in the preconcentration process.
Experimental
Instrumentation
Metal concentrations were measured using a Perkin Elmer AAnalyst 200 model flame atomic absorption spectrometer (Norwalk, USA) equipped with deuterium arc lamp for background correction. The hollow cathode lamp was used as a source of radiation at a wavelength of 228.8 nm for the spectral bandwidth of Cd. The flame composition for determining the studied metals was
acetylene (flow rate: 2.0 mL min-1) and air (flow rate:
13.5 mL min-1). The nebulizer flow rate was 5.0 mL min-1.
portable pHmeter ML 1010 (MISURA LINE) was used to measure the pH. A TE007MP block digester (Tecnal) with temperature control and a laboratory-made ultraviolet digester craft equipped with 20 W mercury low-pressure lamps (Mercury) were respectively used in the acid and ultraviolet digestion of leachate samples. An ultrasonic bath with controlled heating (Visque Model 1450A) was used to facilitate outgassing of the samples after digestion by ultraviolet radiation.
Reagents and solutions
The reagents used were of analytical grade. Water was deionized with Elga purifier (model Purelab Classic). Working solutions of Cd were diluted from stock solutions
of 1000 mg mL-1 (Merck). The pH of solutions was adjusted
with acetate (pH 3.8 to 5.8), phosphate (pH 6.2 to 7.5), borate (pH 7.5 to 9.0) and ammoniacal (pH 10.0) buffer solutions. The solutions of nitric acid and hydrochloric acid were prepared from solutions of concentrated acid (Merck, Darmstadt, Germany).
The working glassware was washed with deionized water after decontamination with nitric acid solution (10%) for 24 hours.
Sample collection
Leachate samples were collected from the sanitary landfill of Jaguaquara (lat. 13°31’51” S and long. 39°58’15” W) in the southwest region of Bahia, northeastern Brazil. Samples were collected from November 2011 to May 2012. The leachate was collected directly into the primary reservoir where it is stored after passing through the collector arrays. The samples were stored in polyethylene flasks and were immediately taken to the laboratory for pH determination and placing in a refrigerator. All collection vials were subjected to triple washing with deionized water, kept in a nitric acid solution (5% v/v) for 24 hours and then rinsed again with deionized water.
Optimization procedure
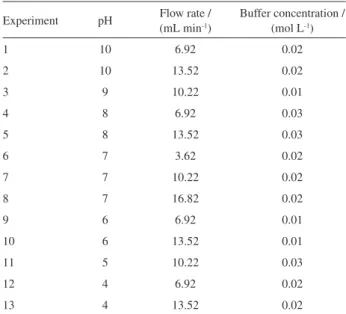
The Doehlert design matrix was applied in the optimization procedure for Cd preconcentration in leachate samples. The procedure consisted in the solid phase extraction (SPE) of the metal in a minicolumn packed with 0.1 g of a polymeric resin (Amberlite XAD-4) modified with 3,4-dihydroxybenzoic acid (DHB), elution and subsequent determination by FAAS. The variables optimized in the design were: pH, buffer concentration and flow rate sampling and their level combinations
are presented in Table 1. All of the studied factors were explored on at least three levels. At the central point, three replicates were carried out for calculating the experimental error. The generated data were analyzed using Statistica 7 software, and the experiments were performed in duplicate.
Cadmium solutions were prepared in 20 mL volumetric flasks to which a specific pH buffer was added along with
the pre-established metal concentration of 30 µg L-1. After
that, the analytes were eluted from the SPE column using
1 mL of 1.0 mol L-1 HCl and transferred to vials for analysis
by FAAS.
Synthesis of XAD-4/DHB resin
This modified resin has been used before by our research
group.13 Amberlite XAD-4 beads (5 g) were treated with
10 mL of concentrated HNO3 and 25 mL of concentrated
H2SO4 and the mixture stirred at 60 oC for 1 h in a water
bath. Afterwards, the reaction mixture was poured into an ice-water mixture. The nitrated resin was filtered, washed repeatedly with water until free from acid and thereafter
treated with a reducing mixture of 40 g of SnCl2, 45 mL
of concentrated HCl and 50 mL of ethanol. The mixture
was refluxed for 12 h at 90 oC. The solid precipitate was
filtered and washed with water and 2 mol L-1 NaOH. The
amino resin was first washed with 2 mol L-1 HCl and finally
with distilled water to remove the excess of HCl. It was
suspended in an ice-water mixture (150 mL) of 1 mol L-1
HCl and 1 mol L-1 NaNO
2. The diazotized resin was
filtered, washed with ice-cold water and reacted with DHB
Table 1. Experimental matrix of Doehlert design for optimizing the SPE method
Experiment pH Flow rate / (mL min-1)
Buffer concentration / (mol L-1)
1 10 6.92 0.02
2 10 13.52 0.02
3 9 10.22 0.01
4 8 6.92 0.03
5 8 13.52 0.03
6 7 3.62 0.02
7 7 10.22 0.02
8 7 16.82 0.02
9 6 6.92 0.01
10 6 13.52 0.01
11 5 10.22 0.03
12 4 6.92 0.02
(3.3 g in 250 mL of 10% m/v NaOH solution) at 0-3 oC for 24 h. The resulting brown-colored resin was filtered, washed with water and dried in air. The mass of the resin used to fill the column and the type and concentration of
the eluent (1.0 mol L-1 HCl) was established in accordance
with previous studies.
Mathematical modeling
Mathematical modeling was carried out using two modeling tools: least squares regression and artificial neural network. The surfaces were obtained by fitting polynomial functions to the absorbances obtained for each combination of levels regarding the variables set by a Doehlert design. The performances of two modeling methods were compared
using the coefficient of determination (R2).
UV digestion of leachate
Leachate samples were digested with UV radiation.14
A sample of 6.5 mL leachate was placed in a Petri dish in which another 0.5 mL of hydrogen peroxide (VETEC) plus another 3.0 mL of an ammoniacal buffer solution (pH 10) were added. The solutions were subjected to UV photodigestion for 40 minutes using a laboratory-made digester and were then transferred to 20 mL volumetric flasks. After that, the solutions were subjected to an ultrasonic bath for removal of residual bubbles. Finally, 4 mL of the ammoniacal buffer solution (pH 10) were added to each sample and the liquid was diluted with deionized water up to 20 mL so as to perform the preconcentration procedure.
Acid digestion of leachate on a heating plate
The acid digestion was carried out with 5 mL of leachate. It was placed in a digestion tube and 2 mL of concentrated
HNO3 (65%) were added. Next, the solutions were heated in
the temperature range of 100-120 °C up to nearly dryness and complete digestion. The digested samples were cooled to room temperature. The sample solution was neutralized with 5% NaOH and 4 mL of ammoniacal buffer solution was added. The solutions were transferred to volumetric flasks and had their volumes completed with deionized water up to 20 mL before preconcentration. This process was carried out in duplicate for each sample.
Preconcentration system
Both digested samples (UV and acid procedures) were followed by solid phase extraction. Using a peristaltic
pump, the samples were individually subjected to a minicolumn packed with an Amberlite XAD-4 polymer resin functionalized with 3,4-dihydroxybenzoic acid (DHB)
at a flow rate of 10.92 mL min-1. In addition, 1.0 mL of
1 mol L-1 HCl was used to elute the analyte of interest and
the final solutions were stored in vials for analysis by FAAS.
Results and Discussion
Optimization of experimental conditions for solid phase extraction
Amongst the multivariate optimization procedures, response surface methodology (RSM) has been widely applied in analytical chemistry, since it allows the simultaneous optimization of variables in a very efficient manner. Among the experimental design used in RSM, the use of Doehlert matrix in the optimization of analytical methods has been increasing over the last years due to its efficiency and ease of application to a number of
analytical systems.10 Accordingly, Doehlert was used
in the multivariate optimization of the factors that most affect the solid phase extraction in order to simultaneously define the desired optimum values in this work: an efficient enrichment of the analyte during the sample preconcentration allowing instrumental analysis with better performance. The analytical signal of FAAS (absorbance) is the response of interest in this modeling and the results from Doehlert design application are shown in Table 2.
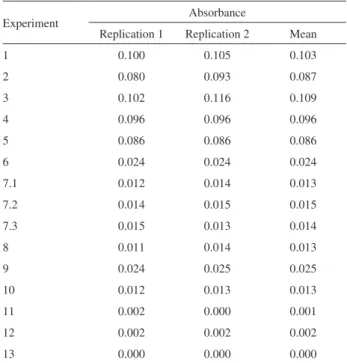
Table 2. Responses (absorbance) from the application of Doehlert design in the preconcentration of Cd
Experiment Absorbance
Replication 1 Replication 2 Mean
1 0.100 0.105 0.103
2 0.080 0.093 0.087
3 0.102 0.116 0.109
4 0.096 0.096 0.096
5 0.086 0.086 0.086
6 0.024 0.024 0.024
7.1 0.012 0.014 0.013
7.2 0.014 0.015 0.015
7.3 0.015 0.013 0.014
8 0.011 0.014 0.013
9 0.024 0.025 0.025
10 0.012 0.013 0.013
11 0.002 0.000 0.001
12 0.002 0.002 0.002
Modeling of response surfaces using least squares regression
Least squares regression is a multiple regression technique used to fit the mathematical models to a set of experimental data with the purpose of generating the least possible residue. The residue is the difference between the experimentally observed value and that calculated on the basis of the fitted mathematical function. Small residues denote a good predictive ability of the mathematical model. A quadratic function, using least squares regression, was fitted (equation 1) to depict the behavior of data from Table 2.
w = 0.23 – 0.035x + 0.0036x2 – 0.0018y + 0.0001y2 –
15.4z + 328z2 – 0.0004xy + 0.33xz + 0.052yz (1)
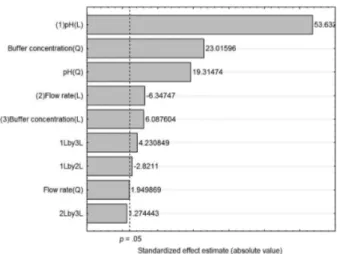
where w is the response (absorbance), x denotes the pH of the preconcentrate solution, whilst y is the sample flow rate and z refers to the buffer concentration. The Pareto chart exhibited in Figure 1 reveals that, with regard to the
quadratic equation, the quadratic term of flow rate (y2) and
the interaction term between flow rate and buffer (yz) are not significant and can be removed without compromising the prediction. Therefore, pH is the most significant variable in the extraction process. Its positive value indicates that Cd extraction can be increased with pH elevation.
The quality of the fitted model can be also evaluated by the
graph of predicted values vs. the experimentally observed
values (Figure 2) and by the coefficient of determination
(R2). The R2 value observed for the linear model was
0.7332, while that for the quadratic model was 0.9174. Despite the analysis of variance (ANOVA) indicating that
there is lack of fit (p < 0.05 for a confidence level of 95%),
the R2 from both the linear and the quadratic models reveals
that the quadratic model is a better predictor. Residuals from the quadratic model do not follow random tendency, however it presents the lowest residuals than a linear model. Therefore, it was applied to obtain the optimum conditions to extract the analyte.
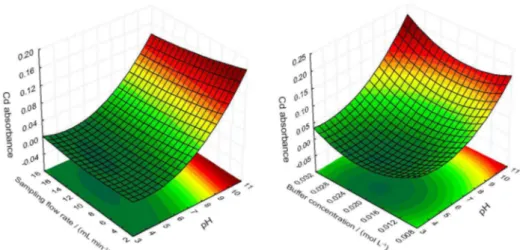
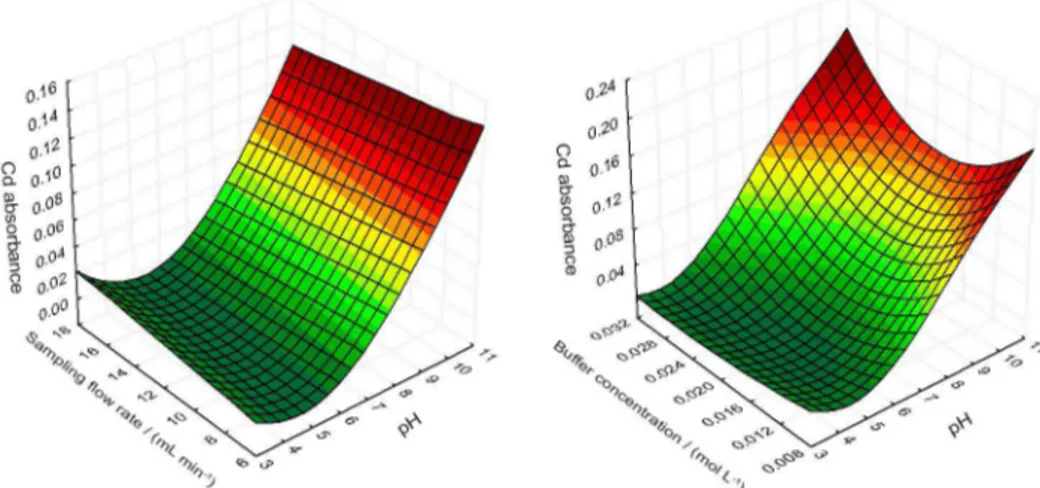
The critical point for the quadratic model is characterized as a minimum point. Given that the goal is to maximize the extraction of Cd in the solid phase, the coordinates of this point will not provide the desired optimum values. Hence, the surfaces generated from the quadratic model should be visually inspected in the search for values that generate the greatest possible response within the experimental field set out by the Doehlert matrix. The surfaces generated from equation 1 are exhibited in Figure 3.
Basic pH favors the extraction process. The influence of this factor on the SPE for the preconcentration of metals based upon complexation is remarkable given how the retention of metals depends upon active sites that arise from the deprotonation of functional groups. Therefore, in order to retain analytes of acidic character, the pH should be increased. It can be noted, then, that the variation in the pH range controls the formation of Cd-DHB complex. Although the effect is not as pronounced as in the case of variable pH, buffer concentration was the second most important factor in the studied preconcentration procedure. This can be justified in view of its role in maintaining the optimum pH when reconditioning the column after elution with HCl. The relatively low response variation for this variable probably has happened due to the short experimental field chosen in relation to the variation of buffer concentration.
Figure 1. Pareto chart relative to the terms of the quadratic function fitted to the data obtained from the application of Doehlert design in the optimization of solid phase extraction for Cd.
The sampling flow rate in many SPE processes in minicolumn plays a major role in the retention of the analyte. A high sampling flow rate can reduce the time of contact of the analyte with the solid phase and thereby diminish its retention. Yet, as the flow rate observed in these experiments was seen to be less significant as compared to other variables, a higher flow rate was used so as to reduce the extraction time and enable faster analyses.
In analyzing surfaces, it was found that the largest extractions of the analyte occur at a basic pH level (10);
sampling flow rate of 10.92 mL min-1 and higher buffer
concentration values (0.03 mol L-1). These values were
chosen as optimum in the implementation of the extraction process.
Modeling of response surfaces by artificial neural networks
Artificial neural networks (ANN) are computational operating systems inspired by the brain operations and consist of groups of highly interconnected processing elements known as neurons. ANN offer alternatives to the classical polynomial regression tools (such as least squares regression) in the mathematical modeling of response
surfaces.15
The data obtained by the application of Doehlert design were modeled by neural networks for obtaining the response surfaces that better describe the behavior of data. The parameters adopted for the supervised learning of the tested networks are presented in Table 3.
Backpropagation has been used as a learning mechanism for networks. So the outputs, which are predicted values,
have been compared vs. the observed values (obtained
experimentally) to produce the smallest possible errors. The following learning algorithms were tested under the same conditions for selecting the most appropriate algorithm to the available data: linear, radial basis function networks
(RBF) and multilayer perceptrons (MLP). For the training phase were used all experimental points of Doehlert design.
The network algorithm No. 5 (Table 4) was the one that exhibited the lowest training error (0.0376) and, because of that, this algorithm was chosen for the construction of response surfaces relative to the optimization of Cd solid phase extraction. As illustrated in Figure 4, this architecture is a quite simple network with an efficient predictive ability. The error obtained in testing this network was also small (0.0596). Another parameter that proves the superiority of
this algorithm is the value of R2. The graph of observed
values vs. predicted values for the algorithm No. 5 is shown
in Figure 5. Note that algorithm No. 5 has the highest
R2 (0.9869).
Algorithm No. 5 is a multilayer perceptron (MLP) whose neural network architecture is characterized by having three neurons in the input layer, a single middle layer with six neurons, and an output layer with one neuron.
Figure 3. Two response surfaces generated by fitting the quadratic model to the data obtained from Cd absorbance.
Table 3. Parameters adopted in the supervised learning of neural networks
Parameter Value
Number of tested networks 10
Number of retained networks 5
Criterion for retention of algorithms Balance: errors vs. diversity
Time frame of learning 5 min
Learning rate 0.3%
Epoch 500000
Tested network algorithms:
Linear
GRNN
RBF
MLP
The network algorithm MLP 3:3-6-1:1 was adopted in the construction of response surfaces (Figure 6). The surface shapes are very similar to those obtained by least squares regression. Nevertheless, its fit to experimental data is higher. Therefore, in this work, the optimized values obtained by visual inspection are virtually identical to those obtained by least squares regression.
In general, ANN is able to better describe the experimental domain studied but in the case study discussed in this manuscript, the two modeling techniques showed the same efficiency of optimization.
Analytical characteristics of the optimized preconcentration method
Under the optimum extraction conditions, the analytical characteristics of the system were obtained for Cd preconcentration via solid phase extraction and determination by FAAS. The calibration curve obtained by the preconcentration of standard solutions was
Table 4. Characteristics of neural networks retained in the training phase during the analysis of data from Doehlert design for optimizing Cd extraction
Algorithm Profile Training error Network architecture
A B C D
1 RBF 2:2-4-1:1 9.8380 2 4 0 1
2 GRNN 3:3-16-2-1:1 5.3352 3 16 2 1
3 Linear 0.2008 2 0 0 1
4 MLP 3:3-9-1:1 0.0389 3 9 0 1
5 MLP 3:3-6-1:1 0.0376 3 6 0 1
A: number of neurons in the input layer; B: number of neurons in the first intermediate layer; C: number of neurons in the second middle layer; D: number of neurons in the output layer; GRNN: general regression neural network; RBF: radial basis function network; MLP: multilayer perceptron.
Figure 4. Architecture of the neural network algorithm No. 5 with three neurons in the input layer, six in the intermediate layer and one in the output layer.
y = 0.9989x + 0.0004 R² = 0.9808
0.00 0.02 0.04 0.06 0.08 0.10 0.12 0.14
0 0.02 0.04 0.06 0.08 0.1 0.12 0.14
Predicte
d
v
al
ue
s
Observed values
Figure 5. Graph of predicted values vs. observed values for therdata generated by the network algorithm No. 5 (MLP 3:3-6-1:1).
A = 0.0024CCd + 0.0046 (R2 = 0.9961), where A refers to
the absorbance and CCd stands for the concentration of Cd in
the solution in µg L-1. It was found that the regression was
highly significant (Freg = 1795 > Ftab = 1.06 × 10
-9). In turn, the
conventional analytical curve (without the preconcentration)
resulted in the following equation A = 0.00027CCd + 0.0091
(R2 = 0.9975). Once again the regression was highly
significant (Freg = 2.026 > Ftab = 1.02 × 10
-7).
The enrichment factor of Cd was calculated as the ratio of slopes (m) provided by the calibration curves with and without the preconcentration step. A preconcentration factor of 9 times was found for this system. The XAD-4/DHB column can be used for more than 450 cycles of preconcentration without losing its efficiency.
The limit of detection (LOD) can be defined as the minimum amount of an analyte that can be detected by a technique, i.e., it is the estimate that the detection of the analyte can be distinguished from a background noise. On the other hand, the limit of quantification (LOQ) is the smallest amount to safely use a technique with a
quantitative error below 5%.16 The limits were determined
using 10 consecutive blank measurements of the aqueous solutions. LOD and LOQ were calculated based on the
calibration curve values. Hence, LOD = 3 sb / m and
LOQ = 10 sb / m, where sb denotes the standard deviation
of measurements from the blank solution, and m refers to the slope of analyical curve. The limits of detection and quantification obtained using this procedure were 0.72 and
2.4 µg L-1, respectively.
The precision of the procedure was assessed by repeatability and reproducibility (accessed by interdays determinations within the same laboratory), using the relative standard deviation percentage (%RSD) of ten consecutive measurements obtained after the preconcentration of standard solutions. The obtained %RSD had values of 3.8 and 5.2% for repeatability and 4.2 and 5.4 for reproducibility, respectively, for concentrations
of 5 and 20 µg L-1.
Since certified leachate samples were not available, the accuracy of Cd determinations was evaluated by the test of metal addition/recovery using the UV digestion procedure. This measure reflects the amount of analyte recovered in the process in respect of the actual quantity present in the
sample.17,18 The results of the recovery test of Cd in leachate
samples at a final concentration of 15 µg L-1 were between
97 to 112%. Three samples were also analyzed by graphite furnace atomic absorption spectrometry (GFAAS) (Table 6) and Cd concentrations were close to those found by the preconcentration method.
Robustness studies were carried out for the three optimized variables using two-level factorial design.
Sampling flow rate was shown to be robust when varying levels below 10% from its optimum value while buffer concentration presents levels of 8% and pH, the less robust variable, presents levels smaller than 2%. Likewise, two procedures for the digestion of leachate samples were assessed: acid digestion and digestion assisted by UV radiation; comparison of these two methods was done via
paired t-test. It was found that there is a significant difference
between the means of results generated at a confidence level
of 95% (p value = 0.012 < 0.05). The concentrations found
by UV method were greater than that from acid digestion. This can be explained by the fact that Cd is a very volatile element that can be easily lost when the sample digestion is
accomplished by heating in open systems.19 To evaluate this
hypothesis, addition/recovery tests for Cd were performed using the digestion of the slurry sample by heating. Losses between 76 and 91% were observed.
Results show that UV digestion has greater advantages over acid digestion in total Cd determination. This fact represents a benefit, since digestion by heating in an open vial increases the risks of sample contamination, which is
extremely harmful in trace analysis.12 Furthermore, UV
digestion acts as a facilitator to preconcentration, since it does not require neutralization of the excess acid that is not consumed in the digestion and thereby adjust the pH before the preconcentration, becomes an easier task.
The analytical characteristics of the developed method were compared with the characteristics from other methods (Table 5), which also carried out offline Cd solid phase extraction. It was noted that, taking into account the small sample volume used, the method presents compatible characteristics with those already published.
Leachate sample analyses
The system of optimized preconcentration was employed to determine Cd concentrations in leachate samples (Table 6). The results are compared to the maximum value allowed by the Brazilian National Environment Council (CONAMA) resolution No. 430/2011, which regulates the
effluent discharge standards.27
The Cd content of leachate samples collected between November 2011 and May 2012 in the stabilization pond is below the limits established by the CONAMA resolution No. 430/2011, i.e., in accordance with the law. The low Cd concentrations can be explained by the low solubility under the prevalent conditions: alkaline pH, high organic matter content, formation of chelates and sedimentation in the pond.
is capable of attenuating the migration of various metals
into the leachate.28 Christensen et al.29 argue that the main
processes of Cd attenuation in leachate are: dilution, complexation, sorption and precipitation. Furthermore, Cd sources such as rechargeable batteries and ferrous alloys are withdrawn by collectors, who have a shed on site. This contributes to a considerable reduction of the element in the landfill cells.
The pH from the acidic or basic medium is crucial in defining the age of the leachate and consequently the age of the landfill. The phases wherein leachate can be classified according to pH variation are methanogenic
and acid.30 A leachate sample collected in the acid phase
in a landfill in operation for a few years and subjected to unstable anaerobic fermentation shows high acidic pH, chemical oxygen demands (COD) and total organic carbon (TOC) levels. In the methanogenic phase, chemical
oxygen demands and total organic carbons decrease as pH
increases.31
As illustrated in Table 6, the pH determined in the leachate samples from the sanitary landfill of Jaguaquara is alkaline. Alkaline pH favors the precipitation and removal of Cd from the leachate, making it stationary on the soil. One can therefore assert that the analyzed leachate derives from the waste mass that is under methanogenic decomposition. When considering that the landfill has been operating for more than 10 years, the pH values corroborate the findings of previous works and indicate
low concentrations of potentially toxic metals.32
In a study conducted at the municipal landfill of Ribeirão Preto city, São Paulo State (Brazil), the Cd contents of leachate samples collected in 2000 and 2004 have been dosed, respectively, at concentrations
of 10 and 12 µg L-1.19 In the quantification of levels of
Table 5. Comparisons of the analytical performance of the present off line system with those reported in the literature with FAAS detection techniques
Sample LOD /
(µg L-1)
LOQ /
(µg L-1) EF %RSD Solid phase
Sampling
volume / mL Ref.
Sanitary landfill leachate 0.72 2,4 9 4.0-6.4 XAD 4 modified with DHB 20 This work
Mineral waters 0.05 0,17 30 2.9-3.4 Sisal fiber loaded with TAR 50 20
Water and sediment 0.093 0.21 20 3.7 Poly-Cd(II)-DAAB-VP ion imprinting resin 100 21
Water and cereal 0.13 0.43 28 – XAD-4 functionalized with 2,6-pyridinedicarboxaldehyde
10 22
Water samples and food products
0.05 0.17 360 2.4 Multiwall carbon nanotubes with diphenylcarbazide
1800 23
Environmental samples 0.43 1.43 50 5 Dowex optipore V-493 250 24
Water samples 0.65 2.2 100 0.92 Gallic acid-silica gel 1000 25
River and tap waters 0. 6 2.0 40 1.5-3.9 Naphthalene-methyltrioctylammonium chloride adsorbent
100 26
EF: enrichment factor; DHB: 3.4-dihydroxybenzoic acid; TAR: thiazolylazo-resorcinol; DAAB-VP: diazoaminobenzene-vinylpyridine.
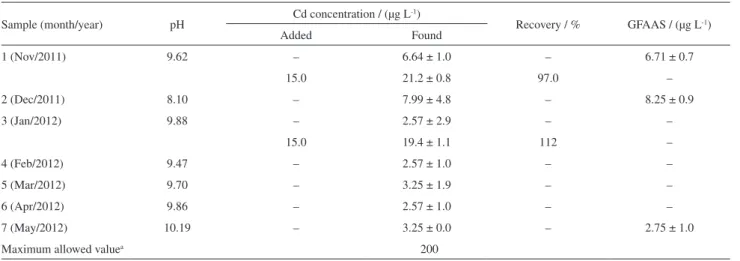
Table 6. Amount of Cd and pH in the leachate samples collected from the Jaguaquara Sanitary Landfill-BA
Sample (month/year) pH Cd concentration / (µg L -1)
Recovery / % GFAAS / (µg L-1)
Added Found
1 (Nov/2011) 9.62 – 6.64 ± 1.0 – 6.71 ± 0.7
15.0 21.2 ± 0.8 97.0 –
2 (Dec/2011) 8.10 – 7.99 ± 4.8 – 8.25 ± 0.9
3 (Jan/2012) 9.88 – 2.57 ± 2.9 – –
15.0 19.4 ± 1.1 112 –
4 (Feb/2012) 9.47 – 2.57 ± 1.0 – –
5 (Mar/2012) 9.70 – 3.25 ± 1.9 – –
6 (Apr/2012) 9.86 – 2.57 ± 1.0 – –
7 (May/2012) 10.19 – 3.25 ± 0.0 – 2.75 ± 1.0
Maximum allowed valuea 200
various metals in leachate samples from the sanitary landfill located at the north area of Porto Alegre city in Rio Grande do Sul State (Brazil), researchers have dosed the minimum and maximum levels of Cd from 0.003
to 2.0 mg L-1.33 In another work, Cd determinations of
leachate samples from a Polish landfill have dosed the
quantity at 9.0 mg L-1.22 Hence, when comparing the Cd
concentrations from the municipal sanitary landfill of Jaguaquara, Bahia, Brazil to the above-mentioned studies, it appears that the dosage levels were similar to or below those found by these researchers.
Conclusions
The results obtained from the determination of Cd on leachate samples have revealed that the optimized analytical methodology is feasible in the preconcentration of the metal of interest. The procedure has a good analytical performance, speed, simplicity, efficiency and it is inexpensive.
The response surface methodology associated with Doehlert design matrix has enabled a rapid and efficient optimization of the variables affecting the performance of the preconcentration system. The fit of polynomial functions by modeling tools, such as least squares regression and neural networks has allowed the description of data behavior in the studied experimental region as well as the determination of optimum values for the efficient execution of preconcentration. The fit carried out by the neural network had a better predictive ability, but the results relative to the optimum values found in both processes were similar. The procedure has exhibited excellent limits of detection and quantification; in other words, it has displayed the adequate sensitivity to determine such metal taking into account the complex matrix and concentrations at trace
levels (µg L-1). The use of UV radiation in the process of
sample digestion was seen to be the best suited and more reliable than digestion by heating in an open system. The sample concentrations digested with UV exhibited higher values in the analyte concentration. Such a technique is characterized by low cost, high efficiency and minimum risks of losses and contamination.
This study has also revealed that the Cd concentrations in the sanitary landfill of Jaguaquara-BA are below the limit established by the CONAMA resolution No. 430/2011. Finally, the environmental analysis is part of the initial record of Cd concentrations in effluents (leachate) originating from the landfill located at the southwest region of Bahia state, northeastern Brazil, and integrates the scientific base of information to support the design, management and monitoring of leachate treatment systems.
Acknowledgements
The authors acknowledge the financial support from Fundação de Amparo à Pesquisa do Estado da Bahia (Fapesb), Conselho Nacional de Desenvolvimento Científico e Tecnológico (CNPq) and Financiadora de Estudos e Projetos (FINEP).
References
1. Oliveira, F. J. S.; Jucá, J. F. T.; Rev. Bras. Eng. Agríc. Ambient.
2004, 9, 211.
2. Leite, C. M. B.; Bernardes, R. S.; Oliveira, S. A.; Rev. Bras.
Eng. Agríc. Ambient. 2004, 8, 111.
3. Agency for Toxic Substances and Disease Registry (ASTDR);
Toxicological Profile for Cadmium; ATSDR: Atlanta, 1997.
4. Duran, C.; Gundogdu, A.; Bulut, V. N.; Soylak, M.; Elci, L.; Senturk, H. B.; Tufekci, M.; J. Hazard. Mater. 2007, 146, 347. 5. Ghaedi, M.; Karami, B.; Ehsani, S.; Marahel, F.; Soylak, M.;
J. Hazard. Mater. 2009, 172, 802.
6. Morais, J. L.; Sirtori, C.; Peralta-Zamora, P. G.; Quim. Nova
2006, 29, 20.
7. Wang, B. S.; Lee, C. P.; Ho, T. Y.; Talanta 2014, 128, 337.
8. Ebrahimzadeh, H.; Tavassoli, N.; Sadeghi, O.; Amini, M. M.;
Talanta 2012, 97, 211.
9. Trujillo, I. S.; Alonso, E. V.; Torres, A. G.; Pavón, J. M. C.;
Microchem. J.2012, 101, 87.
10. Camel, V.; Spectrochim. Acta, Part B 2003, 58, 1177. 11. Santos, W. N. L.; Santos, C. M. C.; Ferreira, S. L. C.;
Microchem. J. 2003, 75, 211.
12. Bezerra, M. A.; Santelli, R. E.; Oliveira, E. P.; Villar, L. S.; Escaleira, L. A.; Talanta 2008, 76, 965.
13. Teixeira, L. S. G.; Bezerra, M. D.; Lemos, V. A.; dos Santos, H. C.; de Jesus, D. S.; Costa, A. C. S.; Sep. Sci. Technol. 2005,
40, 2555.
14. Cavicchioli, A.; Gutz, I. G. R.; Quim. Nova 2003, 26, 913. 15. Otto, M.; Chemometrics - Statistics and Computer Application
in Analytical Chemistry, 2nd ed.; Wiley-VCH: Weinheim, 2007.
16. http://old.iupac.org/publications/compendium/index.html accessed in August 2014.
17. International Conference on Harmonisation of Technical Requirements for Registration of Pharmaceuticals for Human Use (ICH); Validation of Analytical Methods: Definitions and
Terminology Q2A; ICH: London, 1995.
18. Gonzalez, A. G.; Herrador, M. A.; Asuero, A. G.; Talanta 1999,
48, 729.
19. Krug, F. J.; Métodos de Preparo de Amostras; Fundamentos Sobre Preparo de Amostras Orgânicas e Inorgânicas para Análise
Elementar; Copiadora Luiz de Queiroz: Piracicaba, 2008
21. Liu, Y.; Chang, X.; Wang, S.; Guo, Y.; Din, B.; Meng, S.; Anal. Chim. Acta 2004, 519, 173.
22. Karadas, C.; Turhan, O.; Kara, D.; Food Chem. 2013, 141, 655.
23. Behbahani, M.; Bagheri, A.; Amini, M. M.; Sadeghi, O.; Salarian, M.; Najafi, F.; Taghizadeh, M.; Food Chem. 2013,
141, 48.
24. Melek, E.; Tuzen, M.; Soylak, M.; Anal. Chim. Acta 2006, 578,
213.
25. Xie, F.; Lin, X.; Wu, X.; Xie, Z.; Talanta 2008, 74, 836.
26. Pourreza, N.; Mousavi, H. Z.; Anal. Chim. Acta 2004, 503, 279.
27. h t t p : / / w w w. m m a . g o v. b r / p o r t / c o n a m a / l e g i a b r e . cfm?codlegi=646 accessed in August 2014.
28. Celere, M. S.; Oliveira, A. S.; Trevilato, T. M.; Segura-Muñoz, S. I.; Cad. Saúde Pública 2007, 23, 939.
29. Christensen, T. H.; Kjeldsen, P.; Bjerg, P. L.; Jensen, D. L.; Christensen, J. B.; Baun, A.; Albrechtsen, H. J.; Heron, C.;
Appl. Geochem. 2001, 16, 659.
30. Cecen, F.; Gursoy, G.; J. Environ. Monit. 2000, 2, 436. 31. Westlake, K. In Waste Treatment and Disposal; Hester, R. E.;
Harrison, R. M., eds.; The Royal Society of Chemistry: Cambridge, 1995, ch. 3.
32. Kulikowska, D.; Klimiuk, E.; Bioresour. Technol. 2008, 99, 5981.
33. Kuajara, O.; Sanchez, J. C. D.; Ballestrin, R. A.; Teixeira, E. C.;
Water Environ. Res. 1997, 69, 1170.
Submitted: July 7, 2014