CPD
9, 2309–2356, 2013Holocene climate variability in the Winter Rainfall Zone
of South Africa
S. Weldeab et al.
Title Page
Abstract Introduction
Conclusions References
Tables Figures
◭ ◮
◭ ◮
Back Close
Full Screen / Esc
Printer-friendly Version
Interactive Discussion
Discussion
P
a
per
|
Dis
cussion
P
a
per
|
Discussion
P
a
per
|
Discussio
n
P
a
per
|
Clim. Past Discuss., 9, 2309–2356, 2013 www.clim-past-discuss.net/9/2309/2013/ doi:10.5194/cpd-9-2309-2013
© Author(s) 2013. CC Attribution 3.0 License.
Open Access
Climate of the Past
Discussions
Geoscientiic Geoscientiic
Geoscientiic Geoscientiic
This discussion paper is/has been under review for the journal Climate of the Past (CP). Please refer to the corresponding final paper in CP if available.
Holocene climate variability in the
Winter Rainfall Zone of South Africa
S. Weldeab1, J.-B. W. Stuut2,3, R. R. Schneider4, and W. Siebel5
1
Department of Earth Science, University of California, Santa Barbara, CA 93106-9630, USA
2
NIOZ, Royal Netherlands Institute for Sea Research, Texel, The Netherlands
3
MARUM, Center for Marine Environmental Sciences, University of Bremen, Bremen, Germany
4
Institute of Geosciences, University of Kiel, Kiel, Germany
5
Department of Geosciences, University of T ¨ubingen, T ¨ubingen, Germany
Received: 11 March 2013 – Accepted: 27 March 2013 – Published: 7 May 2013
Correspondence to: S. Weldeab ([email protected])
CPD
9, 2309–2356, 2013Holocene climate variability in the Winter Rainfall Zone
of South Africa
S. Weldeab et al.
Title Page
Abstract Introduction
Conclusions References
Tables Figures
◭ ◮
◭ ◮
Back Close
Full Screen / Esc
Printer-friendly Version
Interactive Discussion
Discussion
P
a
per
|
Dis
cussion
P
a
per
|
Discussion
P
a
per
|
Discussio
n
P
a
per
|
Abstract
We established a multi-proxy time series comprising analyses of major elements in
bulk sediments, Sr and Nd isotopes and grain size of terrigenous fraction, and δ18O
andδ13C in tests ofNeogloboquadrina pachyderma(sinistral) from a marine sediment
sequence recovered offthe Orange River. The records reveal coherent patterns of
vari-5
ability that reflect changes in wind strength, precipitation over the river catchments, and
upwelling of cold and nutrient-rich coastal waters offwestern South Africa. The wettest
episode of the Holocene in the Winter Rainfall Zone (WRZ) of South Africa occurred during the “Little Ice Age” (700–100 yr BP). Wet phases were accompanied by strength-ened coastal water upwellings, a decrease of Agulhas water leakage into the southern
10
Atlantic, and a reduced dust incursion over Antarctica. A continuous aridification trend in the WRZ and a weakening of the southern Benguela Upwelling System (BUS) be-tween 9000 and 5500 yr BP parallel with increase of dust deposition over Antarctica and an enhanced leakage of warm Agulhas water into the southeastern Atlantic. The tem-poral relationship between precipitation changes in the WRZ, the thermal state of the
15
coastal surface water, and leakage of warm water in southern Atlantic, and variation of dust incursion over Antarctica suggests a causal link that most likely was related to lat-itudinal shifts of the Southern Hemisphere westerlies. Our results of the mid-Holocene time interval may serve as an analogue to a possible long-term consequence of the current and future southward shift of the westerlies that may result in a decline of
rain-20
fall over southwest Africa and a weakened upwelling with implication for phytoplankton productivity and fish stocks. Furthermore, warming of the coastal surface water as a
result of warm Agulhas water incursion into the southern BUS may affect coastal fog
CPD
9, 2309–2356, 2013Holocene climate variability in the Winter Rainfall Zone
of South Africa
S. Weldeab et al.
Title Page
Abstract Introduction
Conclusions References
Tables Figures
◭ ◮
◭ ◮
Back Close
Full Screen / Esc
Printer-friendly Version
Interactive Discussion
Discussion
P
a
per
|
Dis
cussion
P
a
per
|
Discussion
P
a
per
|
Discussio
n
P
a
per
|
1 Introduction
Instrumental and modeling data indicate that the southward displacement of austral westerlies and increased amount of leakage of warm, saline Agulhas water into the southern Atlantic may have a negative impact on the Winter Rainfall Zone (WRZ) of South Africa and weaken the southern BUS (Biastoch et al., 2008, 2009; Lutjeharms
5
et al., 2001; MacKellar et al., 2007; Hardman-Mountford et al., 2003). Paleoclimate records can provide insights that may help to assess the long-term impact of such ocean-atmosphere changes. However, conventional terrestrial climate archives such as lake and cave deposits are sparse in arid and semi-arid regions, limiting a dense spatio-temporal coverage and multi-proxy approach of climate reconstructions, a
pre-10
requisite to gaining a better understanding of regional climate variability and its link to large-scale atmosphere–ocean climate coupling. The coastal area of southwest Africa is located in the semi-arid ecosystem (MacKellar et al., 2007 and reference therein), and our knowledge of past climate variability so far has relied on a few low-resolved proxy records. The emergence of new climate archives and proxies such as hyrax
15
dung and optically stimulated luminescence dating have led to relatively more spatio-temporal coverage of paleoclimate information for southwest Africa (Chase et al., 2009, 2011; Chase and Thomas, 2006, 2007; Meadows et al., 2010; Meadows and Sugden, 1991; Scott and Woodborne, 2007a, b). These records, along with the most recent high-resolution climate reconstruction of the Late Holocene from the western coastal
20
area of South Africa (Benito et al., 2011; Stager et al., 2012), reveal that the WRZ of South Africa was very sensitive to centennial- and millennial-scale climate oscillations during the Holocene epoch. Notwithstanding the increasing number of paleo-records, the regional significance of and temporal correlation between the local climate signals and their link to surface water conditions of the adjacent ocean remain uncertain. Our
25
CPD
9, 2309–2356, 2013Holocene climate variability in the Winter Rainfall Zone
of South Africa
S. Weldeab et al.
Title Page
Abstract Introduction
Conclusions References
Tables Figures
◭ ◮
◭ ◮
Back Close
Full Screen / Esc
Printer-friendly Version
Interactive Discussion
Discussion
P
a
per
|
Dis
cussion
P
a
per
|
Discussion
P
a
per
|
Discussio
n
P
a
per
|
Hemisphere westerlies and the leakage of warm Agulhas water into the southeastern Atlantic.
2 Regional setting
The Winter Rainfall Zone (WRZ) of southwestern Africa stretches along the south-eastern Atlantic coastal region from southwestern Namibia to Cape Agulhas and
ex-5
tends inland to the western margin of the Great Escarpment (Chase and Meadows,
2007; MacKellar et al., 2007) (Fig. 1). The WRZ receives<65 % of the annual
rain-fall during the austral winter, and consists of arid and semi-arid regions including the southern Namib Desert and the Namaqualand of South Africa (Chase and Meadows, 2007; MacKellar et al., 2007; Cowling et al., 1999). Along the coastal area, precipitation
10
varies between 50 mm and 350 mm per year with marked local patterns (MacKellar et al., 2007).
The Namaqualand borders on dynamic coastal waters that are marked by inner-shelf upwellings that prevail throughout the year with enhanced intensity during the austral winter (Hardman-Mountford et al., 2003). This upwelling area constitutes the southern
15
BUS whose intensity is driven by the strength and position of the southeasterly trade winds (Hardman-Mountford et al., 2003). On average, sea surface temperature and
salinity account for 13.5◦C and 35 practical salinity unit (psu) during the austral winter
and 16.9◦C and 34.9 psu during the austral summer (Locarnini et al., 2010). Within
the southern BUS, localized cells of strong upwelling exist, including the Namaqua
20
cell (Hardman-Mountford et al., 2003) from which the GeoB8332-4 was recovered. On interannual and interdecadal time scales, a weakening of the southern BUS occurs in response to a southward shift of the austral westerlies that allows the intrusion of warm Agulhas surface water into the southeastern Atlantic (Hardman-Mountford et al., 2003; Biastoch et al., 2009).
25
CPD
9, 2309–2356, 2013Holocene climate variability in the Winter Rainfall Zone
of South Africa
S. Weldeab et al.
Title Page
Abstract Introduction
Conclusions References
Tables Figures
◭ ◮
◭ ◮
Back Close
Full Screen / Esc
Printer-friendly Version
Interactive Discussion
Discussion
P
a
per
|
Dis
cussion
P
a
per
|
Discussion
P
a
per
|
Discussio
n
P
a
per
|
River, the Namaqualand, and the Namib Desert. The mudbelt is a prominent Holocene sediment package that covers a narrow strip along the inner-shelf between the Kunene River in the northwest and St. Helena Bay in the southeast (Compton et al., 2009, 2010; Herbert and Compton, 2007; Meadows et al., 2002; Rogers and Rau, 2006).
The Orange River presents the most dominant sediment source for the mudbelt with
5
catchment area of 973 000 km2, runoff of 11 km3yr−1, and 60 million metric tons yr−1
delivery of sediment (Bremner et al., 1990). Most of the Orange River runoffand
sus-pended sediment comes from the easternmost catchment that receives an annual
rain-fall between 500 mm and >750 mm during austral summer (Compton et al., 2010)
(Fig. 1). Detailed mineralogical, chemical, and isotopic evidence indicates that the
10
suspended sediments of Orange River mainly originate from the upper part of Ka-roo Supergroup (Late Triassic continental sedimentary rocks) (Compton and Maake, 2007; de Villiers et al., 2000). The Drakensberg Plateau, which is composed of flood
basalt intersected by dolerite dykes/sills, receives high precipitation (>750 mm yr−1),
but contributes relatively small amounts to the total sediment load of the Orange River
15
(Compton and Maake, 2007; de Villiers et al., 2000). Once it enters the Atlantic Ocean, waves and undercurrent distribute the massive sediment load of the Orange River. The sand fraction is swept northward by wave-driven littoral drifts (Meadows et al., 2002; Rogers and Rau, 2006). Northwesterly undercurrents distribute clayey-silty material to the southeast of the Orange River mouth, with decreasing grain size toward the
south-20
eastern end of the mudbelt (Meadows et al., 2002; Rogers and Rau, 2006).
Ephemeral (Holgat and Buffels) and perennial (Olifants and Berg) rivers drain the
western coastal area of South Africa (Fig. 1) that consists of Precambrian sedimentary
rocks (>2.5 billion years (Ga) old) and intrusions of 1 Ga granite and gneiss (Cowling
et al., 1999). With a total catchment area of ∼65 200 km2 and an arid/semi-arid
cli-25
CPD
9, 2309–2356, 2013Holocene climate variability in the Winter Rainfall Zone
of South Africa
S. Weldeab et al.
Title Page
Abstract Introduction
Conclusions References
Tables Figures
◭ ◮
◭ ◮
Back Close
Full Screen / Esc
Printer-friendly Version
Interactive Discussion
Discussion
P
a
per
|
Dis
cussion
P
a
per
|
Discussion
P
a
per
|
Discussio
n
P
a
per
|
sequences recovered from the immediate vicinity of local river mouths (Mabote, 1997; Rogers and Rau, 2006). The significance of eolian sediment inputs to the mudbelt from dust originating from the Namib Desert and the Namaqualand has been recognized by several studies (Mabote, 1997; Rogers and Rau, 2006; Shannon and Anderson,
1982) and is estimated to account for 7–10 g m−2yr−1 of the Orange and Holgat River
5
sediment load (Mahowald et al., 2005). In the Namaqualand, the dust is mobilized by the katabatic winds (locally called Bergwinds) (Mabote, 1997; Rogers and Rau, 2006; Shannon and Anderson, 1982).
Overall, the complex depositional setting of our core site arises not only due to river-ine and dust inputs from proximal and distal catchments within the Winter and Summer
10
Rainfall zones, but also sediment redistribution and sorting by bottom water currents. We employ a multi-proxy approach to shed light on the Holocene climate imprint in the
sediment sequence offthe Holgat River. We use grain size and element ratios data to
reconstruct the variation of riverine and eolian inputs. While the analysis of Nd and Sr isotope ratios is used to track changes in the source of riverine and eolian sediments,
15
we useδ18O and δ13C in the planktonic foraminiferaNeogloboquadrina pachyderma
to understand the surface conditions of the coastal water.
3 Material and methods
Our study focuses on sediment core GeoB8332-4 recovered within the mudbelt
(29◦07.66′S, 16◦39.57′E, water depth 117 m), approximately 10 and 57 km off the
20
Holgat and Orange Rivers, respectively (Fig. 1). The down core measurements are complemented by analysis of sediments collected from riverbeds and suspended
sed-iment of the Orange River and local Holgat, Buffels, and Olifants Rivers (Fig. 1). The
GeoB8332-4 sediment sequence consists of a monotonous dark greenish-gray mud
that is slightly bioturbated and had a strong H2S odor at time of the recovery.
On-25
CPD
9, 2309–2356, 2013Holocene climate variability in the Winter Rainfall Zone
of South Africa
S. Weldeab et al.
Title Page
Abstract Introduction
Conclusions References
Tables Figures
◭ ◮
◭ ◮
Back Close
Full Screen / Esc
Printer-friendly Version
Interactive Discussion
Discussion
P
a
per
|
Dis
cussion
P
a
per
|
Discussion
P
a
per
|
Discussio
n
P
a
per
|
core terminates at a sediment depth of 808 cm with a sediment layer that is rich in gastropod and bivalve shells. Throughout the sediment sequence, several intact and well-preserved shells of small gastropods and bivalves were found. Due to the low
abundance of foraminifera we used gastropod shells for14C dating.
The age model of GeoB8332-4 sediment is based on 15 radiocarbon datings of small
5
well-preserved gastropod shells (Nassarius vinctus, personal communication with John
Compton, 2004). Prior to the selection for14C dating, the gastropod shells were
care-fully inspected for signs of corrosion and fragmentation that could be indicative of trans-port by waves and currents. To our best judgment, the gastropods we used for dating are autochthonous. The absence of age reversals in the densely dated sections and
10
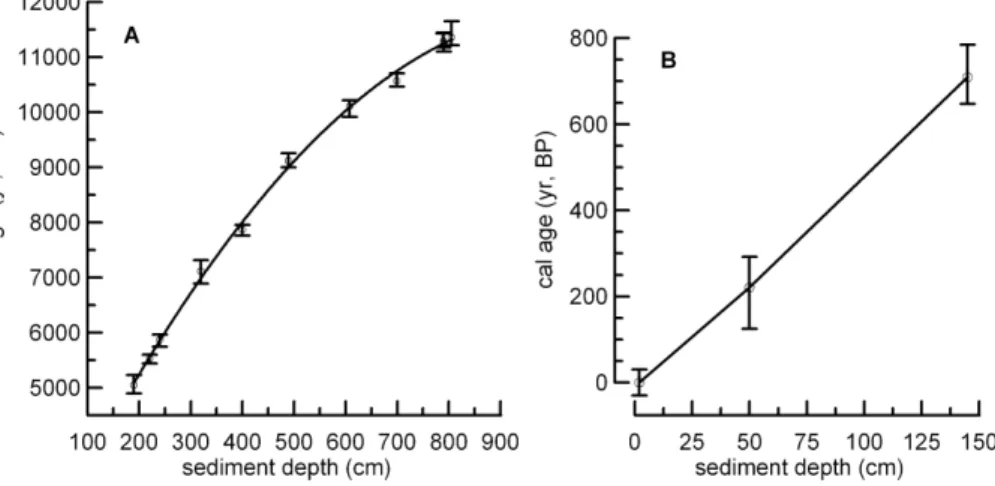
replicated measurements support the autochthonous origin of the gastropod samples (Fig. 2 and Table 1). Radiocarbon measurements were conducted at the Leibniz
Insti-tute for Radiometric Dating and Isotope Research in Kiel, Germany. The14C data
re-veal that the GeoB8332-4 sediment sequence contains a highly resolved climate record of the Early to Middle Holocene (11 500–5000 cal. yr BP) and the last 700 yr BP.
Un-15
fortunately, a hiatus covers the interval between 5000 and 700 yr BP. Nonetheless, the late and early-middle Holocene record provides detailed insights into climate variability
of southwestern Africa. The14C data were converted to calendar ages using CALIB
software (Stuiver and Reimer, 1993) (version 6.10), Marine data set 2009 (Reimer et
al., 2009), and∆R of 129±19 yr reservoir age of the local coastal water (Sealy et al.,
20
2013). The final age model is established using polynomial (11 500–5000 yr BP) and linear (700–0 yr BP) equations describing the relationship between sediment depth and calendar ages (Fig. 2).
Prior to the grain-size analysis of the terrigenous fraction, we removed the biogenic fraction from GeoB8332-4 sediment samples. Organic matter and carbonate
compo-25
nents were removed by adding 10 mL of H2O2(35 %) and 100 mL HCl (1 %) to 750 mg
CPD
9, 2309–2356, 2013Holocene climate variability in the Winter Rainfall Zone
of South Africa
S. Weldeab et al.
Title Page
Abstract Introduction
Conclusions References
Tables Figures
◭ ◮
◭ ◮
Back Close
Full Screen / Esc
Printer-friendly Version
Interactive Discussion
Discussion
P
a
per
|
Dis
cussion
P
a
per
|
Discussion
P
a
per
|
Discussio
n
P
a
per
|
in 100 mL deionized water were added to the sediment and the mixture was boiled for 10 min. The solution was diluted with deionized water to neutral pH. Prior to grain-size analysis, the remaining terrigenous fraction was boiled with 300 mg of soluble sodium
pyrophosphate (Na4P2O7.10H2O) to foster particle disaggregation. Grain-size analysis
was performed using a Coulter laser particle sizer LS200. The analysis resulted in 92
5
size classes varying from 0.39 to 2000 µm. An end-member modeling algorithm was applied to determine the proportions of distinct sediment components contributing to the measured particle size signal (Weltje, 1997; Stuut et al., 2002) (Fig. 3a–e). The
algorithm output is a series of models, each containing a different number of
“end-members”, and each model explaining a different amount of variance. The higher the
10
number of end-members the more variance is explained (Fig. 3d). Two key parameters are used to determine the minimum number of end-members required for a satisfac-tory approximation of the measured data (Prins et al., 2000; Stuut et al., 2002; Weltje,
1997). First, the coefficient of determination per size class (r2) is used to assess how
well the model reproduces the data in each size class (Fig. 3c). Second, the mean
15
coefficient of determination (rmean2 ) averaged for all size classes is used to test how
well each model reproduces the average of all measured size classes (Fig. 3d). In this study, the model with a minimum number of 3 end-members (EM1, EM2, and EM3),
withr2>0.5 andrmean2 equal to 0.79 represents the best compromise (Fig. 3).
Time series of major element intensities were generated at 1 cm sampling interval
20
using the Aavatech XRF Scanner I at the University of Bremen. The Core Scanner was run with an excitation potential of 10 kV, a current of 250 µA, and 30 s counting time. Element intensities were normalized by dividing the total counts for each element by the sum of total counts for all measured elements. In this study we focus only on Ca/Al, K/Al and Ti/Al ratios (Fig. 4).
25
We analysed δ18O and δ13C in tests of Neogloboquadrina pachyderma (sinistral)
(125–300 µm) from down core samples using a Thermo MAT 253 mass spectrometer at the first author’s stable isotope lab at UCSB. The mass spectrometer is coupled
CPD
9, 2309–2356, 2013Holocene climate variability in the Winter Rainfall Zone
of South Africa
S. Weldeab et al.
Title Page
Abstract Introduction
Conclusions References
Tables Figures
◭ ◮
◭ ◮
Back Close
Full Screen / Esc
Printer-friendly Version
Interactive Discussion
Discussion
P
a
per
|
Dis
cussion
P
a
per
|
Discussion
P
a
per
|
Discussio
n
P
a
per
|
reacted by automated individual phosphoric acid addition. Results were corrected us-ing NBS19 standard and are reported on the Peedee Belemnite (PDB) scale. Estimates
for standard error (2σ) in the δ18O andδ13C measurements are better than ±0.07 ‰
and±0.03 ‰, respectively.
Analyses of the87Sr/86Sr and143Nd/144Nd ratios on the lithogenic fraction (≤120 µm)
5
of marine and riverine sediments were conducted on a Finnigan MAT 262 mass spec-trometer using static collection mode at the Institute of Geosciences, University of T ¨ubingen. In order to remove the carbonate fractions of down core samples, 500 mg of sediment was leached with 10 mL acetic acid (5 M) at room temperature for 12 h. The detrital residues were rinsed four times with ultrapure water, centrifuged, and
10
the supernatant was removed. A 50-mg portion of the powdered and homogenized
lithogenic fraction was spiked with a mixed149Sm:150Nd spike prior to digestion in HF.
The digested samples were dried and dissolved in 6 N HCl, dried and then redis-solved in 2.5 N HCl. Analyses of NBS-SRM 987 and La Jolla Nd standards during this
study yielded an average value of 87Sr/86Sr = 0.710244±15 and for 143Nd/144Nd =
15
0.511823±15, respectively.87Sr/86Sr ratios are normalized to86Sr/88Sr=0.1194 and
the 143Nd/144Nd ratios to 146Nd/144Nd=0.7219. Results of Nd and Sr in blank
mea-surements are 80 pg and 65 pg, respectively. The143Nd/144Nd ratios are expressed as
εNd, whereεNd is the analyzed143Nd/144Nd ratio normalized to the “chondritic uniform
reservoir” value (0.512638, (Jacobson and Wasserburg, 1980).
20
4 Results
4.1 Variations of terrigenous particle size
The particle size frequency distribution shows a bi-modal distribution pattern (Fig. 3a). The time series of the median grain size is marked by a continuous increase of par-ticle size from the early to middle Holocene and declining trends between 5500 and
25
CPD
9, 2309–2356, 2013Holocene climate variability in the Winter Rainfall Zone
of South Africa
S. Weldeab et al.
Title Page
Abstract Introduction
Conclusions References
Tables Figures
◭ ◮
◭ ◮
Back Close
Full Screen / Esc
Printer-friendly Version
Interactive Discussion
Discussion
P
a
per
|
Dis
cussion
P
a
per
|
Discussion
P
a
per
|
Discussio
n
P
a
per
|
technique to narrow down the number of dominant end-members to three that suffi
-ciently explain the variability of the median grain size throughout the investigated time
intervals (Fig. 3b and e). End-member 3 (EM3) has a modal grain size value of∼5 µm
and its temporal variability is characterized by a continuous decline from the early to middle Holocene (Fig. 3b). In contrast, the fraction of EM3 shows a continuous increase
5
over the last 700 yr BP, explaining up to 90 % of the median grain size variability.
Pro-nounced changes in EM2 with a modal value of ∼10 µm are most evident between
7500 and 5500 yr BP and between 400 and 150 yr BP, and both periods are
charac-terized by a decrease in medium grain size. The modal grain size of EM1 is∼20 µm
and reveals a large increase between 9250 and 6500 yr BP, followed by a sharp
de-10
cline between 5500 and 5000 yr BP and 700 and 150 yr BP. Comparing the trends and magnitude of changes in the end-members with those of the median grain size, it is evident that during the early and middle Holocene changes occurred primarily due to variations of EM1 and EM2 fractions. In contrast, during the last 700 yr, changes in EM3 dominantly shaped the marked decline in the median grain size.
15
The main sources and transport mechanisms that can affect temporal grain size
vari-ation over the core site are changes in riverine sediment supply, dust input, changes in sea level, and shift of depocenter. Divergent trends of sedimentation rate and changes in median grain size indicate that the variation of the latter is most likely not associ-ated with shifts of a depocenter (Fig. 3). Furthermore, with the exception of the early
20
Holocene, regional sea level changes (Compton, 2001) and sedimentation rate seem unrelated, with sea level rise and EM1 increase during middle Holocene (8–6.5 kyr BP) and increase in EM3 and sea level rise during the last 700 yr BP (Compton, 2001). Grain size analysis of suspended particles collected from the main tributaries of the
Orange River shows∼10 % clay (<2 µm),∼70 % fine silt (2–38 µm),∼15 % coarse
25
silt (38–63 µm), and∼5 % sand (>63 µm) (Compton and Maake, 2007). The sand and
CPD
9, 2309–2356, 2013Holocene climate variability in the Winter Rainfall Zone
of South Africa
S. Weldeab et al.
Title Page
Abstract Introduction
Conclusions References
Tables Figures
◭ ◮
◭ ◮
Back Close
Full Screen / Esc
Printer-friendly Version
Interactive Discussion
Discussion
P
a
per
|
Dis
cussion
P
a
per
|
Discussion
P
a
per
|
Discussio
n
P
a
per
|
is too weak to carry sand and coarse silt frations, it transports the fine silt and clay components of the Orange sediment load to the southeastern segment of the mudbelt (Mabote, 1997; Rogers and Rau, 2006). Our core site is located 57 km away from the delta of the Orange River (Fig. 1), and the median grain size of the core top samples (100–200 yr BP) shows value of 4 µm, a sedimentation rate of 2 mm per year, and
5
EM3 and EM2 explaining more than 97 % of the grain size variation. This observation
shows that only the fine fraction (≤10 µm) of Orange River sediment arrive at our core
site. Based on the dominance of the fine fraction, we hypothesize that EM3 presents a fluvial component, an assumption that is supported by the element ratios and isotope signatures shown below.
10
Dust input from the Namib Desert and the Namaqualand presents an important sed-iment source for the southeastern Atlantic and the mudbelt (Mabote, 1997; Shannon and Anderson, 1982; Stuut et al., 2002; Mahowald et al., 2005). A model based study
estimates that dust deposition offthe Holgat River accounts for 7–10 g m−2yr−1
(Ma-howald et al., 2005) for which no grain size analysis is available. Analysis of grain size
15
of dust collected above the Walvis Ridge (Stuut et al., 2002) shows a broad uni-modal distribution with a modal value of 20 µm that is very similar to that of EM1 (Fig. 3e). Due to the proximity of the dust source to our core site, it is most likely that an enhanced dust deposition leads to an increase of grain size. In our time series, EM1 presents the end-member with the largest model grain size of 20 µm. EM1 and and EM2 increased
20
significantly during the mid Holocene. Based on the proximity of the dust sources to our core site and the weak bottom water current, we hypothesize that EM1 reflects sediment largely related to dust input. Following the approach described by Stuut et
al. (2002, 2004), we calculated indices for relative humidity (EM3/(EM1+EM2+EM3)
and wind strength changes (EM1/(EM1+EM2) throughout investigated time interval
25
(see discussion section).
CPD
9, 2309–2356, 2013Holocene climate variability in the Winter Rainfall Zone
of South Africa
S. Weldeab et al.
Title Page
Abstract Introduction
Conclusions References
Tables Figures
◭ ◮
◭ ◮
Back Close
Full Screen / Esc
Printer-friendly Version
Interactive Discussion
Discussion
P
a
per
|
Dis
cussion
P
a
per
|
Discussion
P
a
per
|
Discussio
n
P
a
per
|
increase of grain size, it requires additional insights from the radiogenic and element record that is described below.
4.2 Variation of selected major elements
Figure 4 shows down core variation of Ca/Al, K/Al, and Ti/Al intensity ratios. Ca/Al pri-marily reflects changes in biogenic carbonate and shows that carbonate productivity
5
was relatively high between 11 500 and 6750 yr BP, followed by a continuous decline. We focus on K/Al and Ti/Al to address changes in terrigenous input and to infer pos-sible weathering and transport mechanisms. On millennial scale, K/Al ratios show a continuous decline starting from 11 500 to 6000 yr BP. An increasing K/Al trend is ev-ident between 5500 and 5000 yr BP and during the last 700 yr BP. A millennial-scale
10
trend in Ti/Al reveals increasing values from the early to middle Holocene and declining values from 6500 to 5000 yr BP as well as from 700 to 100 yr BP. Overall,
millennial-scale trends in K/Al and Ti/Al ratios evolve in divergent directions, indicating different
sources, weathering, or transport mechanisms. Clay mineralogical and chemical anal-yses of soil and suspended sediments in the catchment of the Orange River reveal
15
that erosion products of the Karoo Supergroup series (Tertiary sedimentary rocks) are rich in illite, K-feldspar, smectite and show high K concentration (Compton and Maake, 2007). Furthermore, erosion products of the Karoo Supergroup series present the dom-inant fraction in the suspended sediment of the Orange River (Compton and Maake, 2007). Within the mudbelt between the Orange and the Olifants Rivers, concentration
20
of K shows an increasing trend with low K values in the north (relatively proximal to the Orange River) as compared to those in the south (Govin et al., 2012). This distribution pattern arises due to grain size sorting by bottom currents, with coarse sediments in the north and predominantly clayey sediments in the south (Rogers and Rau, 2006). We suggest that temporal K/Al variation within our site indicates changes in K-rich fine
sed-25
CPD
9, 2309–2356, 2013Holocene climate variability in the Winter Rainfall Zone
of South Africa
S. Weldeab et al.
Title Page
Abstract Introduction
Conclusions References
Tables Figures
◭ ◮
◭ ◮
Back Close
Full Screen / Esc
Printer-friendly Version
Interactive Discussion
Discussion
P
a
per
|
Dis
cussion
P
a
per
|
Discussion
P
a
per
|
Discussio
n
P
a
per
|
inputs, whereas riverine suspended and surface sediments offlarge river systems show
low Ti/Al (Govin et al., 2012). Consistent with the Atlantic-wide pattern, Ti analysis in surface sediments of the mudbelt show a lower Ti concentration in sites relatively prox-imal to the Orange River outflow as compared to Ti value obtained in surface sediment of the southern mudbelt (Govin et al., 2012). The distribution pattern of Ti within the
5
mudbelt between the Orange and Olifants Rivers (Govin et al., 2012) corresponds with the abundance of ilmenite, a Ti-bearing heavy mineral, whose abundance increases in the central and southern mudbelt (Rogers and Rau, 2006), indicating the ilmenite predominantly stems from local sources. Therefore, we argue that relatively high Ti/Al values and concomitant increase of grain size during the mid Holocene indicates
in-10
creased sediment input due to enhanced dust mobilization in Namaquland. In contrast, high K/Al paralleled by decrease in grain size indicates increased fluvial inputs from local and Orange Rivers. Emphasing that the Orange River is the most dominant sedi-ment source for the mudbelt, changes in fluvial sedisedi-ment supply from the coastal areas can be identified by its radiogenic isotope signatures.
15
4.3 Radiogenic isotope signature of the terrigenous sediments
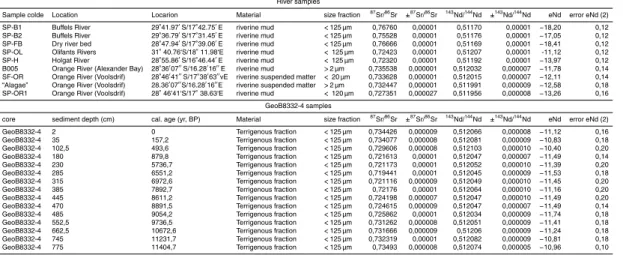
Sr and Nd isotope signatures of terrigenous components in marine sediments provide a useful tool to assess sediment sources and transport mechanism (Bayon et al., 2003; Grousset and Biscaye, 2005; Weldeab et al., 2002a, b, 2011; Meyer et al., 2011). We established a low-resolution time series of Sr and Nd isotopes in core GeoB8332-4.
20
We also conducted Nd and Sr isotope analysis of suspended and riverbed sediments from the Orange River and ephemeral rivers in the coastal area (Figs. 1, 4c–d, and 5). Suspended and riverbed sediments of the Orange River that were collected at
Alexan-der Bay and Vioolsdrift (Fig. 1) show average values of87Sr/86Sr=0.73224±0.0016
(n=4) and εNd=−11.04±1.98 (n=4). We note that dissolved Sr isotope values in
25
water from the Caledon River (a tributary of the Orange River) and the Upper Orange
River are much lower showing average87Sr/86Sr values of 0.708 and 0.713,
CPD
9, 2309–2356, 2013Holocene climate variability in the Winter Rainfall Zone
of South Africa
S. Weldeab et al.
Title Page
Abstract Introduction
Conclusions References
Tables Figures
◭ ◮
◭ ◮
Back Close
Full Screen / Esc
Printer-friendly Version
Interactive Discussion
Discussion
P
a
per
|
Dis
cussion
P
a
per
|
Discussion
P
a
per
|
Discussio
n
P
a
per
|
the water of the Vaal River (a major tributary of the Orange River) show, on average,
a87Sr/86Sr ratio of 0.731 (de Villiers et al., 2000). This observation shows that more
work is needed to decipher which minerals present the main source for dissolved Sr and which isotope values characterize suspended sediment loads in the main
tribu-taries of the Orange River. Nonetheless, we argue that87Sr/86Sr signatures of∼0.73
5
for suspended sediments in the Lower Orange River together with anεNd signature of
=−9.19±1.45 (n=3) from Beaufort Group shales which form the upper portion of the
Karoo Supergroup (Dia et al., 1990) may represent integrated isotope signatures for
suspended sediments of the Orange River (Fig. 5). Average values of 0.75318±0.02
(n=4) and −16.9±2.05 (n=4) for 87Sr/86Sr and εNd signatures characterize
river-10
bed sediments from the local rivers (Figs. 1 and 5, Table 2). We exclude the87Sr/86Sr
andεNd values of Olifants River (Fig. 1 and Table 2) because we suspect that the
sam-pling site is influenced by tide-mobilized sediments from the shallow water. A third sed-iment source is dust input from the Namib Desert. Analysis of Namib Desert dust
sam-ples (Grousset et al., 1992) shows average87Sr/86Sr andεNd value of 0.72232±0.003
15
(n=8) and−8.64±3.24, (n=8), respectively
87
Sr/86Sr and εNd values in the time series of the sediment core vary between
0.73493 and 0.719441 and−10.39 and−11.74, respectively. The down-core variation
of Nd isotope values is relatively small due to the dominance of Orange River sedi-ments (Figs. 4 and 5). It is also important to note that changes in grain size have an
20
effect on the87Sr/86Sr signature (Eisenhauer et al., 1999; Meyer et al., 2011). Because
the down core record reveals significant grain size variation (Fig. 3b), the time series
of87Sr/86Sr likely harbors an imprint of grain size changes. Therefore we emphasize
that the assessment of changes in source or transport mechanism is best achieved by combining the results of all proxy parameters. Consistent with the time series of
25
median grain size and K/Al (Figs. 3b and 4f), the radiogenic isotope signatures show
a trend that is marked by decreasing87Sr/86Sr ratios and εNd values during the early
Holocene (11 600 to 9000 yr BP). During the middle Holocene,87Sr/86Sr ratios continue
CPD
9, 2309–2356, 2013Holocene climate variability in the Winter Rainfall Zone
of South Africa
S. Weldeab et al.
Title Page
Abstract Introduction
Conclusions References
Tables Figures
◭ ◮
◭ ◮
Back Close
Full Screen / Esc
Printer-friendly Version
Interactive Discussion
Discussion
P
a
per
|
Dis
cussion
P
a
per
|
Discussion
P
a
per
|
Discussio
n
P
a
per
|
of the Early Holocene (9000 yr BP). In contrast, the youngest time interval (700–0 BP)
reveals increasing87Sr/86Sr ratios and decreasingεNd values parallel to an increase
in fluvial sediment supply, as suggested by the decrease in median grain-size, increase of EM3 and K/Al ratio (Fig. 3).
On the basis of the temporal patterns depicted in Figs. 4c–d and 5, the following
5
relationship emerges between down-core variability of Sr and Nd isotopes and
possi-ble shifts in main sediment sources: from the early to middle Holocene,87Sr/86Sr and
εNd values decline from 0.7336±0.0018 (n=2) to 0.7242±0.0042 (n=9) and from
−10.88±0.11 (n=2) to −11.44±0.16 (n=9), respectively. Concomitant increase in
median grain size in the terrigenous sediments may have contributed to the relatively
10
large decline in the87Sr/86Sr ratio. High Ti/Al values and the dominance of EM1 with
a modal grain size of∼20 µm correspond with the changes in the Sr and Nd isotopes.
This suggests an enhanced influence of eolian input or coarse fluvial sediment input from the Holgat River during the middle Holocene. However, the relatively low sedi-mentation rate and low K/Al ratio argue against increased fluvial influence. From 700 yr
15
BP toward the core top,87Sr/86Sr andεNd reveal increasing and declining values,
re-spectively. This trend is accompanied by changes in median grain size from coarse to fine silt and clay, an increase in the K/Al, and a decrease in Ti/Al. Changes in all parameters thus indicate increase of river sediment supply over the last 700 yr. More
important, the negative trend inεNd and an increase in 87Sr/86Sr suggest a relative
20
increase of sediment input from the local rivers.
4.4 δ18O andδ13C in tests of Neogloboquadrina pachyderma (sinistral)
The results ofδ18O andδ13C analysis in tests ofNeogloboquadrina pachyderma
(sinis-tral) are shown in Fig. 4a and b. The long-term carbon isotope trend is marked by an
increase of δ13C from an average value of −1.1±0.17 (n=55) between 10 800 and
25
7000 yr BP to−0.54±0.19 (n=21) between 6800 and 5100 yr BP. On average, a
de-creasing trend inδ13C is evident in the youngest section of the record (100–700 yr BP),
CPD
9, 2309–2356, 2013Holocene climate variability in the Winter Rainfall Zone
of South Africa
S. Weldeab et al.
Title Page
Abstract Introduction
Conclusions References
Tables Figures
◭ ◮
◭ ◮
Back Close
Full Screen / Esc
Printer-friendly Version
Interactive Discussion
Discussion
P
a
per
|
Dis
cussion
P
a
per
|
Discussion
P
a
per
|
Discussio
n
P
a
per
|
Changes in the isotope signature of dissolved inorganic carbon (DIC) and its man-ifestation in the carbon isotope composition of planktonic foraminiferal tests can be influenced by several processes. Due to the hydrographic, bathymetric, and
deposi-tional setting of our core site, a relatively low organic matter burial efficiency coupled
with suspension and vertical mixing by bottom currents and internal waves (Compton
5
et al., 2009), and ensuing demineralization of organic matter may present a source of DIC variability. Estimates of particulate and dissolved organic matter from the Orange
River entering the delta system, on average, account for 62 000 ton yr−1, and
approx-imately half of this amount is buried in the subaqueous delta plains (Compton et al.,
2009). δ13C values of organic matter in soil and suspended matter in the catchment
10
and tributaries of the Orange River cover a wide range, varying between −12.7 and
−21.5 ‰ (Compton and Maake, 2007). In contrast, measurements of δ13C in organic
matter along the mudbelt show rapidly decreasingδ13C values away from riverine
in-fluenced zone, suggesting that most of the riverine organic matter is composed of C4
plant remains and that it is deposited predominantly in the delta and prodelta systems
15
(Meadows et al., 2002). Approximately 42 km southeast of the Orange River mouth,
the average value ofδ13C in organic matter is∼ −19.8 ‰, which is close to the
aver-age value of marine organic matter (varying between −20 and −21 ‰) (Meadows et
al., 2002). Our core site is approximately 57 km southeast of the Orange River delta. Therefore, the influence of riverine DIC over our site is low, and wind-induced upwelling
20
of demineralized marine organic carbon provides the dominant source of DIC. Hence,
the long-term variability ofδ13C in our record may indicate changes in the strength of
coastal water upwelling, with relatively lowδ13C values indicating strong upwelling.
The δ18O record reflects a composite imprint of changes in continental ice
vol-ume, calcification temperature, and fresh water input. We removed the ice volume
25
component from the foraminiferal δ18O record using the eustatic level record from
Bard et al. (1996). A prominent feature in the ice volume corrected δ18O (δ18Oivc)
record throughout the early and middle Holocene is a gradually declining trend that
CPD
9, 2309–2356, 2013Holocene climate variability in the Winter Rainfall Zone
of South Africa
S. Weldeab et al.
Title Page
Abstract Introduction
Conclusions References
Tables Figures
◭ ◮
◭ ◮
Back Close
Full Screen / Esc
Printer-friendly Version
Interactive Discussion
Discussion
P
a
per
|
Dis
cussion
P
a
per
|
Discussion
P
a
per
|
Discussio
n
P
a
per
|
the δ18Oivc record reveals variation of 0.5 ‰ from the early to the middle Holocene
(Fig. 5). After 7500 yr BP a gradual decline inδ18Oivc continues until 5000 BP,
culmi-nating in the lowest δ18Oivc values. Submillennial-scale change is apparent between
7500 and 5000 yr BP but not as prominent as in the earliest Holocene. Under modern
climate conditions, Orange River runoffof∼11 km3yr−1is rapidly mixed with upwelled
5
surface waters and leaves only a negligible salinity imprint in the coastal oceanic
wa-ters. Therefore, it is likely that during the middle Holocene the decline in theδ18Oivc
record predominantly reflects increase in the foraminiferal calcification temperature with
0.21‰◦C−1 (Bemis et al., 1998). Parallel changes in the δ18O and δ13C time series
during the early and middle Holocene with decreasingδ18O and increasingδ13C
val-10
ues most likely indicate millennial-scale episodes of weakened upwelling and resultant
surface water warmth by approximately 2◦C (Fig. 6c and d).
5 Discussion
5.1 Early and middle Holocene climate variability
We identify three periods of millennial-scale climate changes during the early and
mid-15
dle Holocene. During the early Holocene (11 500–11 000 yr BP) relatively positiveεNd
values and high fraction of fine sediment indicate a dominant contribution of the Or-ange River to the enhanced fluvial input (Figs. 4c and 6f). Between 11 000 and 9500 yr
BP, εNd values shifted slightly toward the value of the coastal area (Fig. 4c) and the
fraction of fine sediment remained, probably indicating wet climate in the coastal area.
20
Around 9200 yr BP, we note the onset of a continuous increase of grain size reach-ing its maximum between 6000 and 5500 yr BP (Fig. 6f), a decrease in sedimentation
rate, and a decline inεNd values indicating a reduction of sediment from the Orange
River and an increase of coarse sediment fom the coastal area. We note that despite a notable decrease of Orange River sediments and an increase of local sediment input,
25
CPD
9, 2309–2356, 2013Holocene climate variability in the Winter Rainfall Zone
of South Africa
S. Weldeab et al.
Title Page
Abstract Introduction
Conclusions References
Tables Figures
◭ ◮
◭ ◮
Back Close
Full Screen / Esc
Printer-friendly Version
Interactive Discussion
Discussion
P
a
per
|
Dis
cussion
P
a
per
|
Discussion
P
a
per
|
Discussio
n
P
a
per
|
signature is small. In order assess the link between changes in the amount of sediment with Orange River eNd signature and climate conditions in the Orange River catch-ment, we compare our record with those from eastern South Africa where the main tributaries of the Orange River originate. Re-evalutions of several pollen records within the Orange River catchment and northeast of the catchment (Scott et al., 2008, 2012)
5
suggest a heterogenous pattern between these closely located sites. The Braamhoek pollen record (within the Orange River catchment) suggests relatively wet conditions through the early Holocene with slight drying trend toward the mid Holocene (Scott et al., 2012). A pollen record from the northeastern periphery of the Orange River basin (Rietvlei swamp) largely supports the climate trend as suggested by the Braamhoek
10
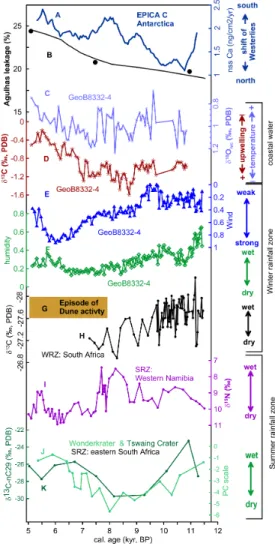
pollen record (Scott et al., 2012). Farther northeast from the Orange basin, the early and mid Holocene climate trend, as suggested by the Wonderkrater pollen record (Scott et al., 2012) and biomarker record from Tswaing Crater (Kristen et al., 2010), is
markedly different from that of Braamhoek and Rietvlei records (Scott et al., 2012). The
Wonderkrater (Scott et al., 2012) and Tswaing records (Kristen et al., 2010) suggest
15
early Holocene (11 500–10 000 yr BP) humid conditions that gave way to mid Holocene (9500–6500 yr BP) dry conditions (Fig. 6j and k). The comparison indicates that a link exists between humid climate conditions in eastern South Africa and an increase of fine components (EM3 and EM2) in the terrigenous sediment of Geo8332-4. Between 9500 and 7500 yr BP, the decrease of mositure in eastern South Africa (Fig. 6j and k)
par-20
allels the decline of EM3. The onset of humid climate conditions around 7500–7000 yr BP in eastern South Africa corresponds with increase of EM1, indicating relatively dry conditions in the coastal area.
The highest value of EM1, the end-member with the largest modal grain size of 20 µm, and more negative eNd value indicating a relatively enhanced eolian
contribu-25
CPD
9, 2309–2356, 2013Holocene climate variability in the Winter Rainfall Zone
of South Africa
S. Weldeab et al.
Title Page
Abstract Introduction
Conclusions References
Tables Figures
◭ ◮
◭ ◮
Back Close
Full Screen / Esc
Printer-friendly Version
Interactive Discussion
Discussion
P
a
per
|
Dis
cussion
P
a
per
|
Discussion
P
a
per
|
Discussio
n
P
a
per
|
by theδ13C andδ18O records (Fig. 6c and d). As discussed above, and consistent with
the conceptual climate model of Cockcroft et al. (1987), we note that during the mid Holocene a clear asymmetry exists between wet-dry patterns in the WRZ of South Africa and the main catchment of the Orange River in eastern South Africa. Cockcroft et al. (1987) postulated that during a dry phase in the WRZ near-surface southeasterly
5
(equatorward) winds prevail along the coastal region of the Namaqualand that would strengthen the southern BUS. During the mid Holocene dry phase our record indicates, however, a weakening of the southern BUS and warming of the surface water. We note that an increased Agulhas leakage is recorded concurrent with the mid Holocene upwelling decline and surface warming. Analagous with modern observations in the
10
southern BUS (Hardman-Mountford et al., 2003; Biastoch et al., 2009; Lutjeharms et al., 2001), we suggest that an enhanced leakage of warm water into the southeastern Atlantic changes the thermal and density structure of seawater along the west coast and weakens upwelling (see discussion below). The question remains open whether the mid Holocene weakening of the southern BUS, as strongly indicated by our record,
15
occurred despite the prevalence of southeasterly winds or concomitant with a weaken-ing of southeasterly winds.
Comparison of our results with available terrestrial records in the WRZ in South Africa reveals a broadly consistent pattern of regional climate variability. Between 12 000 and 9500 yr BP pollen time series as well as carbon and nitrogen isotope
20
records from the western margin of the WRZ (Scott and Woodborne, 2007a, b) reveal a dominance of pollen assemblages and isotope signatures indicative of enhanced
moisture availability. At∼8500 yr BP, the relatively wet conditions gave way to a more
arid environment that persisted until 5600 yr BP. The onset of aridification, as recorded in the pollen data, is coincident with the increase of coarse terrigenous material in
25
our record, supporting our interpreation that the increase in coarse particles reflects
dust mobilatization under arid climates. Farther to the south within the WRZ, a δ13C
CPD
9, 2309–2356, 2013Holocene climate variability in the Winter Rainfall Zone
of South Africa
S. Weldeab et al.
Title Page
Abstract Introduction
Conclusions References
Tables Figures
◭ ◮
◭ ◮
Back Close
Full Screen / Esc
Printer-friendly Version
Interactive Discussion
Discussion
P
a
per
|
Dis
cussion
P
a
per
|
Discussion
P
a
per
|
Discussio
n
P
a
per
|
2011). We note that there exists a multi-centennial mismatch pertaining the onset and termination of the dry and wet phases, as reflected in the various records referred above. This mismatch could be related not only to age model uncertainties but could arise also due to the elevation and the relative proximity of the hyrax dung collection sites to the perennial rainfall zone and/or Summer Rainfall Zone (SRZ). Similarly, there
5
exists a mismatch between the onset and termination in the strength of northeasterly and easterly winds in our record and those of dune mobilization in the coastal area (Chase and Thomas, 2006). The timing of enhanced middle Holocene dune activity along the west coast of South Africa has been constrained between 4000 and 8000 yr BP (Fig. 6g) (Chase and Thomas, 2006). Our records of dust and fluvial
sedimenta-10
tion indicate that the timing of dune activity in the Namaqualand overlaps to a large extent with the episode of enhanced wind strength (9000–5500 yr BP). Chase and Thomas (2006) note that their age model most likely reflects the cessation of a dune activity rather than the onset of dune mobility. Hence, it is very likely that the onset of arid conditions, as suggested by our records, and dune mobility in the Namaqualand
15
(Chase and Thomas, 2006) are temporally coincident and that the invigoration of the northeasterly and easterly winds was most likely critical for the dune formation. The overall picture that emerges from this comparison is a broadly consistent pattern of paleo-environmental conditions in the WRZ of southwestern Africa with wet conditions during the early Holocene between 11 500 and 9100 yr BP and an aridification trend,
20
gradual weakening of the southern BUS, and surface water warming of coastal water between 9000 and 5000 yr BP.
Comparing our records with terrestrial counterparts from the southwest African
sum-mer rainfall zone (SRZ) (Chase et al., 2010, 2009) and marine records offSouthwest
Africa (Shi et al., 2000; Stuut et al., 2002; Stuut and Lamy, 2004), it is evident that both
25
CPD
9, 2309–2356, 2013Holocene climate variability in the Winter Rainfall Zone
of South Africa
S. Weldeab et al.
Title Page
Abstract Introduction
Conclusions References
Tables Figures
◭ ◮
◭ ◮
Back Close
Full Screen / Esc
Printer-friendly Version
Interactive Discussion
Discussion
P
a
per
|
Dis
cussion
P
a
per
|
Discussion
P
a
per
|
Discussio
n
P
a
per
|
mobilization between 9000 and 5500 yr BP in the WRZ, as suggested by our record. Extending the comparison of our record to those of mid-latitude South America, we note several common features. Relatively humid conditions during the early Holocene
(11.5–9500±500 yr BP) and late middle Holocene centered at 5000±500 yr BP across
southwestern Africa (Fig. 6e and h) have their counterparts in southern South
Amer-5
ica, as indicated by rise in lake levels (Stine and Stine, 1990), dominance of moisture-indicating pollen assemblages (Moreno et al., 2010), and advance of mountain glaciers (Douglass et al., 2005). All these records suggest enhanced moisture availability, most likely in response to large-scale changes in atmospheric circulation. Key atmospheric features that exert control on the Southern Hemisphere mid-latitude moisture
distribu-10
tion are the westerly winds. Conceptual models emphasize that changes in the strength and latitudinal shift of the southern westerlies and attendant subtropical disturbances could have played a critical role in shaping past precipitation in southwestern Africa and mid-latitude South America (Cockcroft et al., 1987; Toggweiler and Lea, 2011; Togg-weiler et al., 2006; Tyson et al., 2002). Millennial- and orbital-scale climate variability
15
in subtropical and temperate latitudes has been also linked to latitudinal shifts of the southern westerlies (Lamy et al., 2007, 2011; Moreno et al., 2010; Stuut and Lamy, 2004).
A crucial observation in our record that infers the most probable climate link and mechanism is the coupling between aridification, weakening of the southern BUS, and
20
surface water warming (Fig. 6). Over the same period, proxy records indicate an in-crease of Agulhas water leakage into southeastern Atlantic (Peeters et al., 2004) and
rise of non-sea-salt (nss) Ca2+ accumulation in Antarctic ice cores (Roethlisberger et
al., 2002) (Fig. 6a and b). Long-term change in nss-Ca2+ over Antarctica is thought
to reflect changes in dust sources (vegetation cover and soil moisture) and changes
25
in atmopheric circulation (Dixon et al., 2011; Roethlisberger et al., 2002). Time series
analyses show that a dramatic increase of nssCa2+accumulation rate in West
CPD
9, 2309–2356, 2013Holocene climate variability in the Winter Rainfall Zone
of South Africa
S. Weldeab et al.
Title Page
Abstract Introduction
Conclusions References
Tables Figures
◭ ◮
◭ ◮
Back Close
Full Screen / Esc
Printer-friendly Version
Interactive Discussion
Discussion
P
a
per
|
Dis
cussion
P
a
per
|
Discussion
P
a
per
|
Discussio
n
P
a
per
|
Indian Ocean sectors (Beal et al., 2011). Instrumental and modeling studies demon-strate that southward displacement of the austral westerlies and attendant southward shift of the subtropical front enable an increased leakage of warm and saline Agulhas water into the southern Atlantic (Beal et al., 2011; Biastoch et al., 2008, 2009; Shannon et al., 1990). Modern observations also show that the incursion of Agulhas water into
5
the southern BUS warms the surface water and weakens the coastal upwelling due changes in the density structure of surface water (Hardman-Mountford et al., 2003; Bi-astoch et al., 2009; Lutjeharms et al., 2001). Rainfall observations in the WRZ between 1950 and 1999 show that with exception of the central area winter rainfall declined sig-nificantly in the southern, northern, and inland of the WRZ of Namaqualand (MacKellar
10
et al., 2007). Overall, instrumental observations of the last 4–5 decades of the last century show that there is a clear temporal coincidence and most likely causal links between southward displacement of austral westerlies and subtropical front, enhanced
Agulhas leakage, increase in nss-Ca2+ accumulation over Antarctica, a weakening of
the southern BUS, and decline of winter rainfall in large part of the Namaqualand.
15
Therefore based on the links deduced from modern observations we suggest that the middle Holocene dry conditions in the Namaqualand and the weakening of the south-ern BUS most likely were linked to a poleward shift of the austral westerlies and an enhanced amount of Agulhas water leakage, as indicated by geochemical analysis in Antarctic ice core (Roethlisberger et al., 2002) and shift in planktonic foraminiferal
com-20
position off South Africa (Peeters et al., 2004), respectively (Fig. 6a and b).
Further-more, we suggest that increased leakage of Agulhas water into the southern BUS and resultant warming of the coastal water during the middle Holocene may have reduced coastal fog formation. At present, coastal fog formation over the cold upwelled coastal water presents an important moisture source for the flora of Namaqualand (Cowling et
25
al., 1999; MacKellar et al., 2007). Warming of the coastal water reduces the thermal gradient between air and surface water temperature and fog formation.
Stager et al. (2012) suggest that increase in nss-Ca2 concentration in the Siple
CPD
9, 2309–2356, 2013Holocene climate variability in the Winter Rainfall Zone
of South Africa
S. Weldeab et al.
Title Page
Abstract Introduction
Conclusions References
Tables Figures
◭ ◮
◭ ◮
Back Close
Full Screen / Esc
Printer-friendly Version
Interactive Discussion
Discussion
P
a
per
|
Dis
cussion
P
a
per
|
Discussion
P
a
per
|
Discussio
n
P
a
per
|
westerlies. While location, altitude, and accumulation rate of snow may complicate a
meaningful comparison between the nss-Ca2record of Siple Dome and EPICA Dome
C, we argue that centennial- and millennial-scale increase of nss-Ca2+ in EPICA ice
core suggest a poleward shift of the austral westerlies. Our argument is based on mid Holocene and modern observation. Modern observations over the last 4–5 decades
5
show a temporal coincidence and causal link between dramatically increased nss-Ca2+
over Antarctica (Dixon et al., 2011), southward displacement and strengthening of the austral westerlies (Beal et al., 2011), and weakening of the southern BUS (Hardmann-Mountford et al., 2003; Lutjeharms et al., 2001). Similarly, the mid Holocene continous
increase of nss-Ca2+along with enhanced Agulhas water leakages is more compatible
10
with a poleward shift of the austral westerlies and associated subtropical front (Fig. 6).
5.2 Climate trend in southwestern Africa during the “Little Ice Age”
Over the last 700 yr, the GeoB8332-4 is marked by a gradual increase of fine-grained fluvial sediment (EM3). Nd and Sr isotope analyses suggest that ephemeral rivers of the Namaqualand and probably tributaries of the Lower Orange River significantly
con-15
tributed to the continuous rise of fluvial sediments between 600 and 100 yr BP (Fig. 4c and d). Robust climate records from the main catchment of the Orange River covering
the last 700 years are rare.δ18O records of cave deposits in the Makapansgat Valley
have been interpreted to reflect cold and relatively dry conditions (Tyson et al., 2000). Pollen in a sediment sequence from Lake Eteza located in the easternmost South
20
Africa (SRZ) indicates low tree percentages and an increase of grass accompanied by high sedimentation rate during the last 700 yr, and has been interpreted as reflecting dry conditions and anthropogenic impact (Neumann et al., 2010). The interpretation of dry climate in eastern South Africa is corroborated by measurements of tree ring thick-ness suggesting two prolonged dry phases within the last 700 yr (Vogel et al., 2001).
25
Overall, available records from eastern South Africa suggest that climate during the last 700 yr was relatively dry. In contrast, an increasing flood occurrence in the banks
CPD
9, 2309–2356, 2013Holocene climate variability in the Winter Rainfall Zone
of South Africa
S. Weldeab et al.
Title Page
Abstract Introduction
Conclusions References
Tables Figures
◭ ◮
◭ ◮
Back Close
Full Screen / Esc
Printer-friendly Version
Interactive Discussion
Discussion
P
a
per
|
Dis
cussion
P
a
per
|
Discussion
P
a
per
|
Discussio
n
P
a
per
|
(Herbert and Compton, 2007 and references therein) as well as pulses of freshening events evident in the Lake Verlorenvlei record (Stager et al., 2012) (Figs. 1 and 7k) over the last 700–600 yr lend credence to our Nd and Sr isotope-based inference of increased sediment contribution from the local rivers.
The increase in fluvial sediments of proximal origin between 600 and 100 yr BP falls
5
within the time interval of global climate instability known as the “Little Ice Age” (LIA). In the Northern Hemisphere, the duration of the LIA encompasses the time between 1300 and 1850 Common Era (CE) (Holzhauser et al., 2005; Miller et al., 2012). Else-where, the timing of the northern cold spell is less well constrained, owning to dating
uncertainties and interhemispheric difference in the onset and termination of this
cli-10
matic event (Schaefer et al., 2009). While anthropogenic contribution to the enhanced sediment mobilization at least during the younger part of the time series cannot be ruled out, we argue that our record largely reflects a regional expression of the global climate event associated with the LIA. Our data suggest that the winter rainfall zone of South Africa experienced humid conditions over the last 600 yr. Considering age model
15
uncertainties that can account up to±100 yr, the onset of humid phase in the WRZ of
southwestern Africa at 600±50 yr BP is coincident with these of glacier advances in
New Zealand at∼570 yr (Schaefer et al., 2009), lake level high stand at ∼500 BP in
Patagonia (Stine and Stine, 1990), dominance of wet climate-indicating pollen record from southern South America (Moreno et al., 2010), increased precipitation in
south-20
western Patagonia at around 575 yr BP (Moy et al., 2008), and the onset of decrease
in nss-Ca2+ accumulation of in Antarctica ice cores at∼650 yr BP (Fig. 7a). With the
exception of multi-decadal increase between 200 and 150 yr BP, nss-Ca2
concentra-tion remained low between 650 and 100 yr PB. Therefore, the increase in precipitaconcentra-tion within the WRZ was linked to a large-scale atmospheric reorganization in mid-latitudes
25
CPD
9, 2309–2356, 2013Holocene climate variability in the Winter Rainfall Zone
of South Africa
S. Weldeab et al.
Title Page
Abstract Introduction
Conclusions References
Tables Figures
◭ ◮
◭ ◮
Back Close
Full Screen / Esc
Printer-friendly Version
Interactive Discussion
Discussion
P
a
per
|
Dis
cussion
P
a
per
|
Discussion
P
a
per
|
Discussio
n
P
a
per
|
rainfall zone (SRZ) of southwestern Africa (Prospero et al., 2002; Stuut et al., 2002; Mahowald, 2006 #4049). We suggest that the Ti/Al record harbors a significant im-print of the climate development in the SRZ. Consistent with our records of high Ti/Al
and EM1, a δ15N time series analyzed in hyrax dung located in the SRZ of western
Namibia suggests relatively dry conditions (Chase et al., 2010; Fig. 7e). Approximately
5
at the timing of the rapid Ti/Al drop (∼400 yr BP), theδ15N record (Chase et al., 2010)
and reconstruction of flood deposits in northwestern Namibia (Heine, 2004) suggest an onset of an increasingly humid episode in the SRZ. This comparison reveals that the onset of relatively wet conditions in the southwestern African SRZ was delayed by
∼200 yr relative to that of the WRZ. Progressive northward expansion of the relatively
10
wet WRZ into the southwestern margin of the SRZ presents one possible explanation. An alternative explanation arises when the timing of maximum impact of the northern LIA is considered. Intensification of ice-cap growth in the Canadian Arctic (Miller et al., 2012), maximal glacier advances in Europe (Holzhauser et al., 2005), and a signifi-cantly reduced meridional heat transport to the North Atlantic (Lund and Curry, 2006)
15
commenced between 400 and 450 yr BP. As a consequence, an increased tempera-ture gradient between the northern mid-latitude and the tropics caused a large-scale southward displacement of the ITCZ, as suggested by the Lake Malawi and Cariaco Basin records (Haug et al., 2001; Johnson et al., 2001). Accordingly, the alternative hy-pothesis could be that at 400–450 yr BP a southward displacement of the intertropical
20
convergence zone (ITCZ) during the austral summer allowed more moisture incursion into the arid SRZ in southwestern Africa.
Changes in oceanic conditions off the Orange River are inferred using the δ13C
and δ18O records analyzed in tests of Neogloboquadrina pachyderma(sinistral) and
alkenone-based sea surface temperature (SST) estimates (Leduc et al., 2010; Meisel
25
et al., 2011) (Fig. 7b–c). On multi-centennial scale, theδ13C record indicates that
be-tween 700 and∼550 yr BP the southern BUS was relatively strong. After a brief
weak-ening (between 550 and 450 yr BP) the invigoration the southern BUS resumed at