1Universidade Federal do Rio Grande do Sul, Faculdade de Medicina, Programa de Pós-Graduação em Epidemiologia. R. Ramiro Barcelos, 2400, 90035-003, Porto Alegre, RS, Brasil. Correspondência para/Correspondence to: M DREHMER. E-mail: <[email protected]>.
2Universidade do Vale do Rio dos Sinos, Escola de Saúde, Curso de Nutrição. São Leopoldo, RS, Brasil.
Agreement of dietary fiber and calorie
intake values according to the choice
of nutrient composition and
household measure tables
Concordância dos valores de consumo de fibras
alimentares e de calorias diárias de acordo
com a escolha da tabela de composição
de nutrientes e de medidas caseiras
Michele DREHMER1 Cristiane MELERE2
Shaline Modena REINHEIMER1 Suzi Alves CAMEY1
A B S T R A C T
Objective
To analyze the variations in the daily intake of dietary fiber and calories according to the different nutrient composition and homemade measure tables.
Methods
Table and the table complied by Pinheiro were used in Method 4. The Brazilian Food Composition Table and the Brazilian household expenditure survey were used in Method 5.
Results
The highest agreement of calorie intake values were found between Methods 2 and 3 (Kappa=0.94; 0.92–0.95), and the lowest agreement was found between Methods 4 and 5 (Kappa=0.46; 0.42–0.50). As for the fiber intake, the highest agreement was found between Methods 2 and 5 (Kappa=0.87; 0.82–0.90), and the lowest agreement was observed between Methods 1 and 4 (Kappa=0.36; 0.3–0.43).
Conclusion
Considerable differences were found between the nutritional composition tables. Therefore, the choice of the table can influence the comparability between studies.
Keywords: Food analysis. Nutritional epidemiology. Tables of food composition.
R E S U M O
Objetivo
Analisar a variação no consumo diário de fibras e de calorias de acordo com diferentes tabelas de composição nutricional e de medidas caseiras.
Métodos
Cinco métodos baseados em diferentes tabelas de composição nutricional e de medidas caseiras foram utilizados para calcular o consumo diário de calorias e de fibras, aferidos por questionário de frequência alimentar em 633 gestantes atendidas na atenção primária do Sul do Brasil, arroladas para estudo de coorte. A concordância entre os cinco métodos foi avaliada pelo coeficiente Kappa e Kappa Ponderado. A Tabela de Suporte Nutricional e a de medidas caseiras do Estudo Nacional de Despesas Familiares foram usadas no método 1. A Tabela Brasileira de Composição de Alimentos e a Tabela para Avaliação de Consumo Alimentar em Medidas Caseiras (Pinheiro) foram utilizadas pelos métodos 2 e 3, sendo que no método 3 calculou-se a média dos subtipos do alimento encontradas na Tabela Brasileira de Composição de Alimentos correspondente ao item do Questionário de Frequência Alimentar. No método 4, foram utilizadas a Tabela Americana da United States Department of Agriculture e a Pinheiro e, no método 5, a Tabela Brasileira de Composição de Alimentos e a do Estudo Nacional de Despesas Familiares.
Resultados
A maior concordância entre valores de calorias ocorreu entre os métodos 2 e 3 (Kappa=0,94; 0,92–0,95) e a menor concordância foi entre os métodos 4 e 5 (Kappa=0,46; 0,42–0,50). Já para os valores de fibras, a melhor concordância foi entre os métodos 2 e 5 (Kappa=0,87; 0,82–0,90) e a menor entre os métodos 1 e 4 (Kappa=0,36; 0,31–0,43).
Conclusão
Diferenças encontradas, conforme escolha da tabela de composição nutricional, são relevantes, podendo influenciar a comparabilidade entre estudos.
Palavras-chave: Análise de alimentos. Epidemiologia Nutricional. Tabela de Composição de Alimentos.
I N T R O D U C T I O N
Food frequency questionnaires are widely used to determine the relationship between diet and disease in epidemiological studies because they are considered low cost and are easy to administer and to use in the analysis of food and nutrient intake. In nutritional epidemiology, it is important to work with accurate food
individuals’ diet includes many substances, some are known and quantifiable and others are grossly characterized [3,4].
Food intake assessment results are influenced by the quality of the information contained in the databases chosen for nutrient calculation. Researchers should pay attention to the main biases related to nutrient composition tables. A previous study has showed that different values were found between the American Table of Food Composition (United States Departament of Agriculture, USDA) and the British Table (McCance and Widdowson’s Composition of Foods Integrated Dataset). Differences of 7.0% in total energy, 8.7% in carbohydrates, 8.5% in proteins, and 5.2% in lipids were reported [5]. The incorrect description of foods and source of nutritional data, the use of unsuitable analytical methods with inadequate sampling, and variations due to genetic factors, regional disparities, food preparation and processing, and seasonal variation are factors that can influence the nutrient amounts listed in food composition tables [4-8]. It is important to check whether the data on food composition tables are constantly updated, considering the changes in food composition over time, improved analytical methods for particular nutrients, or the inclusion of information for new dietary components [3].
Not only should the choice of the food composition table be made carefully, but the selection of the food item included in databases should also be made using rigorous methodology. The choice of generic data, not based on food specificity, may result in error. For example, the food item “beans” may have several composition variations due to their variety, storage time, and method of preparation among other characteristics [9]. In the Tabela de Composição de Alimentos (TACO, Table Brazilian Food Composition) [10] the amount of fiber in different varieties of beans range between 4.8 and 13.9g per 100.0g of cooked food. Since they are considered an important food in the typycal Brazilian diet, beans are included in many food
intake assessment instruments in Brazil; it is present in 91.2% and 83.0% of the two main meals, lunch and dinner, respectively. In addition, they are the primary source of dietary fiber in the typical Brazilian diet [11].
Another study has investigated the foods listed in food composition tables and software to compare macronutrients and Total Energy Value (TEV). The authors found statistically significant differences between most of the foods analysed [4]. However, there are few studies available in the literature assessing the impact of differences between the tables on the results of epidemiological studies.
The objective of the present study is to analyze the variations in the daily intake of dietary fiber and calories according to the different nutrient composition and homemade measure tables. It is important to highlight that this study does not aim to identify the best combination of household measure and food composition tables but rather to show how this choice can influence the calculated values.
M E T H O D S
Calorie and fiber intake was evaluated in the Estudo do Consumo e do Comportamento Alimentar na Gestação (ECCAGe, Study of Food Intake and Eating Behavior During Pregnancy), and the methodology used has been described in detail in a previous publication [12]. ECCAGe included pregnant women receiving prenatal care in primary health care units in two cities in the Southern region of Brazil. They were evaluated during pregnancy and in the postpartum period up to the fifth month [9]. In order to estimate food intake during pregnancy [13] and during the postpartum period [14], a previously validated [15] Food Frequency Questionnaire (FFQ) was used in the present study.
list is composed of 88 items, and each one has a standard portion size expressed in traditional household measures or food units for the evaluation of the amount of food consumed. In order to obtain an estimate of daily food consumption, the food-frequency estimateswere converted into a value equivalent to daily consumption [13].
The total amount of each nutrient intake was calculated using the following equation: Estimated consumption = frequency of consumption/day x portion size x number of portions x nutrient in the portion.
Five methods that combine different nutrient composition and household measure tables were used in the analysis of food consumption, as described below.
Food consumption assessment Method 1 (M1) was used in the initial analysis of varied out by the ECCAGe team, which included the FFQ validation and analysis of the baseline study nutritional data. In the M1, the nutritional composition was evaluated using the Food Composition Table – Suporte para Decisão Nutricional (Support to Nutritional Decision) [16]; the Estudo Nacional de Despesas Familiares (ENDEF, Brazilian Household Expenditure Survey) [17] was used to estimate the portion size in grams or milliliters, expressed in household measures in the FFQ. Buss et al. [13] and Giacomello et al. [15] published their studies on ECCAGe dietary data before the wide dissemination of theTACO, whose new edition was released in 2011. This table, funded by the Ministry of health and Ministry of Social Development and Fight against Hunger, was created based on chemical analysis of 597 foods carried out to determine their nutritional composition and has been widely used in epidemiological studies [10].
Food consumption assessment Method 2 (M2) was composed of TACO, a reference Food Composition Table in Brazil, and the portion sizes were determined using the most frequently updated household measure table in 2010,
complied by Pinheiro et al. [18], named Tabela para Avaliação de Consumo Alimentar em Medidas Caseiras (Table for the Assessment of Household Measures) [18]. After the release of the TACO, all analyses related to food consumption in the ECCAGe were carried out using this table [14,19].
Food consumption assessment Method 3 (M3) was developed by the ECCAGe team in the attempt to increase representativeness of nutritional composition, following specific methodological steps, and it was used in other studies conducted by the same team [20]. For the calculations of food consumption of the FFQ items, M3 considered the presence of more than one subtype of food in the household measure tables. For example, in the table created by Pinheiro et al. [18], there are five different types of banana: banana-d’água (yellow cavendish or dwarf cavendish banana), banana-da-terra (plaintain or cooking banana), banana-maçã (apple banana), banana-ouro (lady’s finger banana), and banana-prata (burro or chunky banana). In this case, the average values of all subtypes was calculated in order to obtain a value in grams or milliliters that considered the different types of this specific food item. Similarly, the mean value of each nutrient, considering all subtypes, was obtained from the TACO table [10].
In Method 4 (M4), the nutritional composition was analyzed using the USDA food composition table [21], and the Pinheiro [18] table was used for the household measure values.
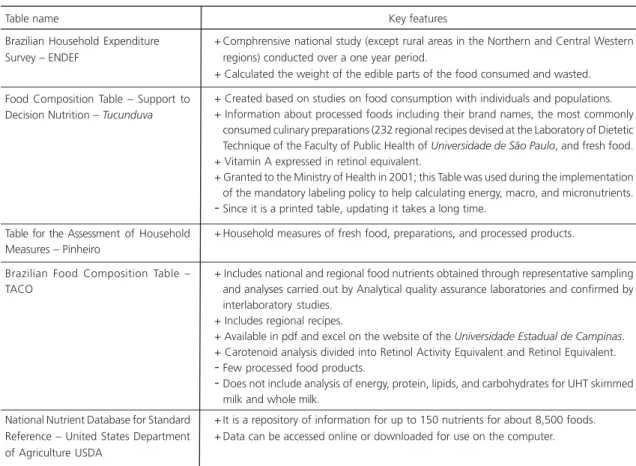
Method 5 (M5) was composed using the TACO [10] and ENDEF [17] tables for the comparison with the other four methods, making it possible to evaluate the isolated effect of the portion sizes of the foods selected on the food consumption analysis. Chart 1 shows the main characteristics of each food composition and household measure table.
grams or milliliters, according to the household measure tables previously mentioned, and the calorie and fiber contents, according to the food composition tables used in this study. This material is available on: <http://www.mat.ufrgs.br/ ~camey/HEIP_B/Material%20Suplementar.pdf>.
The present study was approved by the Reserch Ethics Committee of the Universidade Federal do Rio Grande do Sul (#11136). All participants Signed a Consent Form.
The continuous variables (fiber and calories) were expressed as median and Interquartile Range. The beanplot shows the distribution of the calorie and fiber values obtained from each Method (M1, M2, M3, M4 and M5) [22,23]. The plot combines a density
curve with a one-dimensional scatter plot. The shape of the density curve can be seen as the pod of a green bean, while the scatter plot shows the seeds inside the pod (individual measurements).
Fiber intake was categorized as “achieved” (≥28g) or “not achieved” (<28g) adequate intake during pregnancy, as recommended by the American Dietetic Association [24]. The calorie intake was categorized according to quartiles in the M3 method (Q1=2.519; median=3.344 and Q3=4.266kcal/day). To measure the correlation between the methods, we used the Kappa and weighted kappa coefficients with their respective confidence intervals, which were calculated using the bootstrap method [25].
Chart 1.Characterization of food composition and household measure tables. Porto Alegre (RS) and Bento Gonçalves (RS), Brazil (2007).
Brazilian Household Expenditure Survey – ENDEF
Food Composition Table – Support to Decision Nutrition – Tucunduva
Table for the Assessment of Household Measures – Pinheiro
Brazilian Food Composition Table – TACO
National Nutrient Database for Standard Reference – United States Department of Agriculture USDA
Table name
+ Comphrensive national study (except rural areas in the Northern and Central Western regions) conducted over a one year period.
+ Calculated the weight of the edible parts of the food consumed and wasted. + Created based on studies on food consumption with individuals and populations. + Information about processed foods including their brand names, the most commonly
consumed culinary preparations (232 regional recipes devised at the Laboratory of Dietetic Technique of the Faculty of Public Health of Universidade de São Paulo, and fresh food. + Vitamin A expressed in retinol equivalent.
+ Granted to the Ministry of Health in 2001; this Table was used during the implementation of the mandatory labeling policy to help calculating energy, macro, and micronutrients. -Since it is a printed table, updating it takes a long time.
+ Household measures of fresh food, preparations, and processed products.
+ Includes national and regional food nutrients obtained through representative sampling and analyses carried out by Analytical quality assurance laboratories and confirmed by interlaboratory studies.
+ Includes regional recipes.
+ Available in pdf and excel on the website of the Universidade Estadual de Campinas. + Carotenoid analysis divided into Retinol Activity Equivalent and Retinol Equivalent. -Few processed food products.
-Does not include analysis of energy, protein, lipids, and carbohydrates for UHT skimmed milk and whole milk.
+ It is a repository of information for up to 150 nutrients for about 8,500 foods. + Data can be accessed online or downloaded for use on the computer.
Key features
Note: +Adavantages; -Disadvantages.
ENDEF: Estudo Nacional de Desespesas Familiares (Brazilian Household Expenditure Survey); TACO: Tabela Brasileira de Composição de Alimentos
The analyses were carried out using R [26] pacakage beanplot [27], psy pacakage [28], and boot pacakage [29].
Women whose calorie intake, calculated using the M3 method, was over 6,000 calories daily were excluded of the dietary nutrient assessment [30].
R E S U L T S
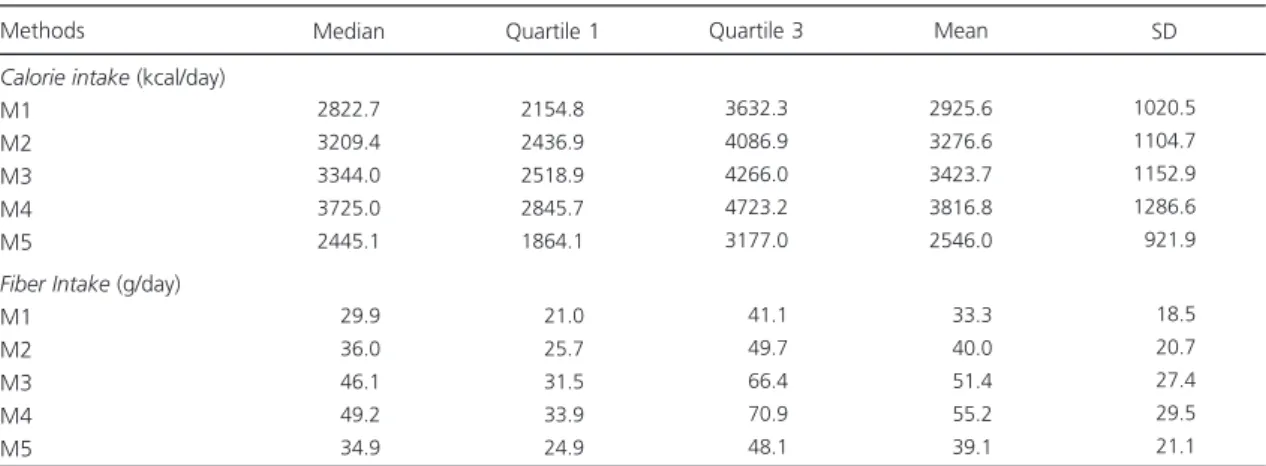
The mean age of the 633 pregnant women evaluated was 25.2 years (Standard Deviation-SD=6.5), and their average years of schooling was 7.7 (SD=2.7). Most women (79.1%) were married or lived with a partner, and the average household income was 2.6 times the minimum wages (SD=1.9). Table 1 presents the descriptive measures for calorie and fiber intake obtained from each method. M4 estimated the highest average calorie (3816.8; SD=1286.6) and fiber (55.2, SD=29.5) intake, whereas M5 estimated the lowest average calorie intake (2546.0; SD=921.9) and M1 estimated the lowest average fiber intake (33.3, SD=18.5). The result of the assessment of adequacy of fiber intake during pregnancy using M1 was 53.7%, i.e., 340
women achieved the adequate intake of 28g fibers/day. The result obtained using M2 was 69.5% (n=440); using M3, it was 81.5% (n=516); using M4, it was was 83.7% (n=530); and using M5, it was 67.3% (n=426).
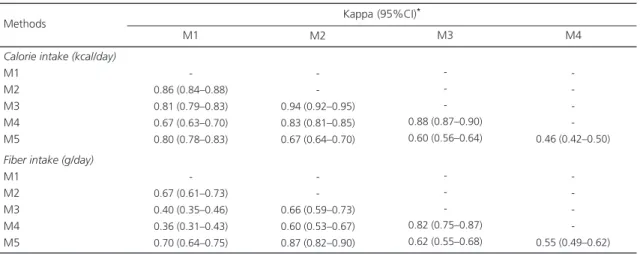
Table 2 shows the Kappa coefficients of the agreement between the classifications into quartiles of the calorie intake and and adequacy of fiber intake, according to the different methods used. As for the classification of calorie intake, according to quartiles of M3, the highest agreement was found between M2 and M3 (weighted Kappa=0.94; 95% Confidence Interval-95%CI=0.92–0.95), and the lowest agreement was found between M4 and M5 (weighted Kappa=0.46; 95%CI=0.42–0.50). With regard to the agreement between the adequacy of fiber intake, the highest agreement was found between M2 and M5 (Kappa=0.87; 95%CI=0.82–0.90), and the lowest agreement was found between M1 and M4 (Kappa=0.36; 95%CI=0.31–0.43).
Figure 1A shows how the distribution of calorie intake varied between the methods; there were changes not only in the one-dimensional scatter graph, but also in the density curve. The assessment of calorie intake using M5 showed
Table 1. Descriptive measures of each method. Porto Alegre (RS) and Bento Gonçalves (RS), Brazil (2007).
Calorie intake (kcal/day) M1
M2 M3 M4 M5
Fiber Intake (g/day) M1
M2 M3 M4 M5
Note: M1: Method 1(ENDEF and Food composition Table – Support to Nutritional Decision); M2: Method 2 (Pinheiro and TACO); M3: Method 3 (Pinheiro and TACO – average values of subtypes); M4: Method 4 (Pinheiro and USDA); M5: Method 5 (ENDEF and TACO).
ENDEF: Estudo Nacional de Desespesas Familiares (Brazilian Household Expenditure Survey); TACO: Tabela Brasileira de Composição de Alimentos
(Table Brazilian Food Composition); USDA: United States Departament of Agriculture; SD: Standard Deviation.
Methods 2822.7 3209.4 3344.0 3725.0 2445.1 0029.9 0036.0 0046.1 0049.2 0034.9 2154.8 2436.9 2518.9 2845.7 1864.1 0021.0 0025.7 0031.5 0033.9 0024.9 3632.3 4086.9 4266.0 4723.2 3177.0 0041.1 0049.7 0066.4 0070.9 0048.1 2925.6 3276.6 3423.7 3816.8 2546.0 0033.3 0040.0 0051.4 0055.2 0039.1 1020.5 1104.7 1152.9 1286.6 0921.9 0018.5 0020.7 0027.4 0029.5 0021.1
Table 2. Kappa coefficients of the two-by-two comparison between the methods evaluated. Porto Alegre (RS) and Bento Gonçalves
(RS), Brazil (2007).
Calorie intake (kcal/day) M1
M2 M3 M4 M5
Fiber intake (g/day) M1
M2 M3 M4 M5 Methods
-0.86 (0.84–0.88) 0.81 (0.79–0.83) 0.67 (0.63–0.70) 0.80 (0.78–0.83)
-0.67 (0.61–0.73) 0.40 (0.35–0.46) 0.36 (0.31–0.43) 0.70 (0.64–0.75)
-0.94 (0.92–0.95) 0.83 (0.81–0.85) 0.67 (0.64–0.70)
-0.66 (0.59–0.73) 0.60 (0.53–0.67) 0.87 (0.82–0.90)
-0.88 (0.87–0.90) 0.60 (0.56–0.64)
-0.82 (0.75–0.87) 0.62 (0.55–0.68)
-0.46 (0.42–0.50)
-0.55 (0.49–0.62)
Note: *Weighted Kappa for calorie intake. M1: Method 1(ENDEF and Food composition Table – Support to Nutritional Decision); M2: Method 2
(Pinheiro and TACO); M3: Method 3 (Pinheiro and TACO – average values of subtypes); M4: Method 4 (Pinheiro and USDA); M5: Method 5 (ENDEF and TACO).
ENDEF: Estudo Nacional de Desespesas Familiares (Brazilian Household Expenditure Survey); TACO: Tabela Brasileira de Composição de Alimentos
(Table Brazilian Food Composition); USDA: United States Departament of Agriculture.
M1
Kappa (95%CI)*
M2 M3 M4
Figure 1. Beanplot of the comparison between the methods evaluated, which represent the distribution of calories (a) and fiber (b) intake values. Porto Alegre (RS) and Bento Gonçalves (RS), Brazil (2007).
Note: M1: Method 1(ENDEF and Food composition Table – Support to Nutritional Decision); M2: Method 2 (Pinheiro and TACO); M3: Method 3 (Pinheiro and TACO – average values of subtypes); M4: Method 4 (Pinheiro and USDA); M5: Method 5 (ENDEF and TACO).
ENDEF: Estudo Nacional de Desespesas Familiares (Brazilian Household Expenditure Survey); TACO: Tabela Brasileira de Composição de Alimentos
(Table Brazilian Food Composition); USDA: United States Departament of Agriculture.
the lowest average intake value, the lowest dispersion, and the highest density curve when compared to the other methods, while M4 had the highest dispersion and the highest average intake value than those of all other methods. It is worth mentioning the similarity of the green bean pod shape between the methods with the same household measure table to evaluate kcal/d, with M1 and M5 x M2 x M3 x M4, respectively.
Comparing the distribution of fiber intake according to the 5 methods analyzed, it was observed that there was no significant change in the curve shape (Figure 1B). The method exerted more influence on the average intake value, than on dispersion. The lowest average intake value was obtained using M1, and the highest using M4. The M3 method had the lowest dispersion compared to the other methods.
D I S C U S S I O N
There were differences between calorie and fiber intakes according to the choice of assessment method of nutritional composition and household measures. In the calorie intake assessment, M2 and M3 methods had the highest agreement, and the lowest agreement was found between M4 and M5 methods. As for fiber intake, the highest agreement was found between M2 and M5 methods, and the lowest agreement was found between M1 and M4.
In the present study, the assessment of calorie and fiber intake was compared using the Nutritional Support Table (M1), the TACO Table (choosing an item per food in the FFQ [M2 and M5] or by the average of all sub-items available for that food [M3], and the USDA Table (M4). There was no difference in the comparison of calorie intake between Methods 2 and 3 (M2 and M3), when compared to the other methods. This can be justified by the use of the same food composition and household measure tables. The only difference between the methods was the use
of all subtypes of foods available in the calculation of the nutritional values and g/mL in M3, while in M2, there was only a single choice of a food item that represented the corresponding item in the FFQ. In contrast, the lowest agreement was found between M4, which used the American table (USDA), and M5, which used the TACO and ENDEF, with an average difference of approximately 1,280kcal between these methods. This may be due to the fact that these methods used different household measure Tables.
However, evaluation and comparison of the values from the different tables, should consider the criteria used in the creation of these tables, such as the use of chemical analysis or information obtained from the food industry [9]. In addition to the analytical methodologies, the tables differ from one another in the list of foods and in the nutrients in the same food due to crop, variety, environmental factors, and food production and preparation among others [5,7-9]. Due to these factors, the use of international tables in national studies on food consumption assessment must be done with caution [31]. Furthermore, there is a difference in terms of the nomenclature used since each country lists the foods using specific names according to the eating habits in their culture [32].
Adolescents [35], used TACO to assess food consumption.
In this study, there was a tendency to underestimate the M1 and M5 methods, which used the ENDEF Table to determine portion sizes, in terms of the average values of calories and fiber intake, when compared to the methods that used the Table for the assessment of household measures complied by Pinheiro (M2, M3, and M4). It also seems that there was an overestimation of M4 when compared to the other methods that used the same household measure table (M2 and M3). This difference can be attributed to the choice of foods from the American table, which are not always equivalent to Brazilian foods.
With respect only to the value of calorie intake, the lowest agreement (M4 and M5) indicates the most heterogeneous comparison between the methods. Therefore, researchers should be aware that both the choice of the food composition table and the household measures can impact study results. Moreover, it is noteworthy that the comparability of the results between studies should take into account the nutrient tables used so that the difference between the findings is attributed to the actual individuals’ food consumption. Furthermore, the choice of the USDA table for the analysis of food consumption data can lead to an overestimation of calorie intake in relation to the TACO table and an overestimation of fiber intake in relation to the Nutritional Support Table.
The comparison between studies assessing dietary intake is important in nutritional ep i d e m i o l o g y. Tw o m a j o r i n t e r n a t i o n a l studies – European Prospective Investigation into Cancer and Nutrition [36] and The Environmental Determinants of Diabetes in the Young [32] –˜ were aimed to develop nutrient databases and compare food composition tables between countries. However, the lack of comparability between the food composition tables and databases was the main obstacle found in both studies [32,36]. It is known that the effects of random and systematic
errors on dietary exposures can be minimized in studies involving a large and heterogeneous population through efforts to standardize food consumption assessment tools and food composition databases [36]. These differences can influence causal inferences in studies using food consumption data as exposure [3].
The present study has some limitations. Given the subjective nature of the choice of foods in the American table that correspond to those listed in the FFQ (based on translated nomenclature of the foods and the nutritional composition that is more similar to that of the Brazilian table) a bias may have been introduced. Another researcher could choose a different food item, and such choice would influence the agreement between the methods. Another limitation refers to the fact that the foods that were the main responsible for the differences between the methods were not identified. The main reason for that is that if instead of fiber and calorie intake, any other macro or micronutrient was calculated, other foods would have been identified. Therefore, it is understood that in a study focusing on evaluating different nutrients, the differences between the calculated values, based on different methods, will result in a list of different foods.
Finally, the present study highlights the differences found in the agreement between the methods used in the analysis of food data. Whatever the reasons that lead researchers to choose certain tables, they must be aware that their choices will affect the results of the study.
only to examine the differences between the different tables and investigate methods to assess food intake. Thus, we understand that the choice between M2 and M3 for use in future studies should be carefully analyzed by researchers since both methods have advantages and disadvantages. Data analysis in M2 is facilitated due to the choice of only one food item from the TACO corresponding to the FFQ item. The disadvantage of this method is that it relies on a subjective factor, i.e., the authors choose the most appropriate food item from the TACO. On the other hand, M3 has the advantage of not relying on a subjective factor since the average values of all subtypes from TACO are calculated in order to obtain a value in grams or milliliters that considered the different types of a specific food item. The disadvantage of M3 is that its analysis is more complex.
Finally, it is important to highlight that the present study aimed only to investigate and demonstrate that the choice of food composition and household measure tables can affect study results; it did not aim to determine their best combination.
C O N C L U S I O N
It is essential to point out the importance of this discussion in the scientific field and governmental bodies, as well as among health care professionals aiming at a better understanding of the different concepts of healthy eating.
A C K N O W L E D G M E N T S
The authors are grateful to the financial support provided by the Programa de Apoio a Núcleos de Exce-lência and Coodenação de Aperfeiçoamento de Peossal de Nível Superior and to the Estudo do Consumo e do Comportamento Alimentar na Gestação team, for their assistance in making this study possible.
C O N T R I B U T O R S
The authors M DREHMER, C MELERE, SM REINHEIMER and S CAMEY contributed to data
analysis, and the authors M DREHMER, C MELERE, and S CAMEY contributed to study conception and design, and data analysis and interpretation.
R E F E R E N C E S
1. Elmadfa I, Meyer AL. Importance of food composition data to nutrition and public health. Eur J Clin Nutr. 2010;64(Suppl.3):S4-7. https://doi. org/10.1038/ejcn.2010.202
2. Summer SS, Ollberding NJ, Guy T, Setchell KD, Brown N, Kalkwarf HJ. Cross-border use of food databases: Equivalence of US and Australian databases for macronutrients. J Acad Nutr Diet. 2013;113(10):1340-5. https://doi.org/10.1016/j. jand.2013.05.021
3. Thompson FE, Subar AF. Dietary assessment methodology. In: Coulston AM, Boushey CJ, Ferruzzi MG. Nutrition in the prevention and treatment of disease. 3rd ed. Amsterdam: Elsevier; 2013.
4. Ribeiro P, Morais T, Colugnati F, Sigulem D. Tabelas de composição química de alimentos: análise comparativa com resultados laboratoriais. Rev Saúde Pública. 2003;37(2):216-25. https://doi.org/ 10.1590/S0034-89102003000200009
5. Garcia V, Rona R, Chinn S. Effect of the choice of food composition table on nutrient estimates: A comparison between the British and American (Chilean) tables. Public Health Nutr. 2004;7(4):577-83. https://doi.org/10.1079/PHN2003555
6. Sasaki S, Ishikawa T, Yanagihori R, Amano K. Responsiveness to a self-administered diet history questionnaire in a work-site dietary intervention trial for mildly hypercholesterolemic Japanese subjects: Correlation between change in dietary habits and serum cholesterol levels. J Cardiol. 1999;33(6):327-38. 7. Charrondiere U, Chevassus-Agnes S, Marroni S, Burlingame B. Impact of different macronutrient definitions and energy conversion factors on energy supply estimations. J Food Compos Anal. 2004;17:339-60. https://doi.org/10.1016/j.jfca. 2004.03.011
8. Merchant A, Dehghan M. Food composition database development for between country comparisons. Nutr J. 2006;5(1):2. https://doi.org/ 10.1186/1475-2891-5-2
11. Mattos LL, Martins IS. Dietary fiber consumption in an adult population. Rev Saúde Publica. 2000;34(1):50-5. https://doi.org/10.1590/S0034-89 102000000100010
12. Nunes MA, Ferri CP, Manzolli P, Soares RM, Drehmer M, Buss C, et al. Nutrition, mental health and violence: From pregnancy to postpartum Cohort of women attending primary care units in Southern Brazil – ECCAGE study. BMC Psychiatry. 2010;(10):66. https://doi.org/10.1186/1471-244X-10-66
13. Buss C, Nunes MA, Camey S, Manzolli P, Soares RM, Drehmer M, et al. Dietary fibre intake of pregnant women attending general practices in Southern Brazil: The ECCAGE Study. Public Health Nutr. 2009;12(9):1392-8. https://doi.org/10.1017/ S1368980008004096
14. Drehmer M, Camey SA, Nunes MA, Duncan BB, Lacerda M, Pinheiro AP, et al. Fibre intake and evolution of BMI: From pre-pregnancy to postpartum. Public Health Nutr. 2013;16(8):1403-13. https://doi.org/10.1017/S1368980012003849 15. Giacomello A, Schmidt MI, Nunes MAA, Duncan BB, Soares RM, Manzolli P, et al.Validação relativa de Questionário de Freqüência Alimentar em gestantes usuárias de serviços do Sistema Único de Saúde em dois municípios no Rio Grande do Sul, Brasil. Rev Bras Saúde Mater Infant. 2008;8(4):445-54. https://doi.org/10.1590/S1519-38292008000400010
16. Philippi ST. Tabela de composição de alimentos: suporte para decisão nutricional. 2ª ed. São Paulo: Coronário; 2002.
17. Instituto Brasileiro de Geografia e Estatística. Estudo Nacional de Despesa Familiar 6˜ ENDEF. Rio de Ja-neiro: IBGE; 1976.
18. Pinheiro ABV, Lacerda EMA, Benzecry EH, Gomes MCS, Costa VM. Tabela para avaliação de consumo alimentar em medidas caseiras. 4ª ed. Rio de Ja-neiro: Atheneu; 2000.
19. Hoffmann JF, Nunes MA, Schmidt MI, Olinto MT, Melere C, Ozcariz SG, et al. Dietary patterns during pregnancy and the association with sociodemographic characteristics among women attending general practices in Southern Brazil: The ECCAGe Study. Cad Saúde Pública. 2013;29(5):970-80. https://doi. org/10.1590/S0102-311X2013000500014 20. Melere C, Hoffmann JF, Nunes MA, Drehmer M,
Buss C, Ozcariz SG, et al. Healthy eating index for pregnancy: Adaptation for use in pregnant women in Brazil. Rev Saúde Pública. 2013;47(1):20-8. https://doi.org/10.1590/S0034-8910201300010 0004
21. United States Department of Agriculture. Nutrient Data Laboratory. Washington (DC): USDA; 2012 [cited 6 Dec 2016]. Available from: http//:www.ars. usda.gov/main/site_main.htm?modecode=12-3 5-45-00.
22. Camey AS, Nunes LN, Cruz LN. Beanplot uma nova ferramenta gráfica. Rev HCPA Fac Med Univ Fed Rio G Sul. 2010;30:185-91.
23. Kampstra P. Beanplot: A boxplot alternative for visual comparison of distributions. J Statistical Software. 2008;28(1):1-9. https://doi.org/10.18 637/jss.v028.c01
24. Kaiser L, Allen LH. American Dietetic Association. Position of the American Dietetic Association: Nutrition and lifestyle for a healthy pregnancy outcome. J Am Diet Assoc. 2008;108(3):553-61. https://doi.org/10.1016/j.jada.2008.01.030
25. Davison AC, Hinkley DV. Bootstrap methods and their applications. Cambridge: University Press; 1997.
26. R Core Team. R: A language and environment for statistical computing. Vienna: Foundation for Statistical Computing; 2015 [cited 6 Dec 2016]. Available from: https://www.R-project.org 27. Kampstra P. Beanplot: A Boxplot alternative for
visual comparison of distributions. J Statistical Software. Netherlands: Faculty of Exact Sciences; 2008 [cited 6 Dec 2016];28(1):1-9. Available from: http://www.jstatsoft.org/v28/c01
28. Falissard B. Psy: Various procedures used in psychometry. R package version 1.1; 2012 [cited 6 Dec 2016]. Available from: http://CRAN.R-project. org/package=psy
29. Canty A, Ripley B. Boot: Bootstrap R (S-Plus) Functions. Version 1.3-17. Cambridge: Cambridge University Press; 2015.
30. Castro MBT, Kac G, de Leon AP, Sichieri R. High-protein promotes a moderate postpartum weight loss in a prospective cohort of Brazilian women. Nutrition. 2009;25(10-11):1120-8.
31. Menezes EW, Gonçalves FAR, Giuntini EB, Lajolo FM. Brazilian food composition database: Internet dissemination and others recent developments. J Food Compost Anal. 2002;15(4):453-64. https://doi. org/10.1006/jfca.2002.1083
33. Galeazzi MAM, Lima DM, Colugnati FAB, Padovani RM, Rodriguez-Amaya DB. Sampling Plan for the Brazilian TACO Project. J Food Compos Anal. 2002;15(4):499-505. https://doi.org/10.1006/jfca. 2002.1092
34. Instituto Brasileiro de Geografia e Estatística. Pesquisa de orçamentos familiares 2008-2009. Rio de Janeiro: IBGE; 2010.
35. Bloch KV, Klein CH, Szklo M, Kuschnir MC, Abreu Gde A, Barufaldi LA. ERICA: Prevalences of hypertension and obesity in Brazilian adolescents.
Rev Saúde Pública. 2016;50(Suppl.1):1-13. https:// doi.org/10.1590/S01518-8787.2016050006685 36. Slimani N, Deharveng G, Unwin I, Southgate DA,
Vignat J, Skeie G, et al. The EPIC nutrient database project (ENDB): A first attempt to standardize nutrient databases across the 10 European countries participating in the EPIC study. Eur J Clin Nutr. 2007;61(9):1037-56. https://doi.org/10.1038/ sj.ejcn.1602679