1Universidade Federal de Pernambuco, Centro de Ciências da Saúde, Programa de Pós-Graduação em Nutrição. Av. Moraes
Rego, s/n., Cidade Universitária, 50670-901, Recife, PE, Brasil. Correspondência para/Correspondence to: VM MUNIZ. E-mail: <[email protected]>.
2Universidade Federal de Pernambuco, Centro de Ciências da Saúde, Departamento de Nutrição. Recife, PE, Brasil.
Article based on the doctoral dissertation of VM MUNIZ intitled: “Distribuição intrafamiliar de alimentos: estudo de uma população de trabalhadores de cana-de-açúcar do Nordeste do Brasil”. Universidade Federal de Pernambuco; 2014.
Support: Conselho Nacional de Desenvolvimento Científico e Tecnológico (Process nº 51/2005, and nº401930/2005-0).
Food consumption of sugarcane
workers
’
families in the
Brazilian Northeast
Consumo alimentar de famílias de
trabalhadores de cana-de-açúcar
do Nordeste do Brasil
Vanessa Messias MUNIZ1
Débora Silva CAVALCANTI1
Nayalla Morais de LIMA22
Mônica Maria OSÓRIO1
A B S T R A C T
Objective
To analyze the food intake of sugarcane workers’ family members.
Methods
The food intake of 159 family members of sugarcane workers from Gameleira, Pernambuco, Brazilian Northeast, was investigated by directly weighing the foods on three non-consecutive days. The percent risk of inadequate macro- and micronutrient intakes was analyzed according to the Reference Dietary Intakes. The macronutrients were analyzed in relation to acceptable distribution intervals. The energy consumed from the various food groups was expressed as a ratio of the total energy intake.
Results
aged 1-3 years presented a high percent risk of inadequate iron intake. All age groups presented high percent risk of inadequate zinc, calcium, vitamin A, and vitamin C intakes. Grains and derivatives had a greater participation in the total energy intake, especially in men aged 19-30 years. The group “milk and dairy products” had a greater participation in the diet of children aged 1-3 years.
Conclusion
The low percent risk of inadequate carbohydrate and protein intakes in all age groups was opposed to the high risk of inadequate mineral and vitamin intakes, making the population vulnerable to nutritional disorders caused by excess macronutrient intake and inadequate micronutrient intake.
Keywords:Food consumption. Nutritional requirements. Rural population.
R E S U M O
Objetivo
Analisar o consumo alimentar dos indivíduos de famílias de trabalhadores de cana de açúcar.
Métodos
Foi realizado um inquérito de consumo alimentar envolvendo 159 sujeitos, oriundos de famílias de trabalhadores de cana de açúcar do município de Gameleira, Pernambuco, Nordeste do Brasil. O instrumento foi aplicado pelo método de pesagem direta, por três dias não consecutivos. Os percentuais de risco de inadequação de macro e micronutrientes foram analisados segundo as Ingestões Dietéticas de Referência. Os macronutrientes foram analisados em relação aos intervalos de distribuição aceitável. O consumo energético dos grupos alimentares foi expresso pela sua participação relativa no total da dieta.
Resultados
O consumo mediano de carboidrato e proteína manteve-se acima da Necessidade Média Estimada e em todas as faixas etárias foi identificado baixo risco de inadequação desses nutrientes. A riboflavina, niacina, tiamina e ferro mantiveram-se acima daquela Necessidade em todas as faixas etárias, apresentando um percentual de risco de inadequação elevado para o ferro nas crianças de um a três anos. Por outro lado, zinco, cálcio, vitamina A e vitamina C apresentaram elevados percentuais de risco de inadequação em todas as faixas etárias. No consumo energético, houve maior participação dos cereais e derivados, especialmente na dieta dos homens de 19 a 30 anos. Já o grupo de leite e derivados teve a maior participação na dieta das crianças de um a três anos.
Conclusão
Os baixos riscos de inadequação de carboidratos e proteínas, em todas as faixas etárias se contrapuseram aos riscos elevados de inadequação dos minerais e vitaminas, tornando a população vulnerável aos distúrbios nutricionais pelo excesso de macronutrientes e deficiência de micronutrientes.
Palavras-chave:Consumo de alimentos. Necessidades nutricionais. População rural.
I N T R O D U C T I O N
The large epidemiologic nutritional studies conducted in Brazil have shown that from the 1970s, factors such as accelerated urbanization and globalization have contributed to change the population’s eating pattern, with a considerable increase in the acquisition of high-carbohydrate and high-protein foods and lower dietary participation of fruits and non-starchy vegetables1,2.
Although the availability of foods in households over time is known at the national
and regional level, the data stemming from national studies, except for the Pesquisa de Orçamentos Familiares 2008/2009 (POF, Family Budget Survey)3, do not allow direct assessment of the foods consumed by each family member1,4. Furthermore, different eating patterns can be found in marginalized population groups, which are more susceptible to food and nutrition insecurity5.
higher proportion of their salaries on food than higher-income families, and they normally prioritize basic and inexpensive foods capable of providing satiety and energy6,7.
Gameleira, a municipality in the Brazilian Northeast, is one of the municipalities with the lowest Human Development Index (HDI) in Brazil. It is in this low socioeconomic context that the families of the study rural workers live. The main economic activity of this municipality is sugarcane monoculture, establishing a scenario of stagnation that exposes the population to low productive diversity, which certainly reflects on their dietary and nutritional situation8.
Therefore, the objective of this study was to analyze the food intake of family members of sugarcane workers from the municipality of
Gameleira (PE), Brazilian Northeast, by analyzing the percent risk of inadequate nutrient intakes.
M E T H O D S
This is an analytical, cross-sectional study of a delimited population (sentinel site) composed of 46 families living in a sugarcane worker village in the rural area of the municipality of Gameleira
(PE), Brazilian Northeast. The study included 225 individuals and analyzed the food intake of 159 individuals of the following age groups (based on the Dietary Reference Intakes [DRI] of the Institute of Medicine of the National Academy of Sciences)9: 1 to 3 years (n=22); 4 to 8 years (n=40); men aged 19 to 30 years (n=23) and 31 to 50 years (n=28); and women aged 19 to 30 years (n=26) and 31 to 50 years (n=20). Children aged less than one year were excluded because of the predominant intake of breast milk. Males and females aged 9 to 13 years and 14 to 18 years, and pregnant women were also excluded because they were too few, which would prevent the determination of their percent risk of inadequate nutrient intakes.
The field work was conducted from February 26 to April 15, 2007, the off season
period for sugarcane workers. This time was chosen because the families are at greater financial and food intake instability, so the study would be able to show their food and nutrition vulnerability. Seven dieticians trained at the Department of Nutrition of the Universidade Federal de Pernambuco (UFPE) collected the data.
A questionnaire with the following variables was used for characterizing the families: family income, family income per member, enrollment in the Bolsa Família Program, education level of the family head, literacy of the family head, and time living in the village.
Each interviewer observed a household on three nonconsecutive days, including a weekend day, performing the food intake investigation by directly weighing all the foods consumed throughout the day, from the first to the last meal. This approach required a period of adaptation between the interviewers and the families before starting the study, and their constant presence during the entire time doing the field work. The families were very receptive and none refused to participate in the study.
At meal time, the individuals would help themselves or the person responsible for their distribution would help everyone else. The foods were then immediately weighed before they were consumed. The solid foods were weighed by a digital scale and the fluids were measured by a graduated beaker. The leftovers on the plate were also measured and subtracted from the initial weights to determine how much each individual actually consumed.
After recording the weights and volumes in the food intake form, the data were reviewed by the field supervisor to make sure the forms had been filled correctly or to check whether any information was missing, which were corrected immediately. The preparations were dismembered into their ingredients to determine the weight or volume of each food.
and after the database was validated, they were converted into energy, macronutrients, and micronutrients by the software Diet Pro 5.1i Professional (support system for nutritional and dietary assessment, Agromídia Software, Viçosa
[MG] Brasil). Next the database was constructed and validated by the program Epi Info version 6.04, and the statistical analysis was performed by the software Statistical Package for the Social Sciences (SPSS) version 13.0.
Nutrient distribution was tested for normality by the Kolmogorov Smirnov test, and nutrients without normal distribution were converted into their natural logarithms and tested again. It was not possible to calculate the percent risk of inadequate vitamin A and zinc intakes by men aged 19-30 years and men aged 31-50 years, respectively, because the distribution of these nutrients was not normal even after conversion to their natural logarithm.
The data were expressed as means and percent risk of inadequate intake considering the DRI9. The percent risks of inadequate protein, carbohydrate, iron, zinc, vitamin C, vitamin A, niacin, thiamin, and riboflavin intakes were calculated according to the Estimated Average Requirement (EAR) for each study age group9. For calcium EAR, we used the Institute of Medicine parameters established in 201010. Since lipids do not yet have an EAR, it was not possible to estimate its prevalence of inadequacy.
Energy intake assessment used the Estimated Energy Requirements (EER) for healthy individuals to maintain energy balance. The EER of each individual was calculated by using the equation that predicts the total energy intake during different life stages, considering age, gender, weight, height, and level of physical activity9. Lipids, proteins, and carbohydrates were assessed by taking as reference their acceptable reference ranges established to prevent chronic non-communicable diseases and to meet the individual’s nutritional requirements9.
The food groups in the Brazilian Food Guide (oils and fats; sugar and sweets; milk and
dairy products; meats and eggs; legumes and nuts; non-starchy vegetables; fruits; and grains, bread, tubers, and roots) were used for describing the relative participation of the foods in the diet of each family member by life stage11.
The present study was approved by the Research Ethics Committee of the UFPE under the Ethical Assessment Presentation Certificate (CAAE) number 1460.0.172.000-05 to meet the norms that regulate human research.
R E S U L T S
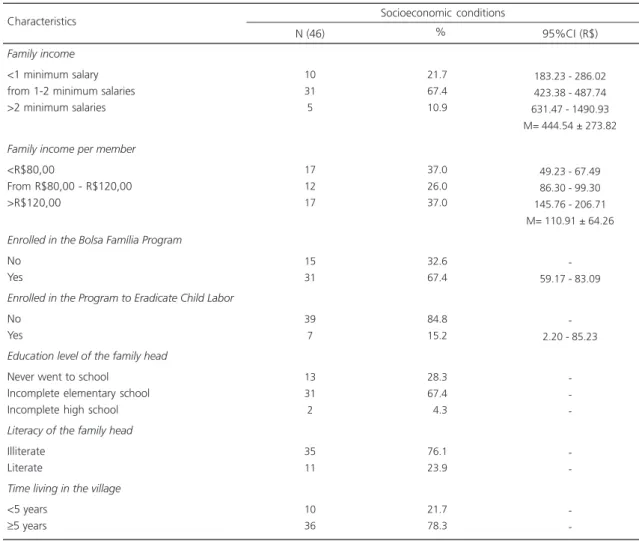
Of the 159 study participants, 47.2% (n=75) were males and 52.8% (n=84) were females. Most were aged more than 19 years. In all 46 families, the father was identified as the person responsible for the family’s sustenance and survival. Most families received from one to two minimum salaries (R$350.00 at the time) and had a family income per member lower than R$120.00. The mean family income including income from welfare programs was R$444.54 ± 273.82. Most families were enrolled in the Bolsa Família Program and a few were also enrolled in the Program to Eradicate Child Labor. Most family heads had not finished elementary school, were illiterate, and had been living in the village for more than five years (Table 1).
Table 2 shows that the percent risk of inadequate carbohydrate intake was low, especially for women and men aged 19-30 years, who did not present risk of inadequate intake for this nutrient. Protein intake was above the EAR values, and all age groups presented low risk of inadequate protein intake.
The mean iron intake was above the EAR for all study age groups. Men presented the smallest percent risk of inadequate iron intake, especially those aged 19-30 years, who stayed outside of the risk margin. Children aged 1-3 years and women aged 19-30 years presented the highest percent risks of inadequate iron intake.
Table 1. Characteristics of the sugarcane workers’ families. Gameleira (PE), 2007.
Family income
<1 minimum salary from 1-2 minimum salaries >2 minimum salaries
Family income per member
<R$80,00
From R$80,00 - R$120,00 >R$120,00
Enrolled in the Bolsa Família Program
No Yes
Enrolled in the Program to Eradicate Child Labor
No Yes
Education level of the family head
Never went to school Incomplete elementary school Incomplete high school
Literacy of the family head
Illiterate Literate
Time living in the village
<5 years
≥5 years
Note: M: Mean; 95%CI: 95%Confidence Interval.
10 31 5 17 12 17 15 31 39 7 13 31 2 35 11 10 36 21.7 67.4 10.9 37.0 26.0 37.0 32.6 67.4 84.8 15.2 28.3 67.4 04.3 76.1 23.9 21.7 78.3
183.23 - 286.02 423.38 - 487.74 631.47 - 1490.93 M= 444.54 ± 273.82
49.23 - 67.49 86.30 - 99.30 145.76 - 206.71 M= 110.91 ± 64.26
-59.17 - 83.09
-2.20 - 85.23
-Socioeconomic conditions Characteristics
N (46) % 95%CI (R$)
Table 2. Nutritional Requirements, mean intake, and percent risk of inadequate macronutrient and mineral intakes by family members of sugarcane workers. Gameleira (PE), 2007.
1-3 y 4-8 y
Women (19-30 y) Men (19-30 y) Women (31-50 y) Men (31-50 y)
Note: *Distribution was not normal. %: percent risk of inadequate intake.
M: Mean; EAR: Estimated Average Requirement; y: years.
Individuals 100 100 100 100 100 100 180.9 245.3 340.5 398.0 343.5 488.5 13 1 0 0 2 1 Carbohydrate
EAR M %
Nutrients 11 15 38 46 38 46 33.0 46.7 88.3 92.1 72.3 81.2 1 0 6 0 1 0 Protein
EAR M %
3.0 4.1 8.1 6.0 8.1 6.0 05.5 07.6 15.9 19.0 14.7 25.7 27 6 15 0 7 0 Iron
EAR M %
2.5 4.0 6.8 9.4 6.8 9.4 1.79 3.90 6.67 8.91 7.94 10.70 53 58 41 32 39 * Zinc
EAR M %
500 800 800 800 800 800 421.4 294.3 348.7 367.6 294.2 455.5 52 96 97 99 100 87 Calcium
EAR M %
Children presented higher risk of inadequate zinc intake, with 50% of this population being at risk.
All study age groups presented high percent risk of inadequate calcium intake, and the risk was similar for all groups. Children aged 1-3 years had the lowest percent risk of inadequate calcium intake. On the other hand women aged 31-50 years and men aged 19-30 years presented, respectively, 100 and 99% risk of inadequate calcium intake.
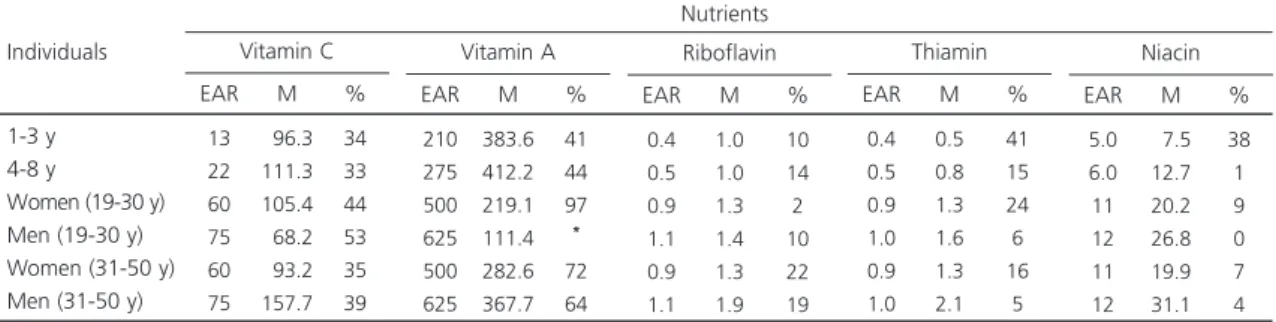
Table 3 shows that all age groups presented high percent risk of inadequate vitamin C intake, especially men aged 19-30 years. Vitamin A intake was also much lower than the requirement, with high percent risk of inadequate intake, especially for women aged 31-50 years and those aged 19-30 years, whose percent risks remained above 70% and almost 100%, respectively.
Riboflavin, thiamin, and niacin intakes by all age groups were above the EAR. Nevertheless,
children aged 1-3 years presented expressive percent risks of inadequate thiamin and niacin intakes.
Regarding carbohydrate, protein, and lipid intakes, Table 4 shows that most children aged less than eight years presented lipid intake below the lower limit of the acceptable intake range. Children aged 1-3 years were 100% within the acceptable intake range for protein and roughly 36% of them were consuming more carbohydrates than the upper limit of the intake range. The diet of most individuals aged more than 19 years were within the acceptable ranges for all macronutrients.
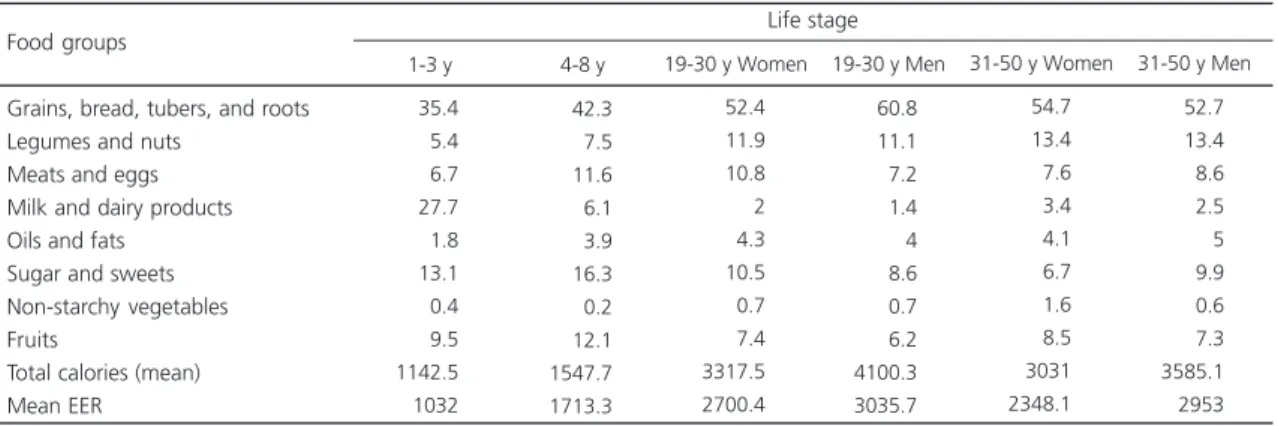
Table 5 shows the energy intake of the families by food group and life stage. Grains and derivatives presented higher energy participation in all age groups, especially in men aged 19-30 years, contributing to 60.8% of their energy
Table 3. Nutritional Requirements, mean intake, and percent risk of inadequate vitamin intakes by family members of sugarcane workers. Gameleira (PE), 2007.
1-3 y 4-8 y
Women (19-30 y) Men (19-30 y) Women (31-50 y) Men (31-50 y)
Note: *Distribution was not normal. %: percent risk of inadequate intake.
M: Mean; EAR: Estimated Average Requirement; y: years.
Individuals 13 22 60 75 60 75 096.3 111.3 105.4 068.2 093.2 157.7 34 33 44 53 35 39 Vitamin C
EAR M %
Nutrients 210 275 500 625 500 625 383.6 412.2 219.1 111.4 282.6 367.7 41 44 97 * 72 64 Vitamin A
EAR M %
0.4 0.5 0.9 1.1 0.9 1.1 1.0 1.0 1.3 1.4 1.3 1.9 10 14 2 10 22 19 Riboflavin
EAR M %
0.4 0.5 0.9 1.0 0.9 1.0 0.5 0.8 1.3 1.6 1.3 2.1 41 15 24 6 16 5 Thiamin
EAR M %
5.0 6.0 11 12 11 12 07.5 12.7 20.2 26.8 19.9 31.1 38 1 9 0 7 4 Niacin
EAR M %
Table 4. Carbohydrate, protein, and lipid profiles of the diets of sugarcane workers’ families. Gameleira (PE), 2007.
1-3 years 4-8 years 19-30 years (men) 19-30 years (women) 31-50 years (men) 31-50 years (women) Individuals -3.8 -63.6 70.0 65.2 65.4 67.9 65.0 36.4 30.0 34.8 30.8 32.1 35.0
<AMDR AMDR >AMDR Carbohydrate (%) Dietary characteristics -17.5 04.3 03.8 -05.0 100.0 082.5 095.7 096.2 100.0 095.0
-<AMDR AMDR >AMDR Protein (%) 86.4 60.0 30.4 26.9 39.3 35.0 09.1 40.0 69.6 73.1 60.7 65.0 4.5
-<AMDR AMDR >AMDR Lipid (%)
requirement. On the other hand, energy intake from legumes and nuts was higher in adults (above 11.0%).
Children aged 1-3 years consumed the smallest percent of energy from animal-origin food groups, namely “meats and eggs” and “milk and dairy”.
The group oils and fats also presented the smallest participation in children aged 1-3 years and the highest in men aged 31-50 years. On the other hand, the group sugar and sweets had a higher relative participation in the diet of children aged 1-3 years and in that of children aged 4-8 years (above 13%).
The participation of non-starchy vegetables in the total energy intake of the study population was very low for all age groups, below 1.6%. On the other hand, fruits presented a higher participation in the total energy intake of the sample, especially in children aged 4-8 years.
Generally, all age groups except children aged 4-8 years presented a mean calorie intake above the EER for their age group.
D I S C U S S I O N
Food intake assessments aim to identify the dietary participation of nutrients and estimate their adequacy in relation to the reference values. Although low-income individuals have a relatively
stable eating pattern, many factors, such as weekday and season, contribute to the daily food intake variability. Therefore, the collection of three dietary surveys from each individual minimizes the effect of this intrapersonal variability on the intake estimates, allowing greater reliability of the data used for calculating the percent inadequacy of each nutrient12.The present study contributes to this methodological particularity by measuring the foods consumed by each family member during three non-consecutive days, directly weighing each food.
The study results show that for all age groups, the low risk of inadequate carbohydrate and protein intakes opposed the high risks of inadequate mineral and vitamin intakes, possibly because of the higher intake of grains, legumes and nuts, sugar and sweets, and meats and eggs, in detriment of, particularly, non-starchy vegetables.
Excess sugar intake, especially by children and women aged 19-30 years, reflects the low diet quality. Especially for children, sugar is routinely added to preparations containing milk, contributing to increase sugar intake. Energy-dense and nutrient-scarce foods are a risky food pattern for nutritional unbalances and for the onset of obesity and other chronic non-communicable diseases. For the adult Brazilian population, POF 2002/2003 and POF 2008/20093,13 show that the participation of sugar and sweets to the total energy intake exceeds the maximum limit of 10% recommended by the World Health Organization14.
Table 5. Energy participation (%) of the food groups in the diet of sugarcane workers’ families by life stage. Gameleira (PE), 2007.
Grains, bread, tubers, and roots Legumes and nuts
Meats and eggs Milk and dairy products Oils and fats
Sugar and sweets Non-starchy vegetables Fruits
Total calories (mean) Mean EER Food groups
35.4 5.4 6.7 27.7 1.8 13.1 0.4 9.5 1142.5 1032
42.3 7.5 11.6 6.1 3.9 16.3 0.2 12.1 1547.7 1713.3
1-3 y 4-8 y
52.4 11.9 10.8 2 4.3 10.5 0.7 7.4 3317.5 2700.4
60.8 11.1 7.2 1.4 4 8.6 0.7 6.2 4100.3 3035.7 19-30 y Women 19-30 y Men
54.7 13.4 7.6 3.4 4.1 6.7 1.6 8.5 3031 2348.1
52.7 13.4 8.6 2.5 5 9.9 0.6 7.3 3585.1 2953 31-50 y Women 31-50 y Men
Life stage
Although children aged 1-3 years presented a very low intake of meats and eggs, important sources of animal-origin protein, they presented the highest intake of milk and dairy compared with the other age groups. This intake contributes to improve the protein content of the diet.
All individuals presented an energy intake from oils and fats below 5% of the total energy intake. The fact that the diets presented low- and normal-lipid profiles suggests that the mean calorie intake above the EER for all age groups except children aged 4-8 years can be attributed to excessive carbohydrate intake, not excessive fat intake.
The smaller risk of inadequate calcium intake in children aged 1-3 years is probably due to the higher intake of milk and dairy products. However, the general above 50% risk of inadequate calcium intake is concerning, especially for children and adolescents, given the importance of adequate calcium intake until age 30 years, when the bone mass of the body peaks, in order to reduce the risk of osteoporosis later in life15.
Also deserving of emphasis is the fact that children aged 1-3 years presented the highest percent risk of inadequate iron intake, which can be blamed on a dietary pattern poor in meats along with a high intake of milk and dairy. Intake of cow milk can be one of the causes of iron deficiency risk, since this food is not only poor in iron, but also high in calcium, which inhibits iron absorption16.Women aged 19-30 years also presented high percent risk of inadequate iron intake, corroborating other studies that found that this age group is also vulnerable to anemia17,18.
The other study life stages presented less than 15% risk of inadequate iron intake. This result should be analyzed with caution because it is necessary to know the bioavailability of the iron consumed and bear in mind the association between anemia and low socioeconomic classes19.
Vitamin A intakes were below the levels recommended by nutritional references, with all age groups except children aged less than 8 years presenting high percent risk of inadequate intake. The food groups that could increase vitamin A intake are dairy products and non-starchy vegetables, both inadequately consumed by the study population. Hypovitaminosis A expresses intensive dietary deprivation of vitamin A since this vitamin can be stored. It is also a public health problem in marginalized groups, people with low socioeconomic level that live in poor sanitary conditions, situations that are typical in the Brazilian Northeast20.
Brazilian studies have found that children have very low dietary zinc intake. In the state of
Pernambuco, Fidelis & Osório21 found a 40% zinc intake inadequacy in children aged less than 5 years, while in São Paulo (SP), Curitiba (PR), and
Recife (PE), Caetano et al.22 found a 75% zinc intake inadequacy in children aged 6-12 months who were not breastfed. Zinc deficiency during childhood impairs normal growth and development and reduces resistance to diseases, especially infections23.Zinc deficiency can also aggravate vitamin A deficiency in all age groups, since zinc is particularly important for the synthesis of retinol-binding protein, and consequently, for the hepatic mobilization of this vitamin24.
Comparing of the present study with that by Morimoto et al.25 who analyzed the food intake of young women from the state of São Paulo, women aged 19-30 years from both studies presented very similar inadequate zinc, niacin, and riboflavin intakes. On the other hand, the present study women presented higher thiamin and vitamin C intake inadequacies.
intakes, especially non-starchy vegetables, important sources of these vitamins25. These data corroborate Garcia et al.26 who identified that thiamin and niacin were among the most limiting nutrients in the nutritional density of complementary foods given to children aged less than two years, exposing them to unbalanced energy metabolism.
According to Romanelli27, generally one of the main reasons that justifies these inadequate micronutrient intakes is the fact that for low-income individuals, non-starchy vegetables are not satiating and generally referred to in the diminutive: thingies, “saladies”, “leafies”. On the other hand, foods like rice and beans are classified as “foods” and are considered “strong” in their representations.
In conclusion, the present findings allowed us to identify that the food intake of the sugarcane workers’ families from Gameleira (PE) make them vulnerable to nutritional disorders, both because of the excessive intake of macronutrients and the inadequate intake of micronutrients. This reality reinforces the importance of actions to fight food and nutrition insecurity as well as food and nutrition education actions that promote a healthy diet, one that is appropriate to marginalized populations.
A C K N O W L E D G M E N T
The authors thankCristianne Martins Ferreira Fidelis for her contribution supervising the study field work.
C O N T R I B U T I O N S
VM MUNIZ, DS CAVALCANTI, and MM OSÓRIO helped to conceive the study, analyze, interpret the data, and write and review the manuscript. NM LIMA helped to process, analyze the data, and review the manuscript.
R E F E R E N C E S
1. Levy-Costa RB, Claro RM, Mondini L, Sichieri R, Monteiro CA. Distribuição regional e
socioeco-nômica da disponibilidade domiciliar de alimentos no Brasil em 2008-2009. Rev Saúde Pública.2012; 46(1):6-15. http://dx.doi.org/10.1590/S003489 102011005000088
2. Olinto MTA, Willett WC, Gigante DP, Victora CG. Sociodemographic and lifestyle characteristics in relation to dietary patterns among young brazilian adults. Public Health Nutr. 2010; 14(1):150-9. http:// dx.doi.org/10.1017/S136898001000162x 3. Instituto Brasileiro de Geografia e Estatística.
Pes-quisa de orçamentos familiares 2008-2009: análise do consumo alimentar pessoal no Brasil. Rio de Janeiro: IBGE; 2011.
4. Marchioni DMM, Claro RM, Levy-Costa RB, Monteiro CA. Patterns of food acquisition in Brazilian households and associated factors: A population-based survey. Public Health Nutr. 2011; 14(9):1586-92.http://dx.doi.org/10.1017/S13689 80011000486
5. Oliveira JS, Lira PIC, Maia SR, Sequeira LAS, Amorim RCA, Batista-Filho M. Insegurança alimentar e estado nutricional de crianças de Gameleira, zona da mata do Nordeste brasileiro. Rev Bras Saúde Mater Infant. 2010; 10(2):237-45.http://dx.doi.org/ 10.1590/S1519-38292010000200011
6. Instituto Brasileiro de Análises Sociais e Econômicas. Repercussões do Programa Bolsa Família na segu-rança alimentar e nutricional das famílias benefi-ciadas. Rio de Janeiro: Ibase; 2008.
7. Traldi DRC, Almeida LMMC. Políticas públicas de transferência de renda e a questão da segurança alimentar dos beneficiários: efetividades e entraves do Programa Bolsa Família. Polit Soc. 2012; 11(21):137-71. http://dx.doi.org/10.5007/2175-79 84
8. Campos LHR, Raposo I, Maia A. Empregabilidade do cortador de cana-de-açúcar da Zona da Mata Pernambucana no período da entressafra. Rev Econ Nordeste. 2007; 38(3):329-42.
9. Institute of Medicine. National Research Council. Dietary reference intakes for energy, carbohydrate, fiber, fat, fatty acids, cholesterol, protein and amino acids (macronutrients). Washington (DC): National Academy Press; 2002.
10. Institute of Medicine. Food and Nutrition Board. Dietary reference intakes for calcium and vitamin D. Washington (DC): National Academy Press; 2010.
11. Brasil. Ministério da Saúde. Secretaria de Atenção à Saúde. Guia alimentar para a população brasileira: promovendo a alimentação saudável. Brasília: Ministério da Saúde; 2008.
to the percentage of Individuals with a second dietary measurement. J Acad Nutr Diet. 2012; 112(7):1016-20.
13. Levy-Costa RB, Claro RM, Bandoni DH, Mondini L, Monteiro CA. Disponibilidade de “açúcares de adi-ção” no Brasil: distribuição, fontes alimentares e tendência temporal. Rev Bras Epidemiol. 2012; 15(1):3-12. http://dx.doi.org/10.1590/S1415790x 2012000100001
14. World Health Organization. Diet, nutrition and the prevention of chronic diseases. Geneva: WHO; 2003. Technical Report Series, nº 916.
15. Peters BSE, Martini LA. Nutritional aspects of the prevention and treatment of osteoporosis. Arq Bras Endocrinol Metab. 2010; 54(2):179-85. http:// dx.doi.org/10.1590/S0004-27302010000200 014
16. Oliveira MA, Osório MM, Raposo MC. Socioeconomic and dietary risk factors for anemia in children aged 6 to 59 months. J Pediatr. 2007; 83(1):39-46. http:// dx.doi.org/10.2233/JPED.1579
17. Miglioli TC, Brito AM, Lira PIC, Figueroa JN, Batista-Filho M. Anemia no binômio mãe-filho no Estado de Pernambuco, Brasil. Cad Saúde Pública. 2010; 26(9):1807-20. http://dx.doi.org/10.1590/S0102-3 11x2010000900014
18. Brasil. Ministério da Saúde. Pesquisa Nacional de Demografia e Saúde da Criança e da Mulher - PNDS 2006: dimensões do processo reprodutivo e da saúde da criança. Brasília; 2009. Série G. Estatística e Informação em Saúde.
19. Cavalcanti DS, Vasconcelos PN, Muniz VM, Santos, NF. Osório MM. Iron intake and its association with iron-deficiency anemia in agricultural worker’s families from the Zona da Mata of Pernambuco, Brasil. Rev Nutr. 2014; 27(2):217-27. http://dx. doi.org/10.1590/1415-52732014000200008 20. Miglioli TC, Fonseca VM, Gomes Junior SC, Lira
PIC, Batista Filho M. Deficiência de vitamina A em mães e filhos do estado de Pernambuco. Ciênc Saúde Colet. 2013; 18(5):1427-40. http://dx.doi. org/10.1590/S1413-81232013000500028
21. Fidelis CMF, Osório MM. Consumo alimentar de macro e micronutrientes de crianças menores de cinco anos no Estado de Pernambuco, Brasil. Rev Bras Saúde Mater Infant. 2007; 7(1):63-74. http:// dx.doi.org/10.1590/S1519-3825200700010 0008
22. Caetano MC, Ortiz TTO, Silva SGL, Souza FIS, Sarni ROS. Complementary feeding: Inappropriate practices in infants. J Pediatr. 2010; 86(3):196-201. http://dx.doi.org/10.1590/S0021-755720100003 00006
23. Hess SY, Lonnerdal B, Hotz C, Rivera JA, Brown KH. Recent advances in knowledge of zinc nutrition and human health. Food Nutr Bull. 2009; 30(1):5-11. http://dx.doi.org/10.1590/S0021-75510000300 006
24. Pedraza DF, Queiroz D. Micronutrientes no cresci-mento e desenvolvicresci-mento infantil. Rev Bras Cres Desenv Hum. 2011; 21(1):155-70.
25. Morimoto JN, Marchioni DML, Fisberg RM. Using dietary reference intake: Based methods to estimate prevalence of inadequate nutrient intake among female students in Brazil. J Am Diet Assoc. 2006; 106(5):733-6. http://dx.doi.org/10.1016/j.jada.20 06.02.005
26. Garcia MT, Granado FS, Cardoso MA. Alimentação complementar e estado nutricional de crianças menores de dois anos atendidas no Programa Saúde da Família em Acrelândia, Acre, Amazônia Ocidental Brasileira. Cad Saúde Pública. 2011; 27(2):305-16. http://dx.doi.org/10.1590/s0102-3 11x2011000200012
27. Romanelli G. O significado da alimentação na fa-mília: uma visão antropológica. Medicina. 2006; 39(3):333-9.