Comparison between PSA Density, Free PSA Percentage and
PSA Density in the Transition Zone in the Detection of Prostate
Cancer in Patients with Serum PSA between 4 and 10 ng/mL
Emerson P. Gregorio, Joao P. Grando, Eufanio E. Saqueti, Silvio H. Almeida, Horacio A. Moreira, Marco A. Rodrigues
Section of Urology, Department of Surgery, Health Sciences Center, State University of Londrina, UEL, Londrina, Parana, Brazil
ABSTRACT
Objective: Compare the capacity of the PSA density (PSAD), Free PSA percentage (%FPSA) and PSA transition zone
density (PSATZ) in improving the sensitivity and specificity of the PSA to detect prostate cancer (PCa) in men with a PSA between 4 and 10 ng/mL.
Materials and Methods: One hundred and forty five men with PSA between 4 and 10 ng/mL were prospectively studied.
Blood collection for the total PSA and free PSA was performed as well as transrectal ultra-sound with prostate biopsy and measurement of the total prostate volume (TPV) and transition zone volume (TZV). Patients with initial negative biopsy were followed and the prostate biopsy was repeated in those that presented PSA increase. The capacity of the PSAD, %FPSA and PSADTZ in improving the sensitivity and specificity pf the PSA test to the detection of the PCa was assessed by univariate and multivariate analyses and through the ROC curve.
Results: Of the 145 patients, 38 (26.2%) had PCa and in 107 (73.8%) a benign prostate disease was diagnosed. No difference
among the PSAD, %FPSA and PSADTZ was found. The multivariate analysis showed that the PSADTZ, %FPSA, TZV and age were those more powerful and highly significant PCa predictors.
Conclusion: The determination of %FPSA and PSAD can allow a better discrimination between PCa and benign disease
that the isolated use of PSA. The combination of PSADTZ, %FPSA, TZV and age promote a high accuracy for PCa detection.
Key words: prostate; prostate-specific antigen; prostatic neoplasms; prostatic hyperplasia; biopsy; diagnosis Int Braz J Urol. 2007; 33: 151-60
INTRODUCTION
The prostate cancer (PCa) is the second most frequent tumor in Brazilian men (1). For the PCa di-agnosis a prostate biopsy is needed, however it is an invasive method that should be avoided in men with low probability of carrying a PCa (2). The
val-ues can also be observed in benign diseases such as benign prostate hyperplasia (BPH) and prostatitis (4). More than 80% of men that present high PSA are in the range between 4.0 and 10.0 ng/mL (5). From those, approximately 2/3 when investigated for prostate biopsy present benign conditions. Recently, various strategies were introduced to improve the sensitivity and specificity of the PSA. Among those, we can highlight PSA density, speed of PSA increase, distribution of serum PSA levels according to age and the determination of molecular forms of PSA (6).
The free to total PSA ratio (R FPSA / TPSA) have emerged as the most useful clinical method to improve specificity and sensitivity to detect the PCa (2). The value of the other concepts derived from the above-mentioned PSA is still controversial and sub-ject to considerable debate (2).
Kalish et al. (7) introduced the concept of tran-sition zone PSA (PSA divided by the trantran-sition zone volume); however, this concept brings discussions (8). In this way, we have aimed, in this study, the comparison of the capacity of PSA density, percent-age of free PSA and PSA density in the transition zone in improving the PSA sensitivity and specificity to detect the PCa in men with PSA between 4 and 10 ng/mL.
MATERIALS AND METHODS
We have included in this study patients at-tended consecutively at the urology outpatient clinic from our university that presented with serum PSA between 4 and 10 ng/mL. We have excluded patients with urinary tract infection, bearing a vesical cath-eter, in urinary retention, with clinical signals of acute prostatitis, with a PCa history, previous prostate sur-gery of any nature, hormonal manipulation or using finasteride.
Between February 2000 and April 2004, the population of the study consisted of 145 men with a mean age of 68.04 ± 8.81 years. After obtaining the informed consent all patients were submitted to blood collection, digital rectal examination and transrectal ultrasonography of the prostate with biopsy.
The blood samples were collected before any manipulation of the prostate, and free and total PSA serum concentrations were dosed in the same samples using “AxSYM Total PSA and Free PSA Assay”, by the MEIA method (microparticle enzyme immunoas-says) according to the orientations of the lab (Abbot Laboratories, Abbott Park, IL 60064).
Digital rectal examination was performed and classified as suspect or non-suspect for neoplasia.
Transrectal ultrasonography of the prostate was performed using an endocavitary convex probe with a 6.5 MHz transducer (Hitachi - model EVP-V33). Measures of the tri-axial distances of the pros-tate and its transitional zones were taken in its larger diameter and the volumes, both total and of the pros-tate transitional zone, were calculated by the follow-ing formula: volume = 0.52 x transverse diameter x anteroposterior diameter x longitudinal diameter. The sextant prostate biopsy was performed added to two biopsies of the transition zone and of possible suspi-cious area during transrectal ultrasonography. A 22 mm (Manan pro-mag 2.2) automatic pistol was used and a 25 cm x 18 gauche (Manan ACN 1825 MF) biopsy needle. The product of the biopsy was submit-ted to pathological exam through the hematoxylin-eosin exam and the findings were classified as positives for PCa, nodular hyperplasia (NH), NH associated with a focus of chronic prostatitis, NH with atrophy, pres-ence of atypical glands (ASAP) or prostatic intraepithelial neoplasia (PIN).
Patients with evidence of PCa in the initial biopsy were followed (mean follow-up time of 24.2 ± 15.2 months) and those that presented a PSA increase (19 patients), ASAP (10 patients) and/or PIN (2 pa-tients) were submitted to a new biopsy, being that, in some patients we have performed up to four biopsies of the prostate and the mean number of fragments obtained in the biopsy per patient, at the end of the study was of 9.7 ± 3.82 fragments.
In the patients submitted to a new biopsy it was used for statistical analysis the values of the total PSA, free PSA, TPV, TZV and the result of the patho-logical exam assessed in the last biopsy.
expressed in ng/mL/cc and calculated dividing the to-tal PSA by TPV and TZV, respectively.
For statistical analysis, the SPSS program (SPSS for Windows release 10.0.1. 1999. Chicago: SPSS Inc.) was used. Since all continuous variables did not present a normal distribution by the Shapiro-Wilk test, it was applied, to compare the groups’ me-dian the Mann-Whitney U test (to compare 2 groups) and the Kruskal-Wallis test (to compare 3 or more groups) and to establish correlations the Spearman coefficient. A multivariate logistics regression model (MLRM) analysis was employed to assess the ca-pacity of the different variables (age, digital rectal examination with suspicion of neoplasia, presence of hypoechogenic lesions to transrectal ultrasonography, TPV, TZV, total PSA, free PSA, %FPSA, PSAD and PSADTZ) in predicting PCa. As a selection method for the variables the stepwise regression was applied, considering as significant p < 0.05 and removal of the variable of the model when p > 0.10. The MLRM allowed the calculation of a predictive PCa probabil-ity for each patient individually.
The statistical program Medcalc for Win-dows version 8.1.0.0 (Medcalc Software, Mariakerke, Belgium) was used to demonstrate the best cut-off point for each diagnosis test (PSA, PSAD, PSADTZ, %FPSA and MLRM) as well as to calculate its respective positive predictive values (PPV), negative predictive values (NPV), sensitivi-ties and specificisensitivi-ties to predict PCa. The sensitivity of each diagnosis test was calculated for each cut-off point, dividing the number of patients without PCa and which test was negative by the total of patients without PCa. The ROC (Receiver Operating Char-acteristics) curve was employed to graphically dem-onstrate the sensitivities and specificities of the dif-ferent diagnostic tests. The areas bellow the ROC curve (global accuracy) of the 5 diagnostic tests were also calculated and compared, in pairs, through the software Medcalc as described by Hanley & McNeil (9). To calculate the PPV, NPV, sensitivity, specific-ity and global accuracy of the MLRM the PCa pre-ventive probability supplied by MLRM was used. All statistical analysis was performed considering p < 0.05 statistically significant and with a 95% trust in-terval.
RESULTS
In the first prostate biopsy, performed in the 145 patients, the adenocarcinoma was diagnosed in 29 patients (20%). In the repetition of prostate biopsy, the adenocarcinoma was diagnosed in 6 of the 19 patients (32%) that, during the follow-up period, pre-sented an increase of the PSA, in 1 of the 2 patients (50%) with PIN and in 2 of the 10 patients (20%) that presented ASAP at the initial biopsy. At the end of the study, after repeat prostate biopsy in 31 of the 145 patients, the adenocarcinoma of the prostate was di-agnosed in 38 patients (26%), nodular hyperplasia (NH) in 38 patients (26%), NH with prostate atrophy in 27 patients (19%) and NH with non-specific chronic prostatitis focuses in 42 patients (29%).
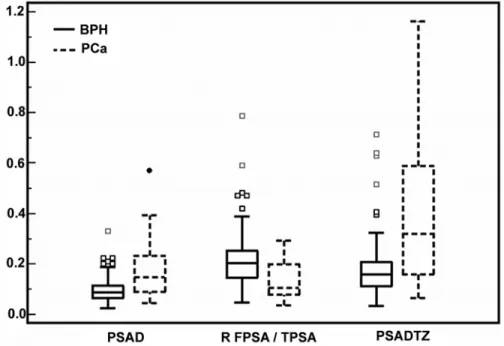
Considering the three groups of patients with-out PCa (NH, NH with chronic prostatitis focuses, NH with atrophy), there was no statistically signifi-cant difference among them in relation to the median age, PSA, %FPSA, TPV, TZV, PSAD and PSADTZ (Table-1), allowing, grouping those patients in a sole group named “Benign Prostatic Hyperplasia” (BPH) group for the purpose of statistical analysis. Thus, at the end of the study it was observed that the PCa was diagnosed in 38 patients (26%) and the BPH was diagnosed in 107 patients (74%). The characteristics of those patients and the comparison between both groups (PCa and BPH) are presented on Figure-1 and Table-2.
The results of the digital rectal examination and the presence of peripheral zone hypoechogenic lesions to transrectal ultrasonography are presented respectively on Tables -3 and 4. The TZV was com-pared to the TPV showing a linear positive relation between both volumes with a Spearman correlation coefficient of 0.919 (Trust interval 0.889 - 0.942) (Fig-ure-2).
Table 2 – Median, mean and standard deviation (SD) of the age (years), serum concentration of PSA (ng/mL), %FPSA
(%), TPV (cc), TZV (cc), PSAD (ng/mL/cc) and PSADTZ (ng/mL/cc) in patients with BPH and PCa.
Age 67.00 67.56 (08.73) 69.50 69.39 (09.02) < 0.290 PSA 05.70 06.20 (01.72) 07.17 07.12 (01.83) < 0.008 %FPSA 20.00 25.12 (10.95) 10.00 13.45 (07.26) < 0.001 TPV 70.00 75.36 (33.09) 46.00 51.84 (31.71) < 0.001 TZV 38.00 43.62 (23.80) 22.20 29.56 (24.41) < 0.001 PSAD 00.08 00.09 (00.04) 00.14 00.18 (00.11) < 0.001 PSADTZ 00.15 00.18 (00.11) 00.32 00.40 (00.29) < 0.001
Median Mean (SD) Median Mean (SD)
Variable BPH - 107 patients (73.8%) PCa - 38 patients (26.2%) p Value*
*Mann-Whitney U test
Table 1 – Median, mean, standard deviation (SD) and comparisons among 3 groups of patients presenting benign
alterations of the prostate in relation to age (years), serum concentration of PSA(ng/mL), %FPSA (%), TPV (cc), TZV (cc), PSAD (ng/mL/cc) and PSADTZ (ng/mL/cc).
Age 67.00 65.75 (09.15) 65.00 66.37 (08.58) 71.50 69.78 (08.18) 0.051 PSA 05.20 06.18 (02.06) 05.47 06.02 (01.74) 05.90 06.26 (01.37) 0.482 %FPSA 20.00 22.10 (12.59) 22.00 21.77 (10.39) 20.00 22.74 (10.01) 0.863 TPV 70.00 72.77 (28.62) 64.00 71.75 (28.43) 74.00 80.44 (39.29) 0.711 TZV 42.00 41.10 (19.57) 37.00 42.20 (19.62) 41.00 47.08 (29.33) 0.830 PSAD 00.09 00.09 (00.03) 00.08 00.09 (00.05) 00.08 00.09 (00.05) 0.900 PSADTZ 00.15 00.19 (00.14) 00.13 00.16 (00.07) 00.16 00.18 (00.11) 0.942
Median Mean (SD) Median Mean (SD) Median Mean (SD) Nodular Hyperplasia (NH) NH with Atrophy NH with Focuses of
Chronic Prostatitis
p Value*
*Kruskal Wallis Test.
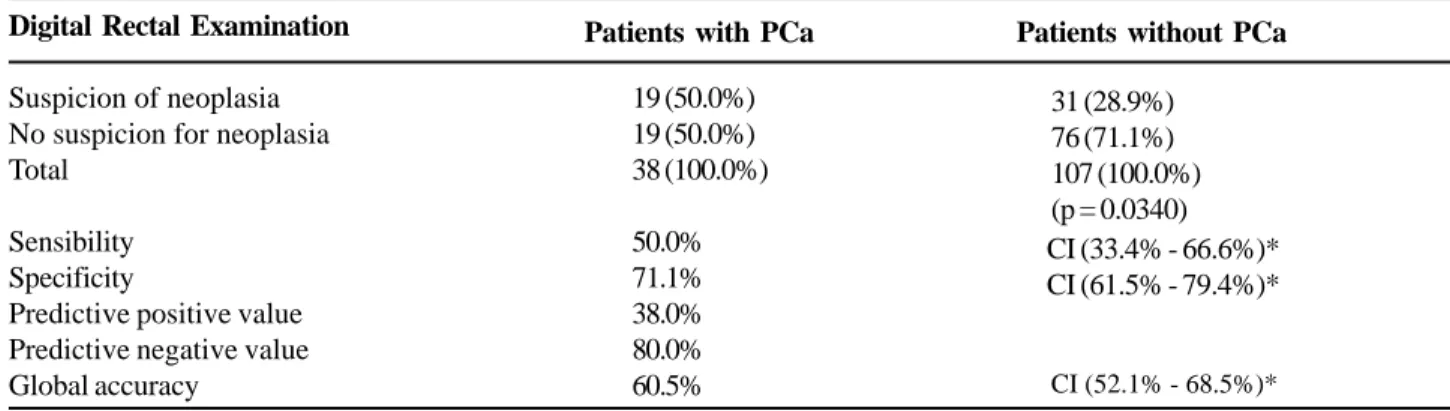
Table 3 – Relation between the digital rectal examination with suspicion of neoplasia and the PCa diagnosis.
Digital Rectal Examination
Suspicion of neoplasia No suspicion for neoplasia Total
Sensibility Specificity
Predictive positive value Predictive negative value Global accuracy
Patients with PCa Patients without PCa
31 (28.9%) 76 (71.1%) 107 (100.0%) (p = 0.0340)
CI (52.1% - 68.5%)*
19 (50.0%) 19 (50.0%) 38 (100.0%)
50.0% 71.1% 38.0% 80.0% 60.5%
*CI = 95% confidence interval.
Figure 1 – Box Plot graph showing the PSA density (PSAD) median values distribution in ng/mL/cc, free PSA/ total PSA ratio (RPSALT) and PSA density in the transition zone (PSADTZ) in ng/mL/cc, in patients with prostate cancer (PCa) and benign prostatic hyperplasia (BPH).
Table 4 – Relation between the presence of hypoechogenic nodes in the prostate peripheral zone by transrectal
ultra-sound and PCa diagnosis.
Hypoechogenic Node by Transrectal Ultrasound
Present Absent Total
Sensibility Specificity
Predictive positive value Predictive negative value Global accuracy
Patients with PCa
22 (57.9%) 16 (42.1%) 38 (100.0%) 57.9% 70.1% 40.7% 82.4% 64.0%
Patients with PCa
32 (29.9%) 75 (70.1%) 107 (100.0%) (p = 0.0045)
CI (40.8% - 73.7%)* CI (60.5% - 78.6%)*
CI (55.6% - 71.8%)*
*CI = 95% confidence interval.
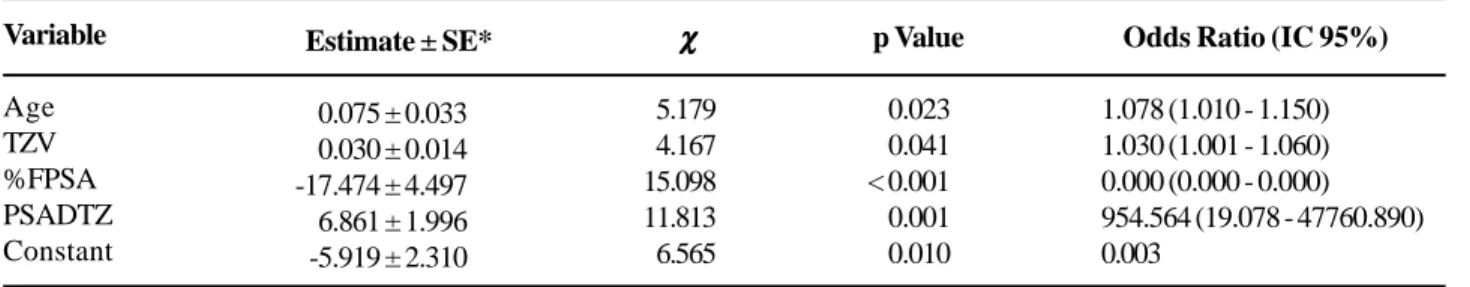
Table 5 – Multivariate logistic regression model (MLRM)
Variable Age TZV %FPSA PSADTZ Constant
Estimate ± SE*
-00.075 ± 0.033
-00.030 ± 0.014 -17.474 ± 4.497
-06.861 ± 1.996
0-5.919 ± 2.310
χ χ χ χ χ 05.179 04.167 15.098 11.813 06.565 p Value <0.023 <0.041 < 0.001 <0.001 <0.010
Odds Ratio (IC 95%)
1.078 (1.010 - 1.150) 1.030 (1.001 - 1.060) 0.000 (0.000 - 0.000) 954.564 (19.078 - 47760.890) 0.003
*SE = Standard error.
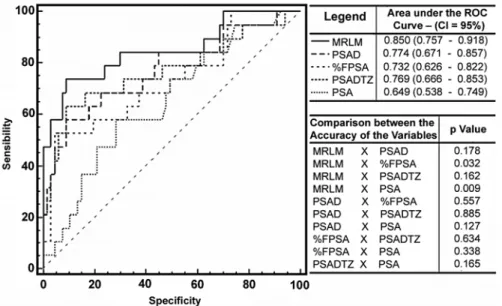
The Figure-3 represent the ROC curves pro-duced by the PCa predictive probability of the MLRM and by variables PSAD, %FPSA, PSADTZ and PSA as well as the area bellow the ROC curve (global accuracy), their respective trust intervals and the com-parison of the different areas. Table-6 represent the area bellow the different ROC curves obtained with their respective standard errors and trust intervals, as well as the value of the cut-off point localized above and to the right of each curve (the best cut-off point) and their respective PPV, NPV, sensitivity and speci-ficity.
For a 95% sensitivity to detect PCa, speci-ficities for PSA, PSADTZ, %FPSA, PSAD and MLRM were respectively: 12.8%, 21.3%, 26.6%, 27.7% and 28.7%.
Figure-4 represent the ROC curves produced by MLRM, PSAD, %FPSA, PSADTZ and PSA as well as the area bellow the ROC (global accuracy), their respective trust intervals and the comparison of the different areas in the 95 patients that presented a digital rectal examination without a suspicion of neo-plasia.
COMMENTS
re-garding the relation between alterations of the PSA serum concentration and the presence of atrophy and/ or prostate inflammation is very limited and contro-versial (10-12), thus, the concern in analyzing if the
patients with focuses of chronic prostatitis or atrophy were distinct from the patients without such alterations, and it was also a differential of this study as Table-1 makes it evident.
Figure 3 – Receiver Operating Characteristic (ROC) curve and comparison between the areas bellow the ROC curve (accuracy) produced by the multivariate logistic regression model (MLRM), PSA density (PSAD), percentage of the free PSA (%FPSA), PSA density in the transition zone (PSADTZ) and PSA.
Among articles recently published about the detection of PCa, few (6,8,13-19) are the ones that analyze and compare, through the ROC curve, the accuracies of the PSA, PSAD, %FPSA and PSADTZ, at the same time, in the range of PSA between 4 and 10 ng/mL.
Considering global accuracy, such as in this study, the majority of the investigators (6,13-15) has demonstrated advantage in the use of the concept of %FPSA in relation to the isolated use of PSA for the detection of PCa. Only Kikuchi et al. (16) did not con-firm this superiority. As in this study the majority of the authors (8,13,15-17) agrees that the accuracy of PSAD is superior to PSA for the detection of the PCa, even though these results could not be reproduced by other authors (6,14,18).
Even though some advantage of the %FPSA has been demonstrated in relation to the PSAD (6,14). In this study, as well as in others (13,15,16), the con-cepts of PSAD and %FPSA did not present statisti-cally significant difference when the accuracies for the detection of PCa. However, the use of the %FPSA in relation to PSAD presents advantages, because it can eliminate the costs and the invisibility of the transrectal ultrasonography procedure, that is required to measure the prostate volume (6). On the other hand, the numeric volume of the best %FPSA rate remains unknown and these volumes can be influenced by the type of essay used, the prostate size, age and varia-tions in PSA measurement (3,13).
In 1994, Kalish et al. (7) introduced the con-cept of PSADTZ to improve the PSA accuracy in predicting the results of a positive prostate biopsy for PCa. Further on Djavan and collaborators (6,13) dem-onstrated that the PSADTZ would be more efficient than all the other concepts derived from the PSA. However, this supposed advantage has been ques-tioned, since these results could not be reproduced. In the present study In the present study, as in others (8,14,15,17), the concept of PSADTZ did not present global accuracy superior to the concepts of PSAD and %FPSA. Kikuchi et al. (16) found a superiority of the concept of PSADTZ in relation to %FPSA, however the PSADTZ was not better than the PSAD. On the other hand, Ferreira and collaborators (19) found a superiority of the PSADTZ in relation to the PSAD, however the PSADTZ was not better than the %FPSA.
There are many reasons to explain the dis-crepancies of results of different investigators in re-lation to the accuracy of various concepts deriving from the PSA. They include variations in the mea-surements of the total PSA, free PSA and prostate volume by transrectal ultrasonography, the use of inadequate methodologies and statistics and errors of sampling in the fragment of prostate biopsy. The errors in the biopsy regard the fact that in smaller prostates the possibility of obtaining positive frag-ments for PCa is higher than in larger prostates (8). This is reinforced by the observation of Lin et al. (8)
Table 6 – Area bellow the ROC curve (global accuracy) and sensibility, specificity, predictive positive value(PPV) and
negative predictive value (NPV) for the cut-off points that have produced the best sensibility and specificity rates (cut-off point a little above and to the left of the curve).
PSA 0.641 0.054 0.535 - 0.747 =0.013 > 6.791 60.5 70.1 41.8 83.3 PSADTZ 0.744 0.053 0.640 - 0.848 < 0.001 > 0.2107 67.6 77.8 53.2 86.5 PSAD 0.762 0.049 0.666 - 0.858 < 0.001 > 0.1157 68.4 78.8 54.2 87.2 %FPSA 0.767 0.050 0.668 - 0.865 < 0.001 ≤ 11.3 % 55.6 93.1 74.1 85.6 MLRM 0.840 0.045 0.753 - 0.927 < 0.001 75.0 86.2 67.5 90.0
Area Standard Error
95% Confidence
Interval
p Value Cut-off Point Value
% Sensibility
% Specificity
% PPV % PNV
that revising various works on the PSAD and PSADTZ they observed that, in almost all of them as well as in the present study (Table-2), the vol-umes of the prostates that presented malignancy were significantly smaller than the volume of the benign glands. Some authors suggest increasing the number of fragments in larger prostates in 50 cc, to correct those sampling errors (20).
As in the article of Djavan et al. (13) in this study, in the multivariate analysis the PSADTZ and the %FPSA, were the two variables most strongly predictors of PCa, being that the PSADTZ was the variable that presented the largest predicting power, concurring with the result of the others (2,4,6,7,13,16,19).
It is important highlight that, in the present study, in the univariate analysis, even though the PSADTZ, does not offer additional information in relation to the isolated use of the PSA the TZV mea-sure and the PSADTZ calculation can collaborate to increase the accuracy of the diagnostic tests to detect the PCa, since in the multivariate analysis the PSADTZ was a strongly PCa predictive variable and the MLRM produced a high global accuracy (84%) to predict PCa, being that superior to the concepts of %FPSA, PSADTZ and PSA, when used isolatedly.
CONCLUSIONS
The determination of %FPSA and PSAD can allow a better discrimination between PCa and BPH than the isolated use of the PSA in patients with PSA levels between 4 and 10 ng/mL. The vari-ous concepts deriving from the PSA (%FPSA, PSAD and PSADTZ) present a similar accuracy to detect the PCa. The combination of PSADTZ, %FPSA, TZV and age, promote an increase in the prediction of PCa.
CONFLICT OF INTEREST
None declared.
REFERENCES
1. Brasil. Ministério da Saúde. Secretaria de Atenção à Saúde. Instituto Nacional de Câncer. Coordenação de Prevenção e Vigilância: Estimativa 2006: Incidência de câncer no Brasil. Rio de Janeiro. INCA, 2005; p. 34. 2. Djavan B, Remzi M, Zlotta A, Seitz C, Snow P, Marberger
M: Novel artificial neural network for early detection of prostate cancer. J Clin Oncol. 2002; 20: 921-9. 3. Catalona WJ, Partin AW, Slawin KM, Brawer MK,
Flanigan RC, Patel A, et al.: Use of the percentage of free prostate-specific antigen to enhance differentia-tion of prostate cancer from benign prostate disease: a prospective multicenter clinical trial. JAMA. 1998; 279: 1542-7.
4. Zlotta AR, Djavan B, Marberger M, Schulman CC: Pros-tate specific antigen density of the transition zone: a new effective parameter for prostate cancer prediction. J Urol. 1997; 157: 1315-21.
5. Catalona WJ, Richie JP, Ahmann FR, Hudson MA, Scardino PT, Flanigan RC, et al.: Comparison of digital rectal examination and serum prostate specific antigen in the early detection of prostate cancer: results of a multicenter clinical trial of 6,630 men. J Urol. 1994; 151: 1283-90.
6. Djavan B, Zlotta A, Remzi M, Ghawidel K, Basharkhah A, Schulman CC, et al.: Optimal predictors of prostate cancer on repeat prostate biopsy: a prospective study of 1,051 men. J Urol. 2000; 163: 1144-8; discussion 1148-9. 7. Kalish J, Cooner WH, Graham SD Jr: Serum PSA
ad-justed for volume of transition zone (PSAT) is more accurate than PSA adjusted for total gland volume (PSAD) in detecting adenocarcinoma of the prostate. Urology. 1994; 43: 601-6.
8. Hanley JA, McNeil BJ: A method of comparing the areas under receiver operating characteristic curves derived from the same cases. Radiology. 1983; 148: 839-43.
9. Schatteman PH, Hoekx L, Wyndaele JJ, Jeuris W, Van Marck E: Inflammation in prostate biopsies of men with-out prostatic malignancy or clinical prostatitis: corre-lation with total serum PSA and PSA density. Eur Urol. 2000; 37: 404-12.
10. Kwak C, Ku JH, Kim T, Park DW, Choi KY, Lee E: Effect of subclinical prostatic inflammation on serum PSA lev-els in men with clinically undetectable prostate cancer. Urology. 2003; 62: 854-9.
his-tologically confirmed benign prostatic hyperplasia: a retrospective analysis. Eur Urol. 2003; 43: 164-75. 12. Djavan B, Zlotta AR, Byttebier G, Shariat S, Omar M,
Schulman CC: Prostate specific antigen density of the transition zone for early detection of prostate cancer. J Urol. 1998; 160: 411-8; discussion 418-9.
13. Okegawa T, Noda H, Nutahara K, Higashihara E: Com-parison of two investigative assays for the complexed prostate-specific antigen in total prostate-specific an-tigen between 4.1 and 10.0 ng/mL. Urology. 2000; 55: 700-4.
14. Egawa S, Suyama K, Matsumoto K, Kuwao S, Baba S: Prospective evaluation of prostate cancer detection by prostate specific antigen related parameters: com-parison in serum and plasma samples. J Urol. 2002; 167: 97-102.
15. Kikuchi E, Nakashima J, Ishibashi M, Ohigashi T, Asakura H, Tachibana M, et al.: Prostate specific anti-gen adjusted for transition zone volume: the most pow-erful method for detecting prostate carcinoma. Cancer. 2000; 89: 842-9.
16. Maeda H, Arai Y, Ishitoya S, Okubo K, Aoki Y, Okada T: Prostate specific antigen adjusted for the transition zone volume as an indicator of prostate cancer. J Urol. 1997; 158: 2193-6.
17. Lin DW, Gold MH, Ransom S, Ellis WJ, Brawer MK: Transition zone prostate specific antigen density: lack of use in prediction of prostatic carcinoma. J Urol. 1998; 160: 77-81; discussion 81-2.
18. Kurita Y, Terada H, Masuda H, Suzuki K, Fujita K: Pros-tate specific antigen (PSA) value adjusted for transi-tion zone volume and free PSA (gamma-seminoprotein)/PSA ratio in the diagnosis of prostate cancer in patients with intermediate PSA levels. Br J Urol. 1998; 82: 224-30.
19. Ferreira MD, Koff WJ: Assessment of serum level of prostate-specific antigen adjusted for the transition zone volume in early detection of prostate cancer. Int Braz J Urol. 2005; 31: 137-45; discussion 146.
20. Presti JC Jr, Hovey R, Carroll PR, Shinohara K: Pro-spective evaluation of prostate specific antigen and prostate specific antigen density in the detection of nonpalpable and stage T1C carcinoma of the prostate. J Urol. 1996; 156: 1685-90.
Accepted after revision: October 31, 2006
Correspondence address:
Dr. Emerson Pereira Gregório Rua Mato Grosso 1794
Londrina, Paraná, 86010-180, Brazil Fax: + 55 43 3323-5823