Marcos Valério Coimbra Resende, Marcelo Luiz Campos Vieira, Fernando Bacal, José Lázaro Andrade,
Noedir A. Stolf, Edmar Alcides Bocchi
Instituto do Coração (InCor), Universidade de São Paulo, São Paulo, SP - Brazil
Mailing address: Marcelo Luiz Campos Vieira •
Rua Cardoso de Melo, 463/21 - Vila Olímpia - 04548-002 - São Paulo, SP - Brazil
E-mail: [email protected], [email protected]
Manuscript received October 24, 2010; revised manuscript received January 03, 2011; accepted January 07, 2011.
Abstract
Background: Endomyocardial biopsy (EMB) is the gold standard method for the diagnosis of cellular rejection (CR) after heart transplantation (HT).
Objective: To test the hypothesis that tissue Doppler imaging (TDI) could detect CR ≥ 3A and add diagnostic information
compared to conventional Doppler.
Methods: Fifty-four HT patients underwent 129 EMB and a TDI echocardiographic study within 24 hours. We compared HT patients with CR ≥ 3A versus HT patients with CR < 3A, with a normal matched control group (13 patients). We measured TDI systolic (S), early diastolic (e’), late diastolic (a’) velocities and e’/a’ ratio in the left ventricular annulus, basal and medium (mid) segments of the septal (SEP), lateral (LAT), inferior (INF), anterior (ANT) walls; and in the right ventricular annulus.
Results: HT patients showed CR ≥ 3A in 39/129 (30.2%) EMB. The best isolated predictor for CR diagnosis was a’LAT,
with a sensitivity of 76.3%, specificity of 73.8% (p = 0.001). In the multivariate analysis, a’LAT (p = 0.001), a’SEP (p = 0.002), e’/a’ LAT ratio (p = 0.006), e’Mitral/ e’LAT ratio (p = 0.014), SINF (p = 0.009) predicted CR ≥ 3A. We obtained a score with a sensitivity of 88.2%, accuracy of 79.6% and negative predictive value of 92.9% to diagnose CR ≥ 3A. Conventional Doppler (mitral and pulmonary venous flow) was not relevant to predict CR > 3A.
Conclusion: TDI added diagnostic information to predict CR ≥ 3A compared to conventional Doppler. A TDI-based
model could become a potential method to detect CR ≥ 3A after heart transplantation. (Arq Bras Cardiol. 2011; [online]. ahead print, PP.0-0)
Keywords: Echocardiography, Doppler; diagnosis; graft rejection; heart transplantation.
Introduction
Despite advances in immunosuppressive therapy over the past decade, acute cellular rejection (CR) of the donor heart remains an important factor related to long-term morbidity and mortality1,2 . Many noninvasive techniques for rejection
diagnosis have been investigated, but none was found to be sufficiently reliable to replace endomyocardial biopsies (EMB) in clinical practice3.
However, routine biopsy is a major inconvenience to the patients and is also risky and costly. The strategy of performing biopsies after the first year post-transplant has been questioned and attempts to reduce their frequency have also been reported. Nevertheless, rejection surveillance is extensively based on EMB performed at predefined intervals4.
Tissue Doppler imaging (TDI) is an echocardiographic technique that enables the measurement of systolic and
diastolic velocities within the myocardium. TDI may increase the accuracy of conventional Doppler echocardiography because it integrates information on regional function to estimate global cardiac function and it does not seem to be strongly affected by varying preload conditions5. As left
ventricular diastolic dysfunction is an early event during allograft rejection, this technique may be useful to detect rejection non-invasively6.
However, the role of TDI in the evaluation of subjects after heart transplantation (HT) and for the diagnosis of CR remains unclear7-9. Thus, the purpose of this study was to investigate
TDI abnormalities in myocardial relaxation and contraction velocities in HT patients, and also to analyze the additional TDI diagnostic information compared to conventional Doppler concerning significant CR.
Methods
Study population
Between December 2001 and April 2004, 59 consecutive
patients aged ≥ four years old submitted to HT were referred
after surgery. Patients had been submitted to orthotopic HT due to heart failure of any etiology. Exclusion criteria included patients with inadequate echocardiographic imaging, LV wall motion abnormalities, presence or suspicion of humoral rejection, graft vascular disease, EMB with evidence of Chagas’ disease reactivation, EMB with inconclusive diagnosis and atrial fibrillation.
The final study population consisted of 54 patients (34.9 ± 20.7), ranging from 4 to 70 years old, 39 males (72.2%), with an average of 354 (ranging from 7 to 3570) days post-HT when undergoing the EMB. The HT etiologies were dilated idiopathic cardiomyopathy, 19/54 (35.2%), Chagas’ disease, 16/54 (29.6%), ischemic cardiomyopathy, 6/54 (11.1%). A bicaval surgical technique was performed in 42 patients (77.8%). The study protocol was approved by the Hospital scientific and ethical research committee and all participants signed an informed consent.
Study design
This was a cross-section study followed by a prospective phase involving HT patients who underwent EMB, matched with a group of normal volunteers. All patients underwent EMB and a TDI echocardiographic study, performed within 24 h after the EBM. The researchers involved in these two procedures were blinded to the results of the other technique. Cellular rejection was considered following the International Society of Heart and Lung Transplantation (ISHLT) criteria10,11, as
follows: grade 0 = no rejection; grade IA = focal (perivascular or interstitial) infiltrate without myocyte damage; grade IB = diffuse, but sparse infiltrate without myocyte damage; grade II = one focus only with aggressive infiltrates and/or myocyte damage; grade IIIA = multifocal aggressive infiltrates and/ or myocyte damage; grade IIIB = diffuse inflammatory process with myocyte necrosis; grade IV = diffuse aggressive polymorphous infiltrate with hemorrhage and myocyte necrosis. The findings of the echocardiographic study were correlated with the results of the EMB, taking into consideration
the presence or absence of significant CR (CR ≥ 3A)10,11.
In patients who underwent more than one EMB, variations in myocardial TDI were analyzed in order to compare the different histopathological exams. The control group was comprised of 13 healthy volunteers matched by age and sex, without symptoms and previous history of cardiac diseases. Clinical examination, electrocardiogram at rest and the echocardiogram were considered to be normal.
Endomyocardial biopsy
The EMB were carried out in accordance with the protocol adopted in the institution, as follows: weekly during the first month of HT and afterwards at greater intervals according to clinical suspicion of CR. The analyses were carried out according to the criteria of the International Society for the Heart and Lung Transplantation (ISHLT) standardized cardiac biopsy grading11.
Echocardiographic study
Examinations were recorded using a commercially available echocardiographic machine (Philips HDI 5000, Bothell, Washington, USA) equipped with a Tissue Doppler imaging
software. All studies were performed with patient on the left lateral decubitus in order to obtain the images of the paraesternal and apical views. All echocardiographic measurements were carried out in accordance with the recommendations of the American Society of Echocardiography12, and each value is
represented as an average of 3 beats.
Conventional pulsed Doppler
Measurements of the peak velocities and diastolic profile parameters of mitral inflow and pulmonary venous flow signals were performed as previously described13.
Tissue Doppler echocardiography
TDI acquisitions were performed placing the sample volume in the central region of the myocardium, parallel to the direction of movement of the region of interest. The velocity spectral curve was obtained with a 5-mm sample volume; gain was minimized to optimize the tissue signal and to allow minimal background noise. The Niquist limit was adjusted to a velocity range of 16 to 20 cm/s.
For the study of the myocardial velocities, we employed a model to analyze the different regions of the ventricles, in which the movements took place in radial (parasternal view) and longitudinal direction (apical 4-chamber and 2-chamber views). In all areas, we measured peak systolic (S), early (e’) and late (a’) diastolic velocities. In the posterior wall of the LV and in the regions of the LV and RV annulus, the e’/a’ ratio was also obtained.
In the apical views, both the annulus, basal and mid segments were assessed at the following walls: septal, lateral, inferior and anterior of the left ventricle and the tricuspid annulus from the right ventricle. In addition, the short-axis circunferencial fiber velocities were measured from the posterior mid segment. Short-axis circumferential fiber movement as determined by pulsed TDI have been employed to study some sorts of hypertrophic distribution that sometimes occurs after heart transplantation14. The index suggested by
Nagueh et al15 was employed, which used the ratio between
the early diastolic wave of the mitral flow (E mitral) and the early diastolic wave from the lateral wall measured by DTI (e’LAT). All the measurements were carried out in expiratory apnea.
Statistical analysis
All date are reported as mean ± SD (95% confidence intervals). Unpaired Student’s t-test was used for comparison of continuous variables and paired t-test for comparing follow-up patients. Linear and stepwise regression multivariate analyses were employed to look for relationships among continuous variables on univariate analyses. Receiver-operator curves were employed to evaluate the clinical and epidemiological ability of selected measurements and p < 0.05 was considered relevant.
Results
Cross-section study Endomyocardial Biopsy
ranging from one to eight, with an average of 2.4 biopsies per patient. Twenty-two out of 54 patients studied (40.7%)
presented CR ≥ 3A. CR ≥ 3A was observed in 39/129 EMB
(30.2%). Baseline characteristics of control and HT groups are summarized in Table 1.
Conventional echocardiography
Measurements by two-dimensional echocardiography and pulsed Doppler (p < 0.05) in control and HT groups with or
without CR ≥ 3A are summarized in Table 1. The univariate
analysis of the pulsed wave Doppler parameters considering
the ROC curve area for the diagnosis of CR ≥ 3A, described
mitral A wave velocity as the best parameter (p = 0.013). Considering a cut-off point of 35.2 cm/s, we found an accuracy of 59.8%, sensitivity of 59.5%, specificity of 60%, positive
predictive value of 40.7% and negative predictive value of 75%. Upper right pulmonary vein flow parameters did not
add diagnostic information to CR ≥ 3A. Also, mitral inflow
velocities did not show statistical relevance in the multivariate
analysis to predict CR ≥ 3A.
Tissue Doppler imaging
The TDI study was carried out with success in all patients and regions studied. The velocities of the e’ wave, a’ wave and S wave, TDI e‘/a’ ratio and (e’Mitral / e’LAT ratio) in control
group, RC ≥ 3A and without RC ≥ 3A in the LV and lateral
tricuspid annulusare listed in Tables 2, 3 and 4.
Tissue Doppler and cellular cardiac rejection ≥ 3A No RV lateral annulus TDI parameter presented significant
difference between the groups with and without CR ≥ 3A.
In LV posterior wall, a significant difference was found only in the late velocity (a’ Mid post) between the groups with
and without CR ≥ 3A. In the walls of the LV analyzed on the
apical views, the a’ wave velocities were significantly lower in all regions, with the exception of the mid segment of the interventricular septum. The e’ wave velocities were lower
among patients with CR ≥ 3A only in the septal annulus. The
S wave velocities were significantly lower in patients with CR
≥ 3A in the annulus and the basal region of the septum and
the lateral wall of the LV. In the other segments, there were no significant differences in the systolic velocities.
In the univariate analysis by the ROC curve, the best area was obtained with the late diastolic velocities of the lateral annulus of the LV (a’LAT) (Figure 1). With a cutoff point of 5.6 cm/s, it was observed an accuracy of 74.6%, sensitivity of 76.3%, specificity of 73.8%, positive predictive value of 58% and
negative predictive value of 86.8% for the diagnosis of CR ≥ 3A.
Multivariate analysis
Using logistic regression, a model with 6 predictive
parameters was obtained to predict CR ≥ 3A: the late
velocity of the lateral (ALAtan) and septal LV annulus (a’ SEP), the systolic velocity of the inferior annulus (SINF), the early diastolic velocity of the midlateral segment (e’LATmid),
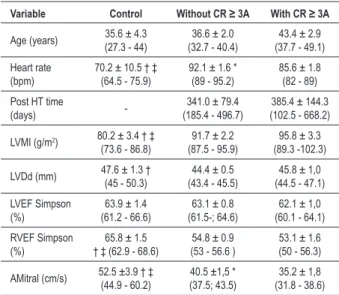
Table 1 - Clinical and conventional Doppler echocardiographic
features in control group and in HT group, with and without CR ≥ 3A
Variable Control Without CR ≥ 3A With CR ≥ 3A
Age (years) 35.6 ± 4.3(27.3 - 44) (32.7 - 40.4)36.6 ± 2.0 (37.7 - 49.1)43.4 ± 2.9
Heart rate (bpm)
70.2 ± 10.5 † ‡ (64.5 - 75.9)
92.1 ± 1.6 * (89 - 95.2)
85.6 ± 1.8 (82 - 89)
Post HT time
(days)
-341.0 ± 79.4 (185.4 - 496.7)
385.4 ± 144.3 (102.5 - 668.2)
LVMI (g/m2) 80.2 ± 3.4 † ‡ (73.6 - 86.8)
91.7 ± 2.2 (87.5 - 95.9)
95.8 ± 3.3 (89.3 -102.3)
LVDd (mm) 47.6 ± 1.3 †(45 - 50.3) (43.4 - 45.5)44.4 ± 0.5 (44.5 - 47.1)45.8 ± 1,0
LVEF Simpson (%)
63.9 ± 1.4 (61.2 - 66.6)
63.1 ± 0.8 (61.5-; 64.6)
62.1 ± 1,0 (60.1 - 64.1)
RVEF Simpson (%)
65.8 ± 1.5 † ‡ (62.9 - 68.6)
54.8 ± 0.9 (53 - 56.6 )
53.1 ± 1.6 (50 - 56.3)
AMitral (cm/s) 52.5 ±3.9 † ‡ (44.9 - 60.2)
40.5 ±1,5 * (37.5; 43.5)
35.2 ± 1,8 (31.8 - 38.6) AMitral - late diastolic velocity of mitral low; CR - cellular cardiac rejection, LVMI - left ventricle mass index; LVDd - left ventricle diastolic diameter; LVEF - left ventricle ejection fraction; RVEF - right ventricle ejection fraction; HT - heart
transplantation. p < 0.05: *, with rejection versus without rejection; † control
versus without rejection; ‡ control versus with rejection.
Table 2 -TDI parameters of left ventricle posterior wall and tricuspid annulus in control group and in HT patients with and without CR ≥ 3A
Parameter Control Without CR ≥ 3A With CR ≥ 3A
e’ mid posterior 11.3 ± 0.7 (10 - 12.6) 12.3 ± 0.4 (11.6 - 13) 12.3 ± 0.3 (11.3 - 13.4)
a’ mid posterior 5.1 ± 0.6 (4.1 - 6.2) ‡ 4.8 ± 0.2 (4.4 - 5.3) * 4.0 ± 0.2 (3.6 - 4.5)
e’/a’ ratio mid posterior 2.5 ± 0.2 (2 - 2.9) 2.9 ± 0.2 (2.6 - 3.2) 3.1 ± 0.2 (2.7 - 3.7)
S mid posterior 6.5 ± 0.2 (5.9 - 7.1) † ‡ 8.3 ± 0.2 (7.9 - 8.7) 8.1 ± 0.3 (7.5 - 8.7)
e’ tricuspid annulus 14.3 ± 0.8 (12.8 - 15.7) † ‡ 8.2 ± 0.3 (7.6 - 8.9) 7.4 ± 0.4 (6.6 - 8.3)
a’ tricuspid annulus 11.9 ± 1.0 (9.9 - 13.9) †‡ 8.3 ± 0.4 (7.6 - 9.0) 7.7 ± 0.5 (6.6 - 8.7)
e’/a’ ratio tricuspid annulus 1.3 ± 0.2 (1.0 - 1.6) † 1.0 ± 0.1 (0.9 - 1.2) 1.1 ± 0.1 (0.9 - 1.4)
Table 3 - TDI parameters of septal and lateral annulus and segments of left ventricle walls in control group and in HT patients with and
without CR ≥ 3A
Parameter Control without CR ≥ 3A with CR ≥ 3A
e’ septal annulus 10.6 ± 0.6 (9.5 - 11.6) †‡ 9.1 ± 0.2 (8.6 - 9.6) 7.9 ± 0.3 (7.3 - 8.5) *
a’ septal annulus 9.2 ± 0.7 (7.8 - 10.6) †‡ 7.1 ± 0.2 (6.6 - 7.5) 5.2 ± 0.2 (4.8 - 5.7) *
e’/a’ ratio septal annulus 1.2 ± 0.1 (1 - 1.5) 1.3 ± 0.1 (1.2 - 1.4) 1.6 ± 0.1 (1.4 - 1.7) *
A basal septal 7.4 ± 0.6 (6.3 - 8.6) †‡ 5.4 ± 0.1 (5.0 - 5.8) 4.4 ± 0.2 (3.9 - 4.9) *
S basal septal 7.2 ± 0.2 (6.8 - 7.6) †‡ 6.2 ± 0.1 (6.0 - 6.5) 5.7 ± 0.2 (5.3 - 6.1) *
e’ Mid septal 9.5 ± 0.6 (8.4 - 10.6) †‡ 7.4 ± 0.2 (6.9 - 7.9) 7.4 ± 0.3 (6.7 - 8.2)
a’ mid septal 6.2 ± 0.5 (5.2 - 7.2) †‡ 4.4 ± 0.1 (4.0 - 4.7) 3.9 ± 0.1 (3.6 - 4.3)
S mid septal annulus 6.1 ± 0.3 (5.5; 6.8) †‡ 5.3 ± 0.1 (5.0; 5.6) 5.0 ± 0.2 (4.5; 5.5)
e’ lateral annulus 14.6 ± 1.0 (12.6 -16.6) 12.9 ± 0.4 (12 - 13.6) 12.4 ± 0.3 (11.3 - 13.7)
a’ lateral annulus 7.9 ± 0.7 (6.6 - 9.2) †‡ 6.5 ± 0.2 (6.2 - 6.9) 4.9 ± 0.2 (4.6 - 5.3) *
e’/a’ lateral annulus 1.8 ± 0.2 (1.4 - 2.1) ‡ 2.1 ± 0.1 (1.9 - 2.3) 2.6 ± 0.2 (2.3 - 3) *
e’ mitral/e’ lateral annulus 5.5 ± 0.4 (4.8 - 6.1) 6.2 ± 0.3 (5.8 - 6.8) 6.2 ± 0.4 (5.4 - 7)
S lateral annulus 9.3 ± 0.6 (8.2 - 10.4) 9.2 ± 0.2 (8.8 - 9.7) 8.3 ± 0.3 (7.9 - 8.9) *
e’ basal lateral 12.2 ± 0.9 (5.4 - 7.3) 13.4 ± 0.5 (12.5 - 14.3) 12.8 ± 0.7 (11.4 - 14.3)
a’ basal lateral 6.4 ± 0.5 (7.1 - 8.3) †‡ 5.0 ± 0.2 (4.7 - 5.3) 4.3± 0.2 (4 - 4.7) *
S basal lateral 7.7 ± 0.3 (7.1 - 8.3) 8.5 ± 0.2 (8 - 8.9) 7.7 ± 0.3 (7 - 8.4) *
e’ mid lateral 9.8 ± 0.8 (8.4 - 11.4) 11.6 ± 0.4 (10.8 - 12.5) 10.5 ± 0.5 (9.6 - 11.5)
a’ mid lateral 5.6 ± 0.4 (4.8 - 6.4) ‡ 4.6 ± 0.2 (4.3 - 5) 3.8 ± 0.2 (3.5 - 4.2) *
S mid lateral 7.1 ± 0.3 (6.4 - 7.8) 7.7 ± 0.2 (7.4 - 8.2) 7.0 ± 0.3 (6.5 - 7.5) *
Velocity are expressed as mean cm/s ± SE (95% CI); a’ - late diastolic velocity; e’ - early diastolic velocity; S - systolic peak velocity; mid - medium segment; CR - cellular cardiac rejection; HT - heart transplantation; p < 0.05: *, with rejection versus without rejection; † control versus without rejection; ‡ control versus with rejection.
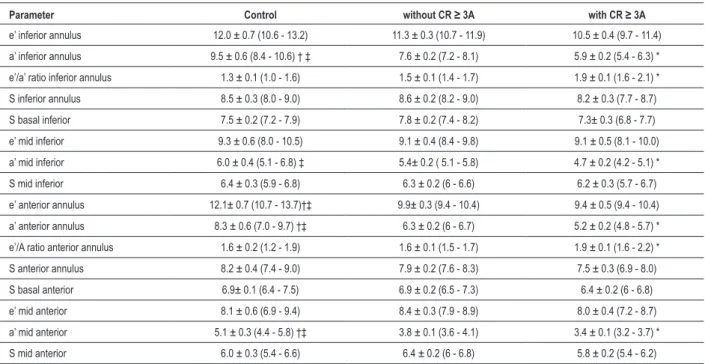
Table 4 - TDI parameters of inferior and anterior annulus and segments of left ventricle walls in control group and in HT patients with and
without CR ≥ 3A
Parameter Control without CR ≥ 3A with CR ≥ 3A
e’ inferior annulus 12.0 ± 0.7 (10.6 - 13.2) 11.3 ± 0.3 (10.7 - 11.9) 10.5 ± 0.4 (9.7 - 11.4)
a’ inferior annulus 9.5 ± 0.6 (8.4 - 10.6) † ‡ 7.6 ± 0.2 (7.2 - 8.1) 5.9 ± 0.2 (5.4 - 6.3) *
e’/a’ ratio inferior annulus 1.3 ± 0.1 (1.0 - 1.6) 1.5 ± 0.1 (1.4 - 1.7) 1.9 ± 0.1 (1.6 - 2.1) *
S inferior annulus 8.5 ± 0.3 (8.0 - 9.0) 8.6 ± 0.2 (8.2 - 9.0) 8.2 ± 0.3 (7.7 - 8.7)
S basal inferior 7.5 ± 0.2 (7.2 - 7.9) 7.8 ± 0.2 (7.4 - 8.2) 7.3± 0.3 (6.8 - 7.7)
e’ mid inferior 9.3 ± 0.6 (8.0 - 10.5) 9.1 ± 0.4 (8.4 - 9.8) 9.1 ± 0.5 (8.1 - 10.0)
a’ mid inferior 6.0 ± 0.4 (5.1 - 6.8) ‡ 5.4± 0.2 ( 5.1 - 5.8) 4.7 ± 0.2 (4.2 - 5.1) *
S mid inferior 6.4 ± 0.3 (5.9 - 6.8) 6.3 ± 0.2 (6 - 6.6) 6.2 ± 0.3 (5.7 - 6.7)
e’ anterior annulus 12.1± 0.7 (10.7 - 13.7)†‡ 9.9± 0.3 (9.4 - 10.4) 9.4 ± 0.5 (9.4 - 10.4)
a’ anterior annulus 8.3 ± 0.6 (7.0 - 9.7) †‡ 6.3 ± 0.2 (6 - 6.7) 5.2 ± 0.2 (4.8 - 5.7) *
e’/A ratio anterior annulus 1.6 ± 0.2 (1.2 - 1.9) 1.6 ± 0.1 (1.5 - 1.7) 1.9 ± 0.1 (1.6 - 2.2) *
S anterior annulus 8.2 ± 0.4 (7.4 - 9.0) 7.9 ± 0.2 (7.6 - 8.3) 7.5 ± 0.3 (6.9 - 8.0)
S basal anterior 6.9± 0.1 (6.4 - 7.5) 6.9 ± 0.2 (6.5 - 7.3) 6.4 ± 0.2 (6 - 6.8)
e’ mid anterior 8.1 ± 0.6 (6.9 - 9.4) 8.4 ± 0.3 (7.9 - 8.9) 8.0 ± 0.4 (7.2 - 8.7)
a’ mid anterior 5.1 ± 0.3 (4.4 - 5.8) †‡ 3.8 ± 0.1 (3.6 - 4.1) 3.4 ± 0.1 (3.2 - 3.7) *
S mid anterior 6.0 ± 0.3 (5.4 - 6.6) 6.4 ± 0.2 (6 - 6.8) 5.8 ± 0.2 (5.4 - 6.2)
Table 5 - Tissue Doppler Imaging (TDI) parameters in the multivariate analysis
Parameter Coeficient Standard error p Odds ratio
Constant 16.923 4.194 <0.001
-a’ septal
annulus -1.068 0.3113 0.001 0.344
a’ lateral
annulus -1.118 0.37 0.002 0.327
e’/a’ ratio
lateral annulus -1.508 0.549 0.006 0.221
E mitral/ e’LAT
annulus ratio -0.488 0.199 0.014 0.614
S inferior
annulus 0.57 0.218 0.009 1.768
E mid lateral
wall -0.264 0.13 0.042 0.768
TDI - tissue Doppler imaging; a’ - late diastolic velocity; e’ - early diastolic velocity; Emitral - early diastolic velocity of mitral low; S - systolic peak velocity: LAT - left ventricular lateral wall.
Table 6 - Prospective phase study. Variation on late diastolic lateral
annulus velocity (ALATan) according to EMB evolution. Groups 1 and 2, patients initially without RC ≥ 3A. Groups 3 and 4 patients initially with RC ≥ 3A
Group Patients
(n)
1st Echo ALATan (cm/s)
2nd Echo ALATan (cm/s)
p
1. Without CR ≥ 3A 18 6.26 ± 0.4 6.76 ± 0.37 0.2
2. Development CR
≥ 3A 11 6.83 ± 0.38 5.23 ± 0.39 0.001 3. CR ≥ 3A with
regression after treatment
19 4.94 ± 0.26 6.59 ± 0.27 <0.001
4. CR ≥ 3A
persistence 6 5 ± 0.5 4.97 ± 0.31 0.95
CR - cardiac rejection; ALATan - late diastolic velocity of left ventricle lateral annulus.
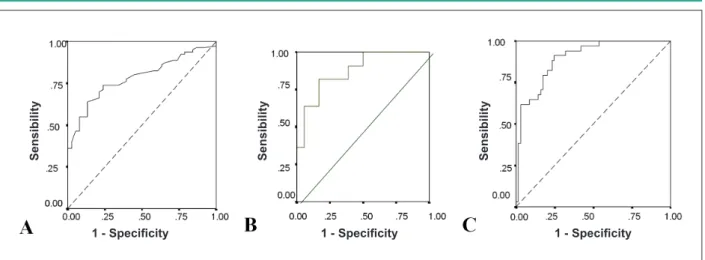
Figure 1 - Receiver operator curve (ROC) analysis for differentiation between the presence or absence of acute cellular rejection (CR) in heart transplanted patients. A) ROC for late diastolic velocity of lateral annulus of left ventricle (a’LAT ) diagnosis, B) ROC for the ALAT and fall of 7% in patients initially without CR and C) ROC for the multivariate model.
Se
n
s
ib
il
ity
Se
n
s
ib
il
ity
Se
n
s
ib
il
ity
1 - Speciicity 1 - Speciicity 1 - Speciicity
the e’/a’ LAT ratio and the e’mitral/e’LAT ratio when all the variables were analyzed together (Table 5). The following predictive score was adopted:
Score = 16.923 - (1.068 x a’SEP - 1.118 x a’LAT - 1.508 x e’/a’LAT Ratio - 0.488 x e’ Mitral/e’LAT Ratio + 0.570 x SINF - 0.264 x e’ LAT mid).
The cut-off point obtained by the analysis of the ROC curve was equal to 0.619039.
The distribution of variables in the multivariate analysis demonstrated a sensitivity of 88.2%, specificity of 75.4%, accuracy of 79.6%, positive predictive value of 63.8% and a
negative predictive value of 92.9% for the diagnosis of CR ≥ 3A .
Prospective phase study
Considering the patients who were submitted to more than one EMB, we determined 2 groups: 1 - a group of 29 patients,
initially not presenting CR ≥ 3A at the first EMB; 2 - a group of 25 patients, who presented CR ≥ 3A at the first EMB.
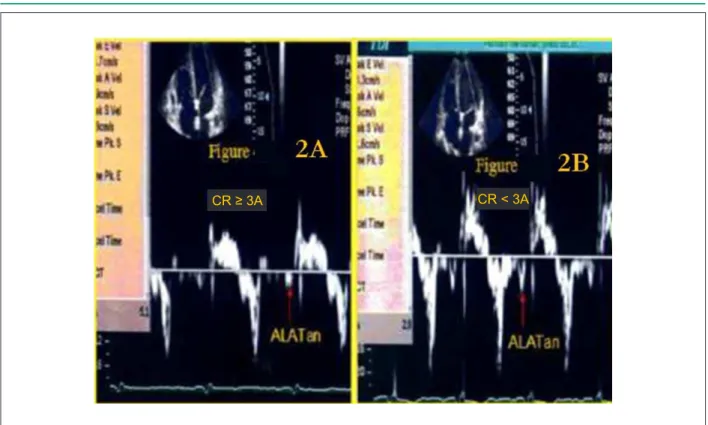
We observed the behavior of (a’LAT) in these groups and found significant variations in the evolution of the variable in accordance to histological changes (Table 6), (Figure 2).
Taking into account all patients without CR≥ 3A at the
time of the first EMB, we established, using the ROC curve, that a fall of 7% in the initial value of the a’LAT presented an accuracy of 79%, sensitivity of 81.8%, specificity of 77.8%, positive predictive value of 69.2% and negative predictive
value of 87.5% for the diagnosis of CR ≥ 3A (Figure 1).
Discussion
Our results showed the feasibility of TDI for early diagnosis of significant cellular rejection and that TDI added diagnostic information concerning conventional echocardiogram for such issue. We observed LV regional variations in patients presenting
Fig. 2 - Consecutive TDI studies in a patient with acute cellular rejection (CR ≥ 3A). Left (2A) - Small a’LAT annulus velocity (arrow) during CR ≥ 3A acute phase. Right (2B) - Signiicant increase in a’LAT annulus velocity (arrow) after CR ≥ 3A resolution.
CR ≥ 3A CR < 3A
analysis showed good diagnostic accuracy in detecting CR
≥ 3A, demonstrating different behaviors of a’LAT velocities
according to histological changes.
Heart transplant group versus normal group on tissue
Doppler
To our knowledge, this is the first TDI report which quantitatively characterized various segments of the graft matched by a normal group. In relation to RV systolic function, our data suggest the presence of contractile alteration, which was discordant to a previous report16. The increase in the graft
RV volume and thickness, shortly after HT, is an adaptation mechanism to pulmonary hypertension, generally present in the receptor. The regression of such changes during time is already known. However, RV systolic function seems to be preserved in stable patients without CR. The evidence of tricuspid insufficiency, common among HT patients, can overestimate the functional parameters on conventional echocardiography17,18.
The TDI study does not seem to be affected by this influence, as we may observe in our series, with very low systolic velocities of the tricuspid annulus among transplanted patients.
Taking into consideration RV diastolic function, we observed that the reduction in e’ and a’ wave velocities in the tricuspid annulus may suggest a more advanced degree of impairment of the RV diastolic function in the HT group. In concordance with our series, Valantine et al showed RV diastolic alterations in post-HT patients on conventional Doppler, with a reduction in a’ wave velocities of the tricuspid flow among transplanted patients19.
In the LV systolic function study, our results indicated accentuated regional alterations in the interventricular septum relative to the control group, which was not found in previous conventional echocardiographic reported data20. Left ventricular
diastolic dysfunction could be confirmed by the reduction in the e’ and a’ wave velocities in relation to the control group, especially in the septal and anterior regions. These velocities are inversely proportional to the degree of diastolic dysfunction21.
The alterations in the diastolic function are already known to occur among post-HT patients and our findings are in accordance with those demonstrated beforehand, in which the occurrence of a restrictive physiological pattern was observed early in the first weeks after the graft implant, with partial regression in the follow-up period22.
Pulsed Doppler and diagnosis of cellular rejection ≥ 3A
The lack of statistical relevance of the conventional echocardiographic parameters studied in the multivariate analysis to predict CR ≥ 3A can be understood taking into account the hemodynamic influence on such issues. These findings are in agreement with previous studies22,23.
We believe that the lack of usefulness of the use of pulsed Doppler to predict CR ≥ 3A could be related to some reasons as previously stated by Stengel et al9: first of all, pulsed Doppler
Tissue Doppler and diagnosis of cellular rejection ≥ 3A
This is the first study, as far as we know, which has evaluated the diagnosis of CR ≥ 3A using a multi-regional TDI model including basal and medium segments of the LV walls. The
importance of TDI to predict CR ≥ 3A is highlighted by the
sudden reduction in a’ wave velocity in 12 regions, as well as by the decrease in the S wave velocity in 5 regions, of the e’ wave velocity in one region of the LV and by the definition of 6 independent predictors in the multivariate model.
In the LV, around 75% of the patients in the group with CR
≥ 3A presented velocities a’SEP and a’LAT below the level
of the upper limit of the first quartile in the group of patients with CR. Our results are in accordance with a study published more recently9, which was the first one to show the benefit
of the late diastolic wave velocity (a’) for the diagnosis of CR
≥ 3A.In another study, a’ wave velocities in mitral annulus were significantly lower in the group of patients with CR, in agreement with our report23. Thus, we believe that graft
atrial dysfunction could be observed by studying the a’ wave velocities on TDI and also that graft atrial dysfunction could be considered one of the main functional consequences of the myocardial aggression in significant CR.
In spite of previous reports we found lesser importance of the early diastolic wave velocity (e’) for the diagnosis of CR
≥ 3A, what could be explained by the emphasis on radial
movement of the heart or uni-dimensional TDI technique used on such studies24,25.
In relation to systolic function during CR ≥ 3A, regional
differences found in our series might suggest a heterogeneous form of muscular impairment in this type of cardiac lesion. No study published to date has shown greater importance of the systolic variables compared to diastolic parameters to predict CR. Our multi-regional model study came to a score involving systolic and diastolic features, what could lead to a better understanding of a complex situation such as CR.
Evolutive phase study
This is the first study, as far as we know, with pulsed
TDI and the use of the (a’) wave for the diagnosis of CR ≥
3A, which sequentially evaluated HT patients according to histological evolution. Regarding our study, we supposed that the a’LAT variable was useful to establish the occurrence of
CR ≥ 3A and this parameter does not appear to be under
the influence of prior alterations in diastolic function. Other observational studies did not analyze a’ waves and found significant variations in S and e’ waves8,26. Tissue Doppler
parameters (mitral and tricuspid e’/e’ ratios have been reported as non-invasive measures to rule out transplant rejection in pediatric heart transplant recipients26. Eventually,
similar echocardiographic analyses may be useful to rul eout transplant rejection in the adult population.
Previous studies employing echocardiography have addressed acute allograft rejection27. However, some bias
may be troublesome concerning such data. For instance, some studies present small sample sizes, others define poorly demographic information or surgical techniques or demonstrate non-blinded comparisons28. Other important
point is the presentation of technical echocardiographic data in a clinical comprehensive fashion. In our study, concerning repetitive Tissue Doppler studies, a fall of 7% in the initial value of the a’LAT presented a high sensitivity (81.8%), as well as a high negative predictive value (87.5%) for the diagnosis
of CR ≥ 3A.
The echocardiographic score derived from this study, comprising information from different segments of the left ventricle by combining diastolic and systolic parameters may
be a useful tool for the for the diagnosis of CR ≥ 3A. Its use
demonstrated very high values concerning sensitivity (88.2%) and negative predictive value (92.9%) to rule out severe cardiac rejection. Also, the use of such score added diagnostic information (higher sensitivity, specificity, accuracy, negative predictive value, positive predictive value) when compared to the best univariate TDI derived parameter (a’LAT) to detect CR
≥ 3A. We are absolutely aware of the complexity of the format
of such score, but perhaps it may just reflect the complex process of cardiac transplantation rejection.
Limitations
There are specific limitations regarding the TDI technique, such as those arising from the angle of inclination of the Doppler study and the complex movements of the heart, which could interfere with myocardial velocity registration. However, longitudinal movements as studied in our series may provide less interference. Another limitation of this investigation could be related to the presence of regional wall motion abnormalities in HT patients, which led to the exclusion of such kind of patients in our study. A new echocardiographic technique that could be used to overcome some of the TDI limitations, such as the angle dependence, could use the strain and strain rate, which could certainly add some information to cardiac rejection diagnosis.
Conclusion
This multiregional TDI-based study proved to be clinically
feasible and added diagnostic information to predict CR ≥ 3A,
when compared to conventional Doppler. The multivariate model presented better accuracy than isolated TDI parameters
References
1. Taylor DO, Edwards LB, Boucek MM, Trulock EP, Keck BM, Hertz MI. The registry of International Society for Heart and Lung Transplantation: twenty-first. Official adult heart transplant report-2004. J Heart Lung Transplant. 2004;23(7):796-803.
2. Boucek MM, Edwards LB, Keck BM, TrulockEP, Taylor DO, Hertz MI. Registry for the International Society for Heart and Lung Transplantation: seventh official pediatric report-2004. J Heart Lung Transplant. 2004;23(8):933-47.
3. Bocchi EA, Mocelin AV, Moraes AV, Menegheti C, Higuchi ML, Bacal F. Comparison between two strategies for rejection detection after heart transplantation: routine endomyocardial biopsy versus Gallium-67 cardiac imaging. Transplant Proc. 1997;29(1-2):586-8.
4. Mehra MR, Uber PA, Uber WE, Park MH, Scott RL. Anything but a biopsy: noninvasive monitoring for cardiac allograft rejection. Curr Opin Cardiol. 2002;17(2):131-6.
5. Yu CM, Lin H, Yang H, Kong SL, Zhang Q, Lee SW. Progression of systolic abnormalities in patients with “isolated” diastolic heart failure and diastolic dysfunction. Circulation. 2002;105(10):1195-201.
6. St Goar FG, Gibbons R, Schnittger I, Valantine HA, Popp RL. Left ventricular diastolic function. Doppler echocardiographic changes soon after cardiac transplantation. Circulation. 1990;82(3):872-8.
7. Fabregas RI, Crespo-leiro MG, Muniz J, Regueiro M, Rodrigues JA, Alvarez N, et al. Usefulness of pulsed Doppler tissue imaging for noninvasive detection of cardiac rejection after heart transplantation. Transplant Proc. 1999;31(6):2545-7.
8. Puleo JA, Aranda JM, Weston MW, Cintron G, French M, Clark L. Noninvasive detection of allograft rejection in heart transplant recipients by use of Doppler tissue imaging. J Heart Lung Transplant. 1998;17(2):176-84.
9. Stengel SM, Alleman Y, Zimmerli M, Lipp E, Kutcher N, Mohacsi P, et al. Doppler tissue imaging for assessing left ventricular diastolic dysfunction in heart transplant rejection. Heart. 2001;86(4):432-7.
10. Miller WM, Schlant RC, Kobashigawa J, Kubo S, Renlund DG. 24th Bethesda conference: Cardiac transplantation. Task Force 5: Complications. J Am Coll Cardiol. 1993;22(1):41-54.
11. Billingham ME, Cary NR, Hammond ME, Kemnitz J, Marboe C, McCallister HA, et al. A working formulation for the standardization of nomenclature in the diagnosis of heart and lung rejection: Heart rejection study Group. The International Society for Heart Transplantation . J Heart Transplant. 1990;9(6):587-93.
12. Schiller NB, Shah PM, Crawford M, De Maria A, Devereux R, Feingenbaum H, et al. Recommendations for quantitation of the left ventricle by two-dimensional echocardiography. American Society of Echocardiography Committee on Standars, Subcommittee on quantitation of two-dimensional echocardiograms. J Am Soc Echocardiogr. 1989;2(5):358-67.
13. Apleton CP, Jensen JL, Hatle LK, Oh JK. Doppler evaluation of left and right ventricular diastolic function; a technical guide for obtaining optimal flow velocity recordings. J Am Soc Echocardiogr. 1997;10(3):271-97.
14. Tabata T, Oki T, Yamada H, Abe M, Onose Y, Thomas JD. Subendocardial motion in hypertrophic cardiomyopathy: assessment from long- and
short-axis views by pulsed tissue Doppler imaging. J Am Soc Echocardiogr. 2000;13(2):108-15.
15. Nagueh SF, Middleton KJ, Kopelen HA, Zoghbi WA, Quinones MA. Doppler tissue imaging: a technique for evaluation of left ventricular relaxation and estimation of filling pressures. J Am Coll Cardiol. 1997;30(6):1527-33.
16. Gorcsan J 3rd, Snow FR, Paulsen W, Arrowood JA, Thompson JA, Nixon JV. Echocardiographic profile of the transplanted human heart in clinically well recipients. J Heart Lung Transplant. 1992;11(1 Pt 1):80-9.
17. Borow KM, Neumann A, Arensman FW, Yacoub MH. Left ventricular contractility and contractible reserve in humans after cardiac transplantation. Circulation. 1985;71(5):866-72.
18. Bhatia SJ, Kirshenbaum JM, Shemin RJ, Cohn LH, Collins JJ, Di Sesa VJ, et al. Time course of resolution of pulmonary hypertension and right ventricular remodeling after orthotopic cardiac transplantation. Circulation. 1987;76(4):819-26.
19. Valantine HA, Appleton CP, Hatle LK, Hunt SA, Billingham ME, Shumway NE, et al. A hemodynamic and Doppler echocardiographic study of ventricular function in long-term cardiac allograft recipients: etiology and prognosis of restrictive-constrictive physiology. Circulation. 1989;79(1):66-75.
20. Tischler MD, Lee RT, Plappert T, Mudge GH, St John Sutton M, Parker JD. Serial assesment of the left ventricular function and mass after orthotopic heart transplantation: a 4-year longitudinal study. J Am Coll Cardiol. 1992;19(1):60-6.
21. Garcia MJ, Thomas JD, Klein AL. New Doppler echocardiographic aplications for the study of diastolic function. J Am Coll Cardiol. 1998;32(4):865-75.
22. Ciliberto GR, Mascarello M, Gronda E, Bonacina E, Anjos MC, Danzi G, et al. Acute rejection after heart transplantation: noninvasive echocardiographic evaluation. J Am Coll Cardiol. 1994;23(5):1156-61.
23. Sun JP, Abdalla IA, Asher CR, Greenberg NL, Popovic ZB, Taylor DO, et al. Non-invasive evaluation of orthotopic heart transplant rejection by echocardiography. J Heart Lung Transplant. 2005;24(2):160-5.
24. Mankad S, Murali S, Kormos RL, Mandarino WA, Gorcsan J 3rd. Evaluation of the potential role of color-coded tissue Doppler echocardiography in the detection of allograft rejection in heart transplant recipients. Am Heart J. 1999;138(4 Pt 1):721-30.
25. Derumeaux G, Douillet R, Redonnet M, Mouton-Schleifer D, Soyer R, Cribier A, et al. Détection du rejet aigu myocardique après transplantation cardiaque par Doppler couleur tissulaire. Arch Mal Coeur Vaiss. 1998;91(10):1255-62.
26. Dandel M, Hummel M, Muller J, Wellnhofer E, Meyer R, Solowjowa N, et al. Reliability of tissue Doppler wall motion monitoring after heart transplantation for replacement of invasive routine screenings by optimally timed cardiac biopsies and catheterizations. Circulation. 2001;104 (Suppl I):I184-91.
27. Behera SK, Trang J, Feeley BT, Levi DS, Alejos JC, Drant S. The use of Doppler tissue imaging to predict cellular and antibody-mediated rejection in pediatric heart transplant recipients. Pediatr Transplant. 2008;12(2):207-14.