AR
TIGO ORIGINAL/ ORIGINAL AR
TICLE
NUTRITIONAL ASSESSMENT IN PATIENTS
WITH CIRRHOSIS
Sabrina Alves
FERNANDES
, Lilian
BASSANI
, Flávia Feijó
NUNES
,
Maria Eugênia Deutrich
AYDOS
, Alexandro Vaesken
ALVES
and Cláudio Augusto
MARRONI
ABSTRACT – Context -Malnutrition in cirrhotic patients with end-stage disease is common, and the degree of nutritional debilitation
can play an important role in the pathogenesis of complications and cause a negative impact on prognosis. However, it involves dificulties and controversies regarding the identiication of the best nutritional assessment method. Objective - To identify a method that provides a safe and effective nutritional diagnosis. Methods - Cross-sectional study with 129 cirrhotic patients. Anthropometric
measurements, subjective global assessment, hand grip strength and bioelectrical impedance. Results - Through phase angle of
bioelectrical impedance analysis (BIA) method, signiicant associations with Child-Pugh (P = 0.008), age group and gender were observed. The ROC (receiver operator characteristic) curve was generated to determine the best cutoff point of the phase angle of cirrhotic patients, serving as one of the reference parameters for the nutritional assessment with bioimpedance in this study, considering the classiication through Child-Pugh score as the reference standard for the clinical conditions of patients with cirrhosis.
Conclusions - The assessment through bioelectrical impedance presented a statistically signiicant correlation with Child-Pugh score. The identiication of phase angle of 5.44º is the new parameter suggested for the classiication of the nutritional conditions of cirrhotic patients.
HEADINGS – Liver cirrhosis. Electrical impedance. Malnutrition. Nutrition assessment.
The three authors involved participated sufficiently in the work to take public responsibility for the content of the paper and must approve of the final version of the manuscript.
There is no conflict of interest involved.
Postgraduate Program of Hepatology, Universidade Federal de Ciências da Saúde de Porto Alegre, Porto Alegre, RS, Brasil.
Correspondence: Dr. Sabrina Alves Fernandes – Rua Marcilio Dias, 918 – apt. 08 – Menino Deus – 90130-000 – Porto Alegre, RS, Brazil. E-mail: sabrinaafernandes@ gmail.com
INTRODUCTION
Protein caloric malnutrition is a syndrome considered as progressive loss of both lean body mass (protein) and adipose tissue (calorie). Signiicant changes in the metabolism of protein, carbohydrates and lipids appear simultaneously the consumption of muscular and lipid compartments to satisfy a higher energetic demand(10).
This clinical condition is common in patients with chronic hepatopathy and affects 20% of the patients with compensated cirrhosis and more than 60% of these patients with severe hepatic dysfunction(21, 22).
Several factors are present in the development of malnutrition in cirrhotic. Inadequate oral ingestion resulting from anorexia, dysgeusia, early satiety, nauseas and vomits associated with hepatopathy, use of drugs and their adverse effects(12, 24, 25, 26). We should also
consider as contributing factors the poor absorption and deicient intestinal digestion, which are more accentuated in patients with bile duct diseases with cholestasis, for whom steatorrhea is common(25, 29).
Malnutrition is a relevant factor when determining the progress of hepatic disease, as it affects the
storage of nutrients, contributes to hypoalbuminemia resulting from impaired hepatic synthesis and intensifies the hydroelectrolytic unbalance determined by renal alterations, characteristics of this disease state(23, 25, 28, 29). However, it involves difficulties and
controversies regarding the identification of the best nutritional assessment method considered as gold standard, that is a low cost, loyal and easy-to-apply method that does not affect the final result.
Due to these characteristics, which negatively interfere in the nutritional status of the cirrhotic patient and which are part of the natural history of the disease, it is necessary to identify when malnutrition begins its course.
This preventive measure applies primarily to patients on the liver transplant list, who will thus have a better quality of life until the time of the transplant.
METHODS
A prospective cross-sectional study was conducted between April 2007 and January 2008 with 129 cirrhotic patients, with diagnosis based on histological evidences, clinical and laboratorial or imaging diagnosis (presence of hepatic irregularities due to portal hypertension and hepatic insuficiency) and evidences of chronic hepatic disease. The clinical evidences of cirrhosis were deined with the presence of portal hypertension or hepatic insuficiency.
The study excluded patients with hepatocellular carcinoma, poor intestinal absorption, acquired immunodeiciency syndrome, chronic renal insuficiency, use of enteral diet, neuromuscular alterations in upper limbs, chronic pancreatitis, chronic diarrhea and psychic and/or cognitive alterations.
The patients with inclusion criteria were classiied according to the disease severity through Child-Pugh score. They were invited to participate in the study after they agreed with it and signed the Informed Consent Term, approved by the ethics committee of the Universidade Federal de Ciências da Saúde de Porto Alegre (UFCSPA), RS, Brazil.
Protocol
The clinical, anthropometric, subjective global assessments was performed through dynamometry and bioelectrical impedance during a routine doctor’s visit, in the morning shift, with the same duration and performed by the same appraiser.
Anthropometry
Weight was measured using a Filizola 100 g resolution scale and height with a wall-mounted stadiometer. The body mass index (BMI) was calculated using the formula proposed by Quetelet(40), BMI = weight/height2; and the parameters
of OMS 1995(42) were considered for the nutritional state
classiication.
The triceps skinfold (TSF) and upper arm circumference (UAC) were measured using mathematical formulas to calculate the arm muscle circumference (AMC)(11). Measurement of
TSF was measured using a Cescorf skinfold caliper. The UAC was measured with a graduated, non-retracting, lexible measuring tape.
Subjective global assessment
The subjective global assessment (SGA) was performed following the protocol of Detsky et al.(9). It analyzed history
data of ponderal loss, reduced daily caloric ingestion, gastrointestinal symptoms, functional capacity and physical signs of malnutrition (reduction of subcutaneous tissue and/ or muscular mass, edema, ascites). The patients were classiied as: well nourished A, with moderate malnutrition B and severe malnutrition C, according to the method scores.
Dynamometry
A mechanical hand grip dynamometer of adjustable handle was used to assess the hand grip strength (HGS) (Baseline® SmedleySpring, made in New York, USA). The
patient sits on a chair without armrest and with the plantar region on the loor; the appraiser adjusts the dynamometer handle to place the patient’s hand comfortably, that, during the test, should be kept far from the body and chair. After the dynamometer adjustment to the correct position, the patient compresses the handle with as much strength as possible with the non-dominant hand.
Three assessments were made, with an interval of more than 30 seconds between them, and the pointer was zeroed after each attempt. The result of highest value from the three assessments was utilized as criterion-result, and later the nutritional state was classiied along with the patient’s age and gender, according to the reference parameter of Álvares da Silva et al.(4).
Bioelectrical impedance
For the assessment of nutritional state, Biodynamics, model 450, Seattle, WA, USA was utilized. The patient remains in dorsal decubitus position, with hands and legs parallel to the body. One electrode is placed on the dorsal hand, at the middle inger level, and one in the wrist joint, both on the right side. Another pair of electrodes is placed on the dorsal foot, at the middle toe level, and in the ankle joint, also on the right side.
The electrical current used in the measurement is 800 A and 50 kHz, which enables to measure resistance and reactance and obtain the phase angle (PA) value.
The PA derives from two segments of corporal composition, calculated as follows: PA = tangent arc (Xc /R) x 180/ 3.1416, proposed by Barbosa-Silva et al.(7). The PA result enables to
classify the patient according his/her nutritional state. The patients were classiied according to two reference parameters: the irst is named bioelectrical impedance analysis (BIA), based on the reference parameters of the study conducted by Barbosa-Silva et al.(8), which validated
cutoff points for the method, according to the age and gender of a population of inpatients with different diseases from an American hospital; the second one, BIA cirrhosis, named by the author of this study, is related to the population of cirrhotic patients included in this study and presents the value of 5.44º as cutoff point.
Statistical analysis
A descriptive analysis was performed through mean values and standard deviation for continuous variables of symmetric distribution, or median value and interquartile amplitude for continuous variables of asymmetric distribution, and absolute and relative frequency for categorical variables.
Chi-square test of McNemar was used in the comparison of the nutritional state between the techniques.
Kappa coeficient of agreement was used to assess the agreement between the classiications of BIA.
The assessment of the association between the reference values of HGS and BIA and severity, disease etiology and demographic characteristics used the t-Student test or the analysis
multiple comparisons, Tukey test (symmetric distribution) or Mann-Whitney test (asymmetric distribution) was used.
Pearson’s chi-square test was used to assess the association between the categorical variables.
The signiicance level of 5% was considered and the analyses were performed using SPSS (Statistical Package for the Social Sciences) version 13.0.
Ethical considerations
Secrecy was maintained about the identity and data from all patients submitted to the assessment protocol (number: 06/135). The study was conducted after the approval of the Ethics Committee, according to the Declaration of Helsinki of 1975, revision of 1983.
RESULTS
The sample is composed of 129 patients, mean age of 55 years (± 11.4 years, ranging from 20 to 78 years), 70 (54.3%) male and 59 (45.7%) female.
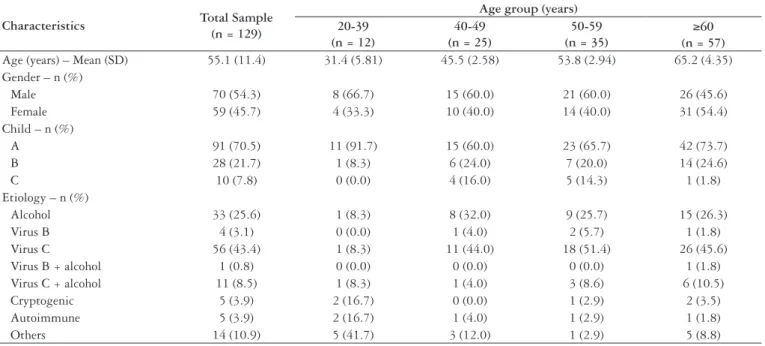
The clinical characteristics of the cirrhotic patients included in the study are described in Table 1.
The anthropometric evaluation (Table 2) shows that weight, height and AMC found in the male population are higher than those found in the female population (P≤0.001), but, when analyzing the TSF, the female population presents higher values than those of the male population (<0.001). On the other hand, no difference was observed between the genders when the parameters of BMI and UAC were analyzed.
In the analysis by subjective global assessment (SGA), only 20.2% of the analyzed patients were classiied as malnourished, with no statistically signiicant difference in the anthropometry, as observed in Figure 1.
In the HGS assessment through dynamometry, new decreasing values as the age increased were found in male patients, with a similar tendency observed in the female patients above 40-49 years old, as described in Table 3.
The male patients of ≥60 years of age and the female patients of all ages showed signiicantly less strength (kg) when compared to male patients below 50 years of age.
Characteristics Total Sample
(n = 129)
Age group (years) 20-39
(n = 12)
40-49 (n = 25)
50-59 (n = 35)
≥60 (n = 57)
Age (years) – Mean (SD) 55.1 (11.4) 31.4 (5.81) 45.5 (2.58) 53.8 (2.94) 65.2 (4.35) Gender – n (%)
Male 70 (54.3) 8 (66.7) 15 (60.0) 21 (60.0) 26 (45.6)
Female 59 (45.7) 4 (33.3) 10 (40.0) 14 (40.0) 31 (54.4)
Child – n (%)
A 91 (70.5) 11 (91.7) 15 (60.0) 23 (65.7) 42 (73.7)
B 28 (21.7) 1 (8.3) 6 (24.0) 7 (20.0) 14 (24.6)
C 10 (7.8) 0 (0.0) 4 (16.0) 5 (14.3) 1 (1.8)
Etiology – n (%)
Alcohol 33 (25.6) 1 (8.3) 8 (32.0) 9 (25.7) 15 (26.3)
Virus B 4 (3.1) 0 (0.0) 1 (4.0) 2 (5.7) 1 (1.8)
Virus C 56 (43.4) 1 (8.3) 11 (44.0) 18 (51.4) 26 (45.6)
Virus B + alcohol 1 (0.8) 0 (0.0) 0 (0.0) 0 (0.0) 1 (1.8)
Virus C + alcohol 11 (8.5) 1 (8.3) 1 (4.0) 3 (8.6) 6 (10.5)
Cryptogenic 5 (3.9) 2 (16.7) 0 (0.0) 1 (2.9) 2 (3.5)
Autoimmune 5 (3.9) 2 (16.7) 1 (4.0) 1 (2.9) 1 (1.8)
Others 14 (10.9) 5 (41.7) 3 (12.0) 1 (2.9) 5 (8.8)
TABLE 1. Characterization of the sample constituted of cirrhotic patients
Variables
Gender Total sample
(n = 129)
Male (n = 70)
Female
(n = 59) P-value
1
Mean (SD) Mean (DP) Mean (DP)
Weight (kg) 74.4 (14.9) 78.5 (15.6) 69.6 (12.6) 0.001
Height (cm) 164 (9.19) 170 (6.49) 157 (7.00) <0.001
BNU 27.6 (5.16) 27.1 (4.73) 28.2 (5.61) 0.229
TSF 18.4 (9.24) 14.7 (7.93) 22.8 (8.80) <0.001
UAC 30.4 (4.47) 30.1 (4.43) 30.7 (4.54) 0.478
AMC 24.6 (3.31) 25.4 (3.37) 23.5 (2.95) 0.001
TABLE 2. Descriptive analysis of the anthropometric data by gender
FIGURE 1. Evaluation of the percentage of malnourished individuals according to different methods of nutritional assessment
BMI = body mass index; TSF = tricipital skin fold; AMC = arm muscle circumference; UAC = underarm circumference; SGA = subjective global assessment; BIA = bioelectrical impedance analysis; HGS = hand grip strength.
a, b, c, d Equal letters do not differ through McNemar chi-square test
Regarding the gender, both populations presented lower strength for those above 60 years of age, according to Table 3.
In the HGS method and in the phase angle values, the age groups of male patients presented decreasing values, which does not occur with the female patients.
Women and patients of ≥60 years of age presented a signiicantly lower phase angle when compared to men (P = 0.041) and individuals below 50 years of age (P = 0.001)
(Table 4).
We observed that only male patients of ≥60 years of age and female patients between 50 and 59 years of age presented a signiicantly lower phase angle when compared to the other patients (Table 4).
Figure 1 does not show statistical difference between the different anthropometric methods, except for the BMI, which was similar to TSF only.
The SGA detected a signiicantly higher number of malnourished patients than the BMI, with the similar result in the other anthropometric parameters.
The HGS method detected the higher number of malnourished patients in the studied population, with signiicant difference when compared to the other methods (P = 0.001). The percentage of malnourished patients found
with BIA method presents a statistically signiicant difference (P = 0.001) when compared to the percentages obtained with
the other methods, except for the HGS (P = 0.013), which
detected a higher number of malnourished patients. Table 5 shows that 129 patients were analyzed through BIA and 127 through HGS, 2 patients could not be analyzed through HGS: 1 due to gouty arthritis and 1 for not presenting the minimum strength to manifest pain when trying to compress the grip.
Age group
Cirrhotic men Cirrhotic women
Mean (SD) -2SD Mean (SD) -2SD
20–39 41.4 (10.2) 21.0 19.8 (4.5) 10.8
40–49 33.3 (11.2) 10.9 22.2 (9.08) 4.04
50–59 30.3 (7.53) 15.2 16.0 (7.27) 1.46 ≥60 27.6 (11.2) 5.2 15.8 (8.34) 0.00
TABLE 3. Evaluation through HGS by age and gender
Age group
Cirrhotic men Cirrhotic women
Mean (SD) -2SD Mean (SD) -2SD
20–39 8.40 (2.62) 3.16 6.57 (1.13) 4.31
40–49 6.35 (1.17) 4.01 7.39 (4.32) 0.00
50–59 6.52 (2.04) 2.44 5.47 (1.62) 2.23
≥60 5.63 (1.11) 3.41 7.18 (4.73) 0.00
TABLE 4. Evaluation through phase angle by age group and gender
Etiology
HGS (127) BIA (129)
Malnourished (n = 88; 69.3%)
Nourished (n = 39; 30.7%)
Malnourished (n = 44; 34.1%)
Nourished (n = 85; 65.9%)
n (%) n (%) n (%) n (%)
Virus C 42 (47.7) 13 (33.3) 22 (50.0) 34 (40.0)
Alcohol 21 (23.9) 12 (30.8) 7 (15.9) 26 (30.6)
Others 11 (12.5) 2 (5.1) 7 (15.9) 7 (8.2)
Virus C + alcohol 7 (8.0) 4 (10.3) 5 (11.4) 6 (7.1)
Cryptogenic 3 (3.4) 2 (5.1) 1 (2.3) 4 (4.7)
Autoimmune 3 (3.4) 2 (5.1) 1 (2.3) 4 (4.7)
Virus B 1 (1.1) 3 (7.7) 0 (0.0) 4 (4.7)
Virus B + alcohol 0 (0.0) 1 (2.6) 1 (2.3) 0 (0.0)
TABLE 5. Association of the disease etiology with malnutrition assessed through HGS and BIA
Table 5 also shows that the number of malnourished patients evaluated through HGS is proportional to the number of malnourished patients evaluated through BIA, and that the percentage of malnourished patients through HGS is similar to the percentage of malnourished patients through BIA.
The highest prevalence related to the cirrhosis etiology in malnourished patients, according to HGS and BIA, is virus C, whose indexes are 42 (47.7%) patients through HGS and 22 (50%) through BIA. The second cause veriied was alcohol, with 21(23.9%) through HGS and only seven (15.9%) through BIA.
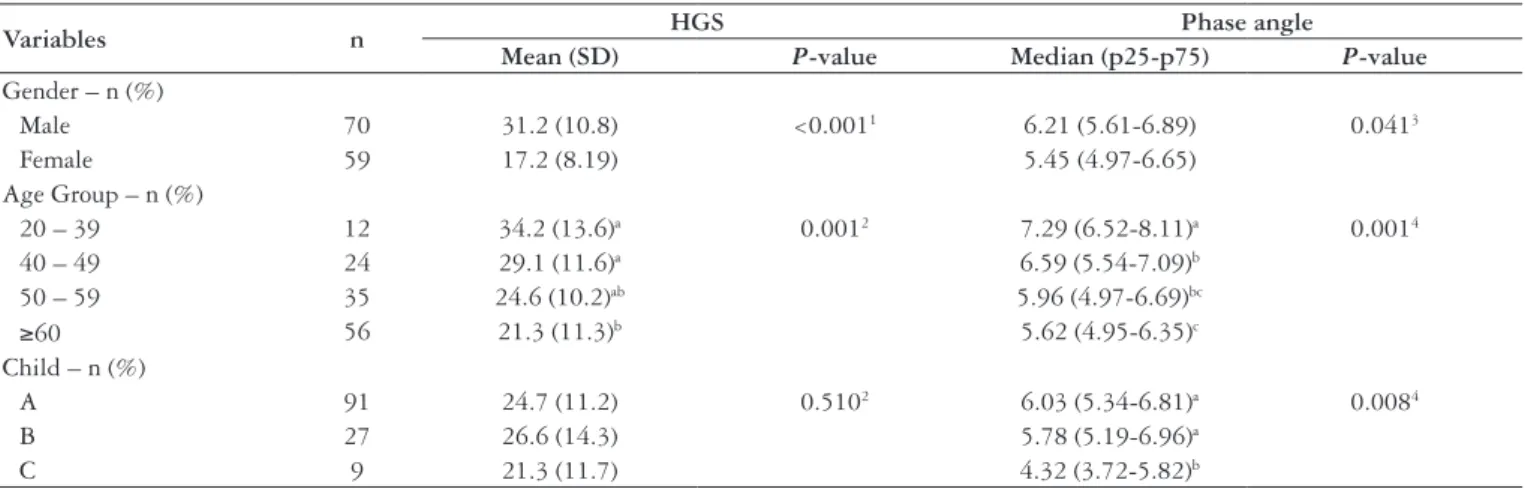
Through phase angle of BIA, a signiicant association with Child-Pugh (P = 0.008) was observed. The patients classiied
as Child-Pugh C presented signiicantly lower phase angle than those classiied as Child-Pugh A and B. For this reason, the patients clinically sorted as A and B were grouped (Table 6).
Besides Child-Pugh, a signiicant association was observed between phase angle, age group, and gender. HGS did not present signiicant relation with Child-Pugh, keeping the relation with age group and gender, as already established as a reference parameter.
Figure 2 shows the analysis and association between HGS and BIA methods, which presented a higher number of malnourished patients, with the disease classiication of Child-Pugh A, B and C. The analysis showed that BIA is the method that presents a statistically signiicant relation between Child-Pugh C and malnutrition.
Figure 3 shows that the ROC curve, generated to determine the best cutoff point of the phase angle of cirrhotic patients, serving as one of the reference parameters for the nutritional assessment with BIA in this study, considering the Child-Pugh classiication as the reference standard for the clinical conditions of patients with cirrhosis.
Was used the ROC curve to identify the cutoff point for malnutrition through the phase angle. Then, the patients
presenting values below 5.44º were classiied as malnourished and the patients with 5.44º or more were classiied as nourished.
As illustrated in Figure 3, sensitivity and speciicity were compared using BIA and HGS, with values of 68.9%-70.0% and 49.2%-56%, respectively.
The comparison between the values found of patients classiied as malnourished, using the two denominations of BIA, i.e., malnourished through BIA, denomination from the reference parameters of Barbosa-Silva et al.(8), and BIA
Cirrhosis, named by the author of this study, showed the agreement of 80.6% of the cases, as illustrated in Figure 4, which is statistically signiicant (Kappa = 0.566, P<0.001).
Figure 4 illustrates the agreement of 70.5% of the malnutrition cases using the two reference parameters: BIA
TABLE 6. Association between the values measured through HGS and phase angle with gender, age group, and Child-Pugh of the patients
HGS = hand grip strength
1 Student’s t-test for independent samples; 2 Analysis of variance (ANOVA), one-way; 3 Mann-Whitney test;
4 Kruskal-Wallis test;
a,b,c Equal letters do not differ through Tukey’s (parametric) test or Mann-Whitney (non-parametric) test
Variables n HGS Phase angle
Mean (SD) P-value Median (p25-p75) P-value
Gender – n (%)
Male 70 31.2 (10.8) <0.0011 6.21 (5.61-6.89) 0.0413
Female 59 17.2 (8.19) 5.45 (4.97-6.65)
Age Group – n (%)
20 – 39 12 34.2 (13.6)a 0.0012 7.29 (6.52-8.11)a 0.0014
40 – 49 24 29.1 (11.6)a 6.59 (5.54-7.09)b
50 – 59 35 24.6 (10.2)ab 5.96 (4.97-6.69)bc
≥60 56 21.3 (11.3)b 5.62 (4.95-6.35)c
Child – n (%)
A 91 24.7 (11.2) 0.5102 6.03 (5.34-6.81)a 0.0084
B 27 26.6 (14.3) 5.78 (5.19-6.96)a
C 9 21.3 (11.7) 4.32 (3.72-5.82)b
0.0 0.0
0.2 0.2
0.4 0.6 0.8 1.0
0.4
1 - Specificity
Sensitivit
0.6 0.8 1.0
Phase angle
Reference line Dynamomete
Phase angle
Area under the curve: 0.794; CI95%:0.64-0.95
Cutoff point: <5.44: malnourished; ≥5.44: well nourished; sensitivity: 68.9% and speciicity: 70.0%
HGS
Area under the curve: 0.565; CI95%:0.38-0.75
Cutoff point: <23: malnourished; ≥23: well nourished; sensitivity: 49.2% and speciic-ity: 56%
FIGURE 3. Receiver operator characteristic (ROC) curve to determine the cutoff point for malnutrition for the phase angle and HGS considering Child-Pugh divided into group 1 = A or B and group 2 = C, as reference standard for the clinical state of cirrhosis.
FIGURE 4. Agreement between BIA and BIA cirrhosis BIA: bioelectrical impedance analysis
and BIA Cirrhosis, which disagree in only 29.5% of the cases. The study found equivalence of 85.9% of the cases of nourished patients, with disagreement of 14.1%.
DISCUSSION
This study was conducted at an outpatient clinic, with most patients clinically classiied as Child-Pugh A and B;
the small group classified as Child-Pugh C might affect data accuracy. Another limitation of this study was the failure to include a control group.
The malnutrition percentages of 11.6% obtained through TSF and 13.2% through AMC disagree with the percentages of Abbott et al.(1) and Alberino et al.(2), which
show 54% of malnourished patients when combining the two methods, and of Merli et al.(27), which suggest AMC
as an indicator of severe malnutrition in patients in the end stage of cirrhosis. The prevalence of overweight was identified in the studied population, when analyzing the BMI, which may present a strong relation with the clinical conditions of the patient, due to water retention and ascites.
Through SGA, 20.2% of the patients in this study were classified as malnourished; in the study conducted by Gottschall et al.(14) with a similar population, the index
achieved 38%. SGA presents sensitivity of 22% in patients with cirrhosis and underestimates the nutritional state of this population in 57%, with overestimation of 6%(13).
Paradoxically, some studies suggest that the benefits of SGA for the nutritional state progress of candidates for kidney transplantation, while other studies showed that SGA detects malnutrition in only 25% of the cases(13, 16, 30, 32).
However, it should be noted that SGA is an instrument composed of quantitative and qualitative variables, subject to varied interpretations, as it is a partially subjective method.
In agreement with the literature, the method that presented the highest proportion of malnourished patients was HGS, with 69.3% of the cases. Álvares-da-Silva et al.(6) observe that the method presents the capacity to
detect 100% of the malnutrition cases and, according to Norman et al.(31), identifies the nutritional risk before the
serious state of malnutrition. In the evaluation of cirrhotic patients hospitalized, HGS presents the best relation with the nutritional state progress of the cirrhotic patient, as in the study, 89% of the malnourished patients were classified as Child-Pugh B and C(34).
This study demonstrated that HGS does not present statistically significant relation with the Child-Pugh classification, described here as a parameter for the clinical condition of the patient with chronic hepatic disease. Knowing that patients classified as Child C are malnourished by definition(5), the study observed the highest
percentage of malnourished patients (93.2%), classified through HGS as Child A and B, and only 6.8% as Child C, reinforcing the non-relation with Child-Pugh.
The study used the reference parameters for HGS, validated by Álvares-da-Silva et al.(3), with healthy individuals. A
discrepancy was observed when comparing it to the values found in the population of cirrhotic patients, a factor that might have contributed to overestimated proportion of cirrhotic patients.
greatest negative impact for the corporal composition determination. The authors suggest that specific values and equations to cirrhotic patients should be created as a reference parameter for the utilization of bioelectrical impedance assessment.
Lee and Gallagher(19) compare BIA to other high-cost
methods, such as bone densitometry, computed tomography and magnetic resonance, in an attempt to identify a low-cost effective method to assess the human corporal composition. This study concludes that BIA presents poor accuracy in individual or group assessments, but effective for a specific population, i.e., individuals without corporal alterations. Lehnert et al.(20) suggest the use of this method
in a serial form, identifying and following the cirrhotic patient’s nutritional state evolution.
The meta-analysis of Kyle et al. (17, 18) describes that
BIA is not an adequate method to patients that present many alterations in the corporal geometric composition, illustrating it with individuals with ascites. The same meta-analysis suggests the use of BIA in a segmental form. Another hypothesis studied is the indication of BIA for nutritional assessment, using the phase angle as a reference value for the method and analyzing the cellularity of the individual impacted by the disease. Schwenk et al.(38) suggest the phase angle as a global
marker for malnourished individuals infected with HIV and discuss that the phase angle reflects the integrity and vitality of the cell membrane.
Gupta et al.(15) demonstrate that the phase angle is
more powerful indicator of survival than the traditional parameters of nutritional assessment, presenting a cutoff point for phase angle of 5.0º, for patients with pancreatic cancer.
Studies demonstrated the correlation of the phase angle as a good prognostic indicator in severe clinical situations(33, 36). Another study that also evaluated patients
with chronic hepatic diseases, presented the cutoff point of 5.4º for the phase angle(39). Coincidently, our study found a
similar cutoff point of 5.44º to characterize malnutrition. Norman et al.(31) describe in their study of BIA
evaluation in nutritional diagnosis, the phase angle as a poor indicator of survival.
BIA, through the phase angle, was the only method that presented a statistically significant relation with Child-Pugh. However, due to the limitation of this study in terms of low number of patients sorted as Child-Pugh C and age group of 20-39 years, it was not possible to validate a specific reference parameter for this population, dividing them by age, gender and Child-Pugh.
However, this limitation does not invalidate our findings with regard to the values of phase angle and to the
agreement with the patient’s clinical condition by Child-Pugh score. We show this agreement through the results of phase angle, by obtaining the same cutoff point as studies by L. Scheunemann et al.(37) and Wagner et al.(41). Given
this fact, the phase angle is a strong prognostic marker regardless of the pathology, since this method evaluates cell capacitance, i.e., the integrity and functionality of the individual’s cell, unlike other methods routinely used for nutritional diagnosis, which are usually based on the patient’s body weight. In our case, this parameter is error-prone.
Based on such data, the total 34.1% of malnourished patients were found through BIA. The study conducted by Barbosa-Silva et al.(8) was used as the reference parameter,
which validates the reference values for the phase angle, for the population of patients from an American hospital, dividing them by age and gender. These results agree with the findings of our study, classifying malnutrition in 33.3% of the sample through BIA cirrhosis, using the phase angle of 5.44º, with agreement of 80.6% between them.
Although no gold standard is said to exist for the assessment of the nutritional state of cirrhotic patients, we suggest future studies using BIA, as it showed a low margin of error, when compared to the other methods. BIA was the only method to present a signiicant relation with Child-Pugh, age group and gender for chronic hepatic diseases.
Figueiredo et al.(13) suggest that the four-compartment
model of assessment, provided by a CT scan, might be sensitive in detecting malnutrition even in early stages of the disease. However, this method is costly and of low reproducibility for assessing the nutritional status of patients and, therefore, it was not used in our research, as it did not fulfill one of the purposes of the study.
CONCLUSIONS
The assessment of the nutritional status of cirrhotic patients and the comparison with different methods show marked discrepancies, with the percentage of malnourished patients ranging from 5.4% to 68.2%.
HGS and BIA showed a very high variation, with malnutrition percentages of 68.2% to 34.1%, respectively.
In the comparison to Child-Pugh score, BIA was the only method that showed to be statistically significant.
Fernandes SA, Bassani L, Nunes FF, Aydos MED, Alves AV, Marroni CA. Avaliação nutricional de pacientes cirróticos. Arq Gastroenterol. 2012;49(1):19-27. RESUMO – Contexto - A desnutrição em pacientes cirróticos com doença em estágio inal é comum, e o grau de debilitação nutricional pode desempenhar
papel importante na patogênese de complicações e causar impacto negativo no prognóstico. No entanto, envolve diiculdades e controvérsias sobre a identiicação do melhor método de avaliação nutricional. Objetivo - Identiicar um método que ofereça diagnóstico nutricional seguro e
eiciente. Métodos - Estudo transversal avaliou 129 pacientes com cirrose hepática. Foram realizadas medidas antropométricas, avaliação subjetiva
global, dinamometria e bioimpedância elétrica. Resultados - Através do ângulo de fase do método BIA, associações signiicativas com Child-Pugh (P = 0,008), faixa etária e sexo foram observadas. A curva ROC (receiver operator characteristic) foi realizada para determinar o melhor ponto de corte do ângulo de fase de pacientes cirróticos, servindo como um dos parâmetros de referência para a avaliação nutricional com bioimpedância neste estudo, considerando a classiicação por pontuação Child-Pugh como o padrão de referência para as condições clínicas dos pacientes com cirrose.
Conclusões - A avaliação por meio de bioimpedância elétrica apresentou correlação estatisticamente signiicativa com o escore de Child-Pugh. A identiicação do ângulo de fase de 5,44º é o novo parâmetro sugerido para a classiicação do estado nutricional de pacientes cirróticos.
DESCRITORES – Cirrose hepática. Impedância elétrica. Desnutrição. Avaliação nutricional.
REFERENCES
1. Abbott WJ, Thomson A, Steadman C, Gatton ML, Bothwell C, Kerlin P, Wall DR, Lynch SV. Child-Pugh class, nutritional indicators and early liver transplant outcomes. Hepatogastroenterology. 2001;48:823-7.
2. Alberino F, Gatta A, Amodio P, Merkel C, Di Pascoli L, Boffo G, Caregaro L. Nutrition and survival in patients with liver cirrhosis. Nutrition. 2001;17:445-50.
3. Álvares-da-Silva MR, Gottschall CA, Pruineli RD, Waetchter FL, Cardoso F, Sampaio JA, Smith MM, Francisconi CFM, Pereira-Lima LM. Nutritional evaluation in liver transplantation. Hepatology. 1998;28:746(A).
4. Álvares–da-Silva MR, Silveira TR. O estudo da força do aperto de mão não-dominante em indivíduos sadios: determinação dos valores de referência para o uso da dinamometria. GED Gastroenterol Endosc Dig. 1998;17:203-6. 5. Álvares-da-Siva MR, Silveira TR. Comparison between handgrip strength, subjective
global assessment, and prognostic nutritional index in assessing malnutrition and predicting clinical outcome in cirrhotic outpatients. Nutrition. 2005;21:113-7. 6. Álvares-da-Siva MR, Silveira TR. Hand-grip strength or muscle mass in cirrhotic
patients: who is the best? Nutrition. 2006;22:218-9.
7. Barbosa-Silva MC, Barros AJ, Post CL, Waitzberg DL, Heymsield SB. Can bioelectrical impedance analysis identify malnutrition in preoperative nutrition assessment? Nutrition. 2003;19:422-6.
8. Barbosa-Silva MC, Barros AJ, Wang J, Heymsield SB, Pierson RN. Bioelectrical impedance analysis: population reference values for phase angle bay age and sex. Am J Clin Nutr. 2005;82:49-52.
9. Detsky AS, McLaughlin JR, Baker JP, Johnston N, Whittaker S, Mendelson RA, Jeejeebhoy KN. What is subjective global assessment of nutritional status? JPEN J Parenter Enteral Nutr. 1987;11:8-13.
10. Duarte AC. Semiologia imunológica nutricional. Rio de Janeiro: Axcel Books do Brasil; 2003.
11. Duarte ACG. Avaliação nutricional: aspectos clínicos e laboratoriais. São Paulo: Atheneu; 2007.
12. Figueiredo F, Dickson ER, Pasha T, Kasparova P, Therneau T, Malinchoc M, DiCecco S, Francisco-Ziller N, Charlton M. Impact of nutritional status on outcome after liver transplantation. Transplantation. 2000;70:1347-52. 13. Figueiredo FA, Perez RM, Freitas MM, Kondo M. Comparison of three
methods of nutritional assessment in liver cirrhosis: subjective global assessment, traditional nutritional parameters, and body composition analysis. J Gastroenterol. 2006;41:476-82.
14. Gottschall CB, Alvares-da-Silva MR, Camargo AC, Burtett RM, da Silveira TR. [Nutritional assessment in patients with cirrhosis: the use of indirect calorimetry]. Arq Gastroenterol. 2004;41:220-4.
15. Gupta D, Lis CG, Dahlk SL, Vashi PG, Grutsch JF, Lammersfeld CA. Bioelectrical impedance phase angle as a prognostic indicator in advanced pancreatic cancer. Br J Nutr. 2004;92:957-62.
16. Hasse J, Strong S, Gorman MA, Liepa G. Subjective global assessment: alternative nutrition-assessment technique for live transplant candidates. Nutrition. 1993;9:339-43.
17. Kyle UG, Bosaeus I, De Lorenzo AD, Deurenberg P, Elia M, Gómez JM, Heitmann BL, Kent-Smith L, Melchior JC, Pirlich M, Sharfetter H, Schols AM, Pichard C, Composition of the ESPEN Working Group. Bioelectrical impedance
analysis–part I: review of principles and methods. Clin Nutr. 2004;23:1226-43. 18. Kyle UG, Bosaeus I, De Lorenzo AD, Deurenberg P, Elia M, Manuel Gómez J,
Lilienthal Heitmann B, Kent-Smith L, Melchior JC, Pirlich M, Scharfetter H, M W J Schols A, Pichard C, ESPEN. Bioelectrical impedance analysis–part II: utilization in clinical practice. Clin Nutr. 2004;23:1430-53.
19. Lee SY, Gallagher D. Assessment methods in human body composition. Curr Opin Clin Nutr Metab Care. 2008;11:566-72.
20. Lehnert ME, Clarke DD, Gibbons JG, Ward LC, Golding SM, Shepherd RW, Cornish BH, Crawford DH. Estimation of body water compartments in cirrhosis by multiple-frequency bioelectrical-impedance analysis. Nutrition. 2001;17:31-4. 21. Lochs H, Plauth M. Liver cirrhosis: rationale and modalities for nutritional
support – the European Society of Parenteral and Enteral Nutrition consensus and beyond. Curr Opin Clin Nutr Metab Care. 1999;2:345-9.
22. Ma Z, Zhang Y, Huet PM, Lee SS. Differential effects of jaundice and cirrhosis on alfa-adrenoceptor signalling in three rat models of cirrhotic cardiomyopathy. J Hepatol. 1999;30:485-91.
23. Maio R, Dichi JB, Burini RC. [Nutritional consequences of metabolic impairment of macronutrients in chronic liver disease]. Arq Gastroenterol. 2000;37:52-7. 24. Mccullough AJ, Bugianesi E. Protein-calorie malnutrition and the etiology of
cirrhosis. Am J Gastroenterol. 1997;92:734-8.
25. Mccullough AJ. Nutritional state and abnormal metabolism of nutrients. American Association for the Study of Liver Diseases. Postgraduate course: newer aspects on alcohol, nutrition and hepatic encephalopathy, 1992; 204-44.
26. Mccullough AJ. Malnutrition and liver disease. Liver Transpl 2000;(4 Suppl 1):S85-96.
27. Merli M, Riggio O, Dally L. Does malnutrition affect survival cirrhosis? PINC (Policentrica Italiana Nutrizione Cirrosi). Hepatology. 1996;23:1041-6. 28. Miwa Y, Shiraki M, Kato M, Tajika M, Mohri H, Murakami N, Kato T, Ohnishi
H, Morioku T, Muto Y, Moriwaki H. Improvement of fuel metabolism by nocturnal energy supplementation in patients with liver cirrhosis. Hepatol Res. 2000;18:184-9.
29. Müller MJ, Boker KH, Selberg O. Are patients with liver cirrhosis hypermetabolic? Clin Nutr. 1994;13:131-44.
30. Naveau S, Belda E, Borotto E, Genuist F, Chaput JC. Comparision of clinical judgment and antropometric parameters for evaluating nutritional status in patients with alcoholic liver disease. J Hepatol. 1995;23:234-5.
31. Norman K, Smoliner C, Valentini L, Lochs H, Pirlich M. Is bioelectrical impedance vector analysis of value in the elderly with malnutrition and impaired functionality? Nutrition. 2007;23:564-9.
32. Nutritional status in cirrhosis. Italian Multicentre Cooperative Project On Nutrition In Liver Cirrhosis. J Hepatol. 1994;21:317-25.
33. Ott M, Fischer H, Polat H, Helm EB, Franz M, Caspary WF, Lembcke B. Bioelectrical impedance analysis as a predictor of survival in patients with human immunodeiciency virus infection. J Acquir Immune Deic Syndr Hum Retrovirol. 1995;9:20-5.
34. Piquet MA, Ollivier I, Gloro R, Castel H; Tiengou LE; Dao T. Nutritional indices in cirrhotic patients. Nutrition. 2006;22:216-7.
35. Pirlich M, Schütz T, Spachos T, Ertl S, Weiss ML, Lochs H, Plauth M. Bioelectrical impedance analysis is a useful bedside technique to assess malnutrition in cirrhotic patients with and without ascites. Hepatology. 2000;32:1208-15.
37. Scheunemann L, Wazlawik E, Bastos JL, Ristow TC, Mayumi NL. Agreement and association between the phase angle and parameters of nutritional status assessment in surgical patients. Nutr Hosp. 2011;26:480-7.
38. Schwenk A, Beisenherz A, Römer K, Kremer G, Salzberger B, Elia M. Phase angle from bioelectrical impedance analysis remains an independent predictive marker in HIV-infected patients in the era of highly active antiretroviral treatment. Am J Clin Nutr. 2000;72:496-501.
39. Selberg O, Selberg D. Norms and correlates of bioimpedance phase angle in healthy human subjects, hospitalized, and patients with liver cirrhosis. Eur J Appl Physiol. 2002;86:509-16.
40. University of Minnesotta Morris. Adolphe Quetelet. Internet:http://www.morris. umn.edu/~sungurea/introstat/history/w98/Quetelet.html (accessed 14 July 2009).
41. Wagner D, Adunka C, Kniepeiss D, Jakoby E, Schaffellner S, Kandlbauer M, Fahrleitner-Pammer A, Roller RE, Kornprat P, Müller H, Iberer F, Tscheliessnigg KH. Serum albumin, subjective global assessment, body mass index and the bioimpedance analysis in the assessment of malnutrition in patients up to 15 years after liver transplantation. Clin Transplant. 2011;3:1-5.
42. World Health Organization. Physical status: the use and interpretation of anthropometry. Geneva: WHO, 1995. (WHO - technical report series 854).