No Relationship between Serum and Salivary
β
2-Microglobulin Levels in A Sample of Adult Diabetic
Men with Chronic Kidney Disease without Renal
Replacement Therapy
Ahmadreza Assareh, M.D.1, Habib Haybar, M.D.1*, Hosein Malekzadeh, D.D.S.2, Leila Yazdanpanah, M.D.3, Mohammadreza Bozorgmanesh, M.D.4
1. Cardiovascular Research Center, Golestan Hospital , Ahvaz Jundishapur University of Medical Science, Ahvaz, Iran 2. Department of Oral Medicine, Ahvaz Jundishapur University of Medical Science, Ahvaz, Iran
3. Diabetes Research Center, Ahvaz Jundishapur University of Medical Science, Ahvaz, Iran
4. Prevention of Metabolic Disorders Research Center, Research Institute for Endocrine Sciences (RIES), Shahid Beheshti University of Medical Sciences, Tehran, Iran
*Corresponding Addresses: P.O. Box: 173, Cardiovascular Research Center, Golestan Hospital, Ahvaz Jundishapur Univer-sity of Medical Science, Ahvaz, Iran
Email: [email protected]
Received: 11/Nov/2012, Accepted: 6/Jul/2013
Abstract
Objective: Β2-microglobulin (β2M) associated amyloidosis is an inevitable complication of chronic kidney disease (CKD). Testing β2M in the blood is invasive and expensive. On
the other hand, oral luid is a perfect medium to be explored for public health and disease surveillance. However, it has never been studied if salivary concentration of β2M relects
its concentration in the serum. The current study; therefore, aimed to examine the relation-ship between salivary and serum β2M in a sample of adult diabetic men with CKD.
Materials and Methods: Among diabetic patients referred to the Nephrology Department of The Golestan Hospital of Ahvaz due to CKD, 40 men not requiring renal replacement therapy were consecutively recruited for this cross-sectional study. Patients were exclud-ed if they had any disease or were using any drugs that might affect the oral mucosa or saliva. The concentration of β2M was measured in both serum and saliva. The correlation
between serum and salivary β2M was measured by calculating spearman’s ρ.
Results: The Spearman’s ρ for correlation between serum and salivary β2M was -0.017
(p=0.917), indicating lack of correlation. Serum and salivary creatinine (Spearman’s ρ=0.54; p value<0.001) as well as serum and salivary urea nitrogen levels (Spearman’s ρ=0.39; p value=0.014) were correlated.
Conclusion: Salivary β2M levels poorly agreed with serum β2M levels, and thus may not be used as a surrogate for serum β2M in CKD patients who did not require replacement therapy.
Keywords: β2-Microglobulin, Chronic Kidney Disease, Saliva
Cell Journal(Yakht eh), Vol 16, No 2, Sum m er 2014, Pages: 179- 186
Citation: Assareh AR, Haybar H, Malekzadeh H, Yazdanpanah L, Bozorgmanesh M. No relationship between serum
and salivary β2-microglobulin levels in a sample of adult diabetic men with chronic kidney disease without renal
re-placement therapy. Cell J. 2014; 16(2): 179-186.
Introduction
The number of patients with chronic kidney dis-ease (CKD) is rising rapidly worldwide (1), and CKD is increasingly recognized as a global public health burden (2, 3). Diabetes mellitus is the most common cause of end stage renal disease (ESRD) in many countries, and it has been estimated that 366 million people will have diabetes mellitus by
cardiovascular disease (CVD). These advances must be translated to simple and applicable public health measures. Developing a public health poli-cy to improve outcomes entails the understanding the relationship between CKD and other chronic diseases (2).
Kidney failure requiring renal replacement therapy (dialysis or renal transplantation) is the most visible outcome of CKD. However, CVD frequently complicates CKD and individuals with CKD are more likely to die of CVD than to de-velop kidney failure (6-10), this disease could po-tentially be treated and prevented among patients with CKD (11, 12).
Β2-microglobulin (β2M) associated amyloidosis
is considered an inevitable complication of chron-ic hemodialysis (13). β2M constitutes a light chain
of the class I major histocompatibility complex. Widely distributed in nucleated cells in the body, β2M is especially rich in immunocompetent cells,
such as lymphocytes or monocytes. Various stim-uli cause substantial amounts of the molecule to be shed into the circulation (14). Circulating β2M
is iltered through the glomeruli and is reabsorbed and metabolized in the proximal tubules of the kid-neys (14). Therefore, the plasma concentration of β2M is largely affected by the glomerular iltration
rate (GFR) of the kidneys. Β2M has recently been
shown to be related to risk factors of the athero-sclerosis, coronary heart disease (15, 21), cardio-vascular (20) and total mortality (15, 21).
Due to peripheral venous access dificulty in CKD patients, the plasma concentration of β2M
microglobulin is not applicable to them. Saliva, as a unique luid of diagnostic medium, has advanced exponentially in the last decade. While testing β2M
in the blood is invasive, there are less invasive methods available to test β2M in saliva. The ability
to measure and to monitor a wide range of mo-lecular components in saliva and to compare their levels to plasma components levels have made possible to study microbes, chemicals, and immu-nologic markers (22, 23).
It has, however, not been studied if salivary concentration of β2M relects its concentration in the serum. If it has been the case, salivary β2M would have provided a unique opportunity as a simple chair-side tool for periodical assessment of patients with CKD. The current study, therefore, aimed to examine the relationship between
sali-vary and serum β2M in a sample of adult diabetic men with CKD.
Materials and Methods
Patients and design
Among diabetic patients referred for CKD to the Nephrology Department of the Golestan Hospital of Ahvaz, Ahvaz, Iran, 40 male were consecutive-ly recruited for the current cross-sectional study. Patients were excluded if they had parageusia (4), were smoker (2) or using any drugs having affect-ed their salivary low or content, or if there was any other evidence of a systemic disease affecting the oral mucosa or saliva. Patients who required renal replacement therapy were also excluded. Re-nal replacement therapy is initiated once patients have stage 5 disease or signs of uremia, including lack of appetite, nausea, vomiting, acidosis, hyper-kalemia, or luid overload (24).
Measurements
After a period of 8 to 12-hour overnight fasting, non-stimulated saliva samples were taken from all participants. Participants were instructed not to speak during the saliva collection period. To prevent changes in salivary composition during a 24-hour period, they were instructed not to eat, drink, and use toothbrush, toothpaste, or mouth-wash since 2 hours before sample collection. Par-ticipants were asked to spit their saliva into a test tube 5 minutes after they washed and rinsed their mouth with water. The sampling was then contin-ued until 10 ml of saliva specimen was collected. A Blood sample (5 ml) was also taken from all participants via venipuncture. Serum and salivary
β2M was measured using Minineph Human Kit
(Binding Site Co., UK), while urea and creatinine in saliva and blood samples were measured using Pars Azmun Kit (Pars Azmoon Inc., Tehran, Iran).
Deinitions of terms
GFR was estimated using Cockcroft-Gault equa-tion (25):
(140 ) * *
* 72
Cr
Cr
age Weight GF C
P − =
men and 0.85 for women. We did not used the equation derived from the Modiication of Diet in Renal Disease (MDRD) study because it was not validated for diabetic kidney disease (2).
CKD was deined as kidney damage for ≥3 months and/or GFR <60 ml.minute-1 per 1.73 m2
for ≥3 months with or without kidney damage.
Kidney damage was deined as structural or func
-tional abnormalities of the kidney, initially with-out decreased GFR (26). ESRD was ascertained in participants with GFR <15 ml.minute-1 (27).
Xerostomia was deined clinically. According to the medical literature, dryness of the cheek mu-cosa was determined by visual examination, pal-pation and adherence degree of mucosal surface using a wooden spatula (28). Hypertension, dia-betes, smoking, and parageusia were diagnosed by self-reporting.
Statistical analysis
Data are presented as either mean (SD) or fre-quency (%) for continuously-and categorically-distributed variables, respectively. Median [in-terquartile range (IQR)] used for continuously distributed variable revealed that distribution was not normal.
The linear regression model was used to exam-ine the statistical signiicance of the association between serum β2M, while controlling for age. We
used Spearman’s ρ as a coeficient of concordance between serum β2M and salivary β2M, of
concord-ance between serum urea nitrogen and salivary urea nitrogen, and of concordance between serum creatinine and salivary creatinine.
Instead of using arbitrary predetermined cut-points to capture nonlinear aspects of association, we used restricted cubic splines functions of the salivary β2M to represent their continuous
relation-ship with the serum β2M, so that the relationships
were meaningfully in accordance with substan-tive background knowledge. Splines functions, as phrased by Harrell, are "piecewise polynomials within the intervals of a variable that are connect-ed across different intervals of that variable" (29). Restricted cubic splines function enabled us to use lexibly model continuous predictors (salivary β2M), while allowing us to control over the
exces-sive instability and tendency of spline functions in order to generate artifactual and uninterpretable
features of a curve. Multivariate restricted cubic splines were used with 4 knots deined at 5th, 25th,
75th, and 95th percentiles (29). In variable
selec-tion, we dropped a variable if its removal caused a non-signiicant increase in deviance.
We used several criteria to compare the overall predictive values of alternative models. In addition, the outcome variables are referred to goodness-of-it when a model effectively describes them. We used following measures of goodness-of-it.
1. Deviance compared the it of the saturated model to the itted model. This was a small value if the model was good. For purposes of assessing the signiicance of non-linear terms, the values of D with and without the non-linear terms were com-pared by likelihood ratio test.
2. Akaike information criterion (AIC) was used
to account for complexity. Difference in AIC >10 was considered signiicant (30).
Ancillary analysis
In order to apply ancillary analysis, we exam-ined the predictive ability of the serum and sali-vary β2M for renal failure. Owing to high preva-lence rate of renal failure in the study sample, the odds ratios obtained from the logistic regression model would be excessively large. When a study outcome is rare, the odds ratio estimate of causal effects will approximately be the risk ratio. How-ever, if a study outcome is common (>10%), the odds ratio will be further from 1 than the risk ratio (31, 32). We, thus, used the Cox proportional haz-ard regression model with time as constant vari-able to approximate risk ratio in order to avoid the renal failure for increasing levels of β2M.
The signiicance levels for selection of spline functions by backward elimination were set at 0.1. For salivary β2M, however, we set the signiicance
Jundis-hapur University of Medical Sciences approved this study.
Results
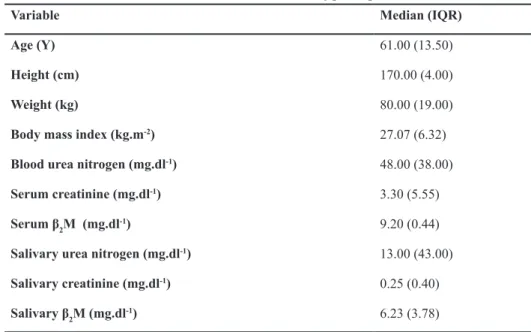
Mean age of the participant was 60.6 (14.0) years. ESRD was documented in 15 out of 40 participants (38.5%). Baseline characteristics of participants have been presented in table 1. The
median and IQR of serum and of salivary β2M
were 9.20 (0.44) and 6.23 (3.78), respectively. All patients were at taking either angiotensin convert-ing enzyme inhibitor or angiotensin II receptor an-tagonist.
As shown in the table 2, none of the studied
variables were associated with serum β2M, while
showing a p>0.1.
Table 1: Baseline characteristics of participants
Median (IQR) Variable
61.00 (13.50)
Age (Y)
170.00 (4.00)
Height (cm)
80.00 (19.00)
Weight (kg)
27.07 (6.32)
Body mass index (kg.m-2)
48.00 (38.00)
Blood urea nitrogen (mg.dl-1)
3.30 (5.55)
Serum creatinine (mg.dl-1)
9.20 (0.44)
Serum β2M (mg.dl -1)
13.00 (43.00)
Salivary urea nitrogen (mg.dl-1)
0.25 (0.40)
Salivary creatinine (mg.dl-1)
6.23 (3.78)
Salivary β2M (mg.dl -1)
Table 2: Association of β2M with different variables
95% CIs P value
Z SE
Regression coeficient (β)1
Variable
3.86 -2.47
0.663 0.44
1.56 0.70
Body mass index (kg.m-2)
28.50 -13.27 0.461
0.74 10.30
7.62
Serum urea nitrogen (mg/dl)
3.66 -0.75
0.194 1.34
1.09 1.45
Serum creatinine (mg/dl)
24.11 -15.25 0.651
0.46 9.71
4.43
Salivary urea nitrogen (mg/dl)
0.34 -0.15
0.453 0.77
0.12 0.09
Salivary creatinine (mg/dl)
2.15 -0.72
0.322 1.01
0.71 0.71
Salivary β2M (mg/dl)
The Spearman’s ρ for correlation between serum and salivary β2M was -0.017 (p=0.917), indicat-ing lack of correlation. We also investigated the nonlinear association between serum and salivary β2M and found no evidence of nonlinearity as is depicted in the igure 1.
Serum and salivary creatinine (Spearman’s ρ=0.54; p<0.001) as well as serum and sali -vary urea nitrogen levels (Spearman’s ρ=0.39; p=0.014)) were correlated.
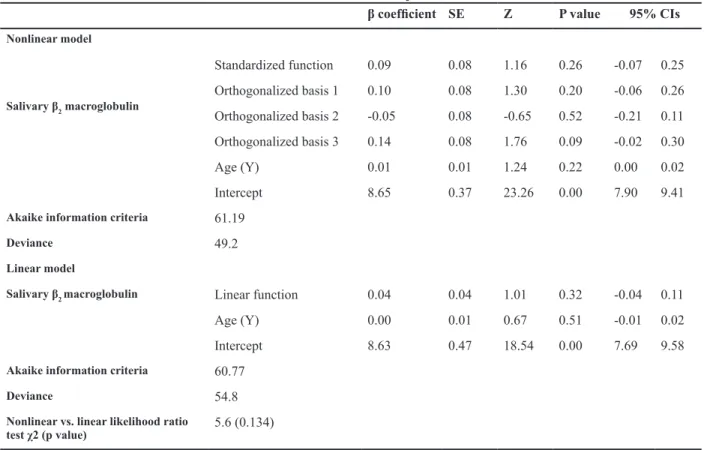
Increasing concentrations of serum β2M
(RR=1.44, 95% CIs: 0.41-5.05; p=0.571) and
salivary β2M (RR=1.06, 95% CIs: 0.82-1.36;
p=0.671) were associated with non-significant increased risk of ESRD. We also investigated the nonlinear association between serum and
salivary β2M. The incorporating natural cubic
spline functions of the Salivary β2
Macroglobu-lin (nonMacroglobu-linear Macroglobu-linear term only (likelihood ratio test χ2=5.4; p=0.134). As shown in the table 3, it
is evident that there are no significant improve-ments in the values of AIC.
Serum
β2
-micrglobulin (mg
/dl)
9.5
9.3
9.1
8.9
8.7
8.5
Salivary β2-micrglobulin (mg/dl)
0 2 4 6 8 10
Fig 1: The nonlinear association between serum and sali-vary β2M.
Table 3: Nonlinear versus linear association between salivary β2 macroglobulin and end stage renal disease
95% CIs P value
Z SE
β coeficient
Nonlinear model
0.25 -0.07 0.26
1.16 0.08
0.09 Standardized function
Salivary β2 macroglobulin
0.26 -0.06 0.20
1.30 0.08
0.10 Orthogonalized basis 1
0.11 -0.21 0.52
-0.65 0.08
-0.05 Orthogonalized basis 2
0.30 -0.02 0.09
1.76 0.08
0.14 Orthogonalized basis 3
0.02 0.00 0.22
1.24 0.01
0.01 Age (Y)
9.41 7.90 0.00
23.26 0.37
8.65 Intercept
61.19
Akaike information criteria
49.2
Deviance
Linear model
0.11 -0.04 0.32
1.01 0.04
0.04 Linear function
Salivary β2 macroglobulin
0.02 -0.01 0.51
0.67 0.01
0.00 Age (Y)
9.58 7.69 0.00
18.54 0.47
8.63 Intercept
60.77
Akaike information criteria
54.8
Deviance
5.6 (0.134)
Nonlinear vs. linear likelihood ratio
Discussion
Using a blood sample of adult diabetic men with CKD, we examined the concordance between
se-rum and salivary β2M and observed that salivary
β2M levels poorly agreed with serum β2M levels, and thus may not be used as a surrogate for serum β2M. We observed, however, a moderate correla-tion between serum and salivary levels of creati-nine and urea.
Our inding of interest was that both salivary and serum levels of β2M predicted the presence of ESRD, although the contributions failed to achieve statistical signiicance. The degree of accumula -tion of β2M in patients undergoing hemodialysis
have been previously observed to depend on the loss of renal excretory function (33). In patients with chronic renal failure, β2M levels have been
observed to parallel an increase in serum creati-nine. A dramatic decrease in beta β2M levels have
been reported to be correlated with improvement in GFR (34).
Zhang et al. (35) have argued that for clinical applications, such as monitoring health status, disease onset and progression, and treatment out-come, there are following three necessary prereq-uisites:
1.A simple method for collecting biologic sam-ples, ideally noninvasively.
2.Speciic biomarkers associated with health or disease.
3.A technology platform to rapidly utilize the biomarkers.
β2M has been demonstrated to be a major prog-nosticator of mortality in hemodialytic patients, independent of hemodialysis length, diabetes, malnutrition and chronic inlammation, suggest -ing the clinical importance of lower-ing and peri-odical monitoring of serum β2M in these patients (36). However, venipuncture of the patients with CKD is an exhausting task to accomplish both for patients and health care providers. It is a highly desired skill in health care promotion and deliv-ery to monitor health status, disease onset and pro-gression, and treatment outcome through nonag-gressive methods. Saliva is considered a complete medium to be explored for health and disease in-spection (37). Saliva is appealing in that thereof taking samples does not require invasive
proce-dure. It is commonly considered as the 'mirror of the body', and can be a perfect alternate method for clinical diagnostic (35). Utilizing easily acces-sible saliva for evaluating CKD may enable front-line care providers to become more involved and proactive in the management of CKD, facilitating a new way in order to focus on early detection and targeted interventions of vulnerable persons.
Achieving the goal of salivary diagnostics needs two prerequisites to be completed irst:
1. Identiication of speciic biomarkers associ -ated with a health or disease state.
2. The development of technologies that can dis-criminate between the biomarkers.
Recently, National Institute of Dental and Crani-ofacial Research has set a goal of using saliva as the diagnostic medium to evaluate the health or disease status of patients. This attempt could be looked upon as an ideal opportunity to optimize state-of-the-art saliva-based biosensors for sali-vary biomarkers that discriminate between dis-eases (37).
We observed a moderate correlation between se-rum and salivary levels of creatinine and urea. The concentration of salivary creatinine has been docu-mented to be 10-15% of serum creatinine concen-trations in healthy people. It has been, however, argued that this proportion may not hold among patients with renal disease. It has been shown that salivary creatinine estimations may be used to identify subjects with serum creatinine concentra-tions above 120 mmol.l-1 (38). Goll and Mook-erje have pointed that "in hemodialysis patients, concentration of serum creatinine and uric acid is correlated with those in simultaneously drawn un-stimulated whole saliva before and after dialysis" (39). The same indings have also been observed among patients with moderate renal failure not requiring the chronic hemodialysis. Use of whole saliva in this setting may preclude the iatrogenic component in anemia by cutting down the fre-quency of venipuncture; this could be of greater importance to young patients. On the other hand, it has been argued that salivary composition in pa-tients with CKD varies by the stage of renal failure (40).
Limitations
of β2M. Furthermore, levels of serum β2M did not
vary among participants in the current study. We failed to demonstrate any association between in-creased levels of serum or salivary β2M and ESRD.
Wide conidence intervals indicated that our sam
-ple size probability did not have enough statistical power to capture the trivial associations observed.
Conclusion
Using a blood sample of adult diabetic men with CKD, we examined the concordance between se-rum and salivary β2M and observe that salivary
β2M levels poorly agreed with serum β2M levels, and thus may not be used as a surrogate for serum β2M in this highly selected subgroup of patients. Future prospective studies with larger sample size will be required to investigate whether β2M
can predict development of ESRD or not. We ob-served, however, a moderate correlation between serum and salivary levels of creatinine and urea. The clinical relevance of these indings remains to be illustrated.
Acknowledgments
The authors express their gratitude to the partici-pants for their time and patience. We are also grate-ful to the anonymous referees for their thoughtgrate-ful and constructive comments. Special thanks to Molook Salemzadeh, Clinical Development Re-search Center of Golestan Hospital, for methodol-ogy and submission consultation, as well as Minoo Baratifar for data collection. The authors have no conlict of interest in this article.
References
1. Hamer RA, El Nahas AM. The burden of chronic kidney
disease. BMJ. 2006; 332(7541): 563-564.
2. Levey AS, Coresh J, Balk E, Kausz AT, Levin A, Steffes MW, et al. National kidney foundation practice guidelines
for chronic kidney disease: evaluation, classiication, and stratiication. Ann Intern Med. 2003; 139(2): 137-147. 3. Sarnak MJ, Levey AS, Schoolwerth AC, Coresh J,
Culle-ton B, Hamm LL, et al. Kidney disease as a risk factor for
development of cardiovascular disease: a statement from
the American Heart Association Councils on Kidney in Cardiovascular Disease, High Blood Pressure Research, Clinical Cardiology, and Epidemiology and Prevention.
Circulation. 2003; 108(17): 2154-2169.
4. Wild S, Roglic G, Green A, Sicree R, King H. Global
prev-alence of diabetes: estimates for the year 2000 and pro
-jections for 2030. Diabetes Care. 2004; 27(5): 1047-1053. 5. Weiner DE, Tighiouart H, Amin MG, Stark PC, MacLeod
B, Grifith JL, et al. Chronic kidney disease as a risk fac
-tor for cardiovascular disease and all-cause mortality: a
pooled analysis of community-based studies. J Am Soc
Nephrol. 2004; 15(5): 1307-1315.
6. Shulman NB, Ford CE, Hall WD, Blaufox MD, Simon D, Langford HG, et al. Prognostic value of serum creatinine and effect of treatment of hypertension on renal function. Results from the hypertension detection and follow-up program. The Hypertension Detection and Follow-up
Pro-gram Cooperative Group. Hypertension. 1989; 13 Suppl 5: I80-I93.
7. Culleton BF, Larson MG, Wilson PWF, Evans JC, Parfrey PS, Levy D. Cardiovascular disease and mortality in a
community-based cohort with mild renal insuficiency. Kid
-ney Int. 1999; 56(6): 2214-2219.
8. Shlipak MG, Simon JA, Grady D, Lin F, Wenger NK,
Furb-erg CD. Renal insuficiency and cardiovascular events in
postmenopausal women with coronary heart disease. J
Am Coll Cardiol. 2001; 38(3): 705-711.
9. Sarnak MJ, Levey AS. Cardiovascular disease and
chron-ic renal disease: a new paradigm. Am J Kidney Dis. 2000; 35(4 Suppl 1): S117-S131.
10. Parfrey PS, Foley RN. T The clinical epidemiology of car-diac disease in chronic renal failure. J Am Soc Nephrol.
1999; 10(7): 1606-1615.
11. Levey AS, Beto JA, Coronado BE, Eknoyan G, Foley RN, Kasiske BL, et al. Controlling the epidemic of
cardiovas-cular disease in chronic renal disease: what do we know? What do we need to learn? Where do we go from here?.
National Kidney Foundation Task Force on
Cardiovascu-lar Disease. Am J Kidney Dis. 1998; 32(5): 853-906.
12. McCullough PA. Why is chronic kidney disease the
"spoiler" for cardiovascular outcomes?. J Am Coll Cardiol. 2003; 41(5): 725-728.
13. Schwalbe S, Holzhauer M, Schaeffer J, Galanski M, Koch KM, Floege J. Beta 2-microglobulin associated
amyloido-sis: a vanishing complication of long-term hemodialysis?. Kidney Int. 1997; 52 (4): 1077-1083.
14. Vincent C, Chanard J, Caudwell V, Lavaud S, Wong T,
Re-villard JP. Kinetics of 125I-beta 2-microglobulin turnover in dialyzed patients. Kidney Int. 1992; 42 (6): 1434-1443. 15. Astor BC, Shai T, Hoogeveen RC, Matsushita K, Ballan
-tyne CM, Inker LA, et al. Novel markers of kidney function
as predictors of ESRD, cardiovascular disease, and mor-tality in the general population. Am J Kidney Dis. 2012;
59(5): 653-662.
16. Saijo Y, Utsugi M, Yoshioka E, Horikawa N, Sato T, Gong Y, et al. Relationship of beta2-microglobulin to arterial
stiff-ness in Japanese subjects. Hypertens Res. 2005; 28(6): 505-511.
17. Zumrutdal A, Sezer S, Demircan S, Seydaoglu G,
Oz-demir FN, Haberal M. Cardiac troponin I and beta 2 mi -croglobulin as risk factors for early-onset atherosclerosis
in patients on haemodialysis. Nephrology (Carlton). 2005; 10(5): 453-458.
18. Wilson AM, Kimura E, Harada RK, Nair N, Narasimhan B, Meng XY, et al. Beta2-microglobulin as a biomarker in
peripheral arterial disease: proteomic proiling and clinical studies. Circulation. 2007; 116(12): 1396-1403.
19. Amighi J, Hoke M, Mlekusch W, Schlager O, Exner M, Haumer M, et al. Beta 2 microglobulin and the risk for car-diovascular events in patients with asymptomatic carotid
atherosclerosis. Stroke. 2011; 42(7): 1826-1833.
20. Liabeuf S, Lenglet A, Desjardins L, Neirynck N, Glorieux G, Lemke HD, et al. Plasma beta-2 microglobulin is as-sociated with cardiovascular disease in uremic patients.
Kidney Int. 2012; 82(12): 1297-1303.
21. Okuno S, Ishimura E, Kohno K, Fujino-Katoh Y, Maeno Y, Yamakawa T, et al. Serum beta2-microglobulin level is a
signiicant predictor of mortality in maintenance haemo
571-577.
22. Slavkin HC. Toward molecularly based diagnostics for the
oral cavity. J Am Dent Assoc. 1998; 129(8): 1138-1143. 23. Streckfus CF, Bigler LR. Saliva as a diagnostic luid. Oral
Dis. 2002; 8(2): 69-76.
24. Arici M. 'Ideal criteria' for starting chronic hemodialysis:
numbers, symptoms or an alerting 'trafic light' system? Nephron Clin Pract. 2012; 120(1): c17-24.
25. Cockcroft DW, Gault MH. Prediction of creatinine
clear-ance from serum creatinine. Nephron. 1976; 16(1): 31-41.
26. Levey AS, Eckardt KU, Tsukamoto Y, Levin A, Coresh J,
Rossert J, et al. Deinition and classiication of chronic kid
-ney disease: a position statement from Kid-ney Disease: Improving Global Outcomes (KDIGO). Kidney Int. 2005; 67(6): 2089-2100.
27. Hsu CY, Chertow GM. Chronic renal confusion: insufi -ciency, failure, dysfunction, or disease. Am J Kidney Dis.
2000; 36(2): 415-418.
28. Berti-Couto Sde A, Couto-Souza PH, Jacobs R,
Nack-aerts O, Rubira-Bullen IR, Westphalen FH, et al. Clinical
diagnosis of hyposalivation in hospitalized patients. J Appl
Oral Sci. 2012; 20(2): 157-161.
29. Harrell FE. Spingers Series in Statistics: Regression mod
-eling strategies. New York: Springer; 2001; 19-20. 30. Akaike H. A new look at the statistical model identiication.
IEEE Trans Automat Contr. 1974; 19(6): 716-723. 31. Cummings P. The relative merits of risk ratios and odds
ratios. Arch Pediatr Adolesc Med. 2009; 163(5): 438-445. 32. Zhang J, Yu KF. What’s the relative risk?. A method of cor
-recting the odds ratio in cohort studies of common
out-comes. JAMA. 1998; 280(19): 1690-1691.
33. Floege J, Bartsch A, Schulze M, Shaldon S, Koch KM, Smeby LC. Clearance and synthesis rates of beta 2-mi-croglobulin in patients undergoing hemodialysis and in
normal subjects. J Lab Clin Med. 1991; 118(2): 153-165. 34. Acchiardo S, Kraus AP Jr, Jennings BR. Beta
2-microglob-ulin levels in patients with renal insuficiency. Am J Kidney Dis. 1989; 13(1): 70-74.
35. Zhang L, Xiao H, Wong DT. Salivary biomarkers for
clini-cal applications. Mol Diagn Ther. 2009; 13(4): 245-259. 36. Okuno S, Ishimura E, Kohno K, Fujino-Katoh Y, Maeno
Y, Yamakawa T, et al. Serum β2-microglobulin level is a signiicant predictor of mortality in maintenance haemo
-dialysis patients. N Nephrol Dial Transplant. 2009; 24(2): 571-577.
37. Wong DT. Salivary diagnostics powered by nanotechnolo-gies, proteomics and genomics. J Am Dent Assoc. 2006;
137(3): 313-321.
38. Lloyd JE, Broughton A, Selby C. Salivary creatinine as-says as a potential screen for renal disease. Ann Clin
Bio-chem. 1996; 33 ( Pt 5): 428-431.
39. Goll RD, Mookerjee BK. Correlation of biochemical pa-rameters in serum and saliva in chronic azotemic patients
and patients on chronic hemodialysis. J Dial. 1978; 2(4): 399-344.
40. Tomás I, Marinho JS, Limeres J, Santos MJ, Araújo L, Diz P. Changes in salivary composition in patients with renal