HbA1c Levels Are Associated with Chronic
Kidney Disease in a Non-Diabetic Adult
Population: A Nationwide Survey (KNHANES
2011
–
2013)
Seok Hui Kang1, Da Jung Jung2, Eun Woo Choi1, Kyu Hyang Cho1, Jong Won Park1, Jun Young Do1*
1Division of Nephrology, Department of Internal Medicine, Yeungnam University Hospital, Daegu, Republic of Korea,2Department of Otorhinolaryngology-Head and Neck Surgery, School of Medicine, Kyungpook National University Hospital, Daegu, Republic of Korea
*jydo@med.yu.ac.kr
Abstract
Background
Many studies have reported an association between glycated hemoglobin A1c (HbA1c) and metabolic syndrome (MetS) in non-diabetes patients. Each component of MetS is in fact related to chronic kidney disease (CKD) incidence and progression. Therefore, HbA1c in non-diabetic mellitus (DM) may be intrinsically associated with the prevalence of CKD. The hypothesis of the present study was that high HbA1c in non-DM patients is associated with CKD.
Patients and Methods
The total number of participants in this study was 24,594. The participants were divided into three groups according to their HbA1c levels: a Low group (<5.7% or<39 mmol/mol), a
Mid-dle group (5.7–6.0% or 39–42 mmol/mol), and a High group (>6.0% or>42 mmol/mol). The
estimated glomerular filtration rate (eGFR) was calculated using the Chronic Kidney Dis-ease Epidemiology Collaboration equation.
Results
The number of participants allocated to the Low, Middle, and High groups was 8,651, 4,634, and 1,387, respectively. Linear regression analyses were performed to evaluate the associ-ation between variables. Standardizedβ±standard error was 0.25±0.22 for waist circum-ference, 0.44±0.20 for fasting glucose,–0.14±0.30 for high-density lipoprotein cholesterol levels, 0.15±2.31 for triglyceride levels, 0.21±0.00 for systolic blood pressure, 0.10±0.00 for diastolic blood pressure, and–0.22±0.42 for eGFR (P<0.001 for all variables). eGFR in non-diabetes participants was inversely associated with the HbA1c level, where eGFR decreased as HbA1c levels increased. Standardizedβs were–0.04±0.42 in multivariable
OPEN ACCESS
Citation:Kang SH, Jung DJ, Choi EW, Cho KH, Park JW, Do JY (2015) HbA1c Levels Are Associated with Chronic Kidney Disease in a Non-Diabetic Adult Population: A Nationwide Survey (KNHANES 2011– 2013). PLoS ONE 10(12): e0145827. doi:10.1371/ journal.pone.0145827
Editor:Sheng-Nan Lu, Kaohsiung Chang Gung Memorial Hospital, TAIWAN
Received:August 25, 2015
Accepted:December 9, 2015
Published:December 30, 2015
Copyright:© 2015 Kang et al. This is an open access article distributed under the terms of the
Creative Commons Attribution License, which permits unrestricted use, distribution, and reproduction in any medium, provided the original author and source are credited.
Data Availability Statement:All relevant data are within the paper and its Supporting Information files.
Funding:This work was supported by the 2014 Yeungnam University Research Grant. The funders had no role in study design, data collection and analysis, decision to publish, or preparation of the manuscript.
analysis (P<0.001). The proportion of participants with only MetS, only CKD, or both MetS and CKD was higher in the High group than in the Low and Middle groups.
Conclusion
High HbA1c in non-DM patients may be associated with CKD. Renal function in patients with high HbA1c levels may need to be monitored.
Background
Chronic kidney disease (CKD) is a widely recognized public health issue and associated with high morbidity and mortality when compared to the non-CKD population [1,2]. The United States Real Data System 2014 Annual Data Report showed that CKD occurs in approximately 13.6% of the general population [3]. Indeed, the prevalence of CKD appears to be rising rapidly with increased life expectancy. Overall Medicare expenditures for CKD were $44,581 million in 2012 [3]. Screening for and effective monitoring of CKD are essential for increasing patient quality of life and decreasing the public health burden.
Glycated hemoglobin (HbA1c) is an important indicator for long-term glucose control and has recently been recommended for use in the diagnosis of diabetes mellitus (DM) by the American Diabetes Association (ADA) [4]. However, the use of HbA1c for identifying pre-dia-betes is a controversial topic [5]. In 2015, the ADA suggested that an HbA1c of 5.7–6.4% (39–
46 mmol/mol) is reasonable for the diagnosis of pre-diabetes and that patients with HbA1c>6.0% (>42 mmol/mol) should be considered to be at very high risk for DM [4]. Although the clinical significance of HbA1c as a surrogate marker of metabolic syndrome (MetS) has not yet been fully examined, many studies have reported an association between HbA1c and MetS in non-DM patients [6–8]. Each component of MetS is in fact related to CKD incidence and progression [9]. Therefore, HbA1c in non-DM may be intrinsically associ-ated with the prevalence of CKD. The aim of the present study was to evaluate the clinical asso-ciation between HbA1c and CKD in non-DM patients. The hypothesis of the present study was that high HbA1c in non-DM patients is associated with CKD.
Patients and Methods
Study population
Data from the Korean National Health and Nutrition Examination Survey (KNHANES 2011–
2013) were used for this analysis. The KNHANES is a nationwide, multi-stage, stratified survey of a representative sample of the South Korean population and is conducted by the Korea Cen-ters for Disease Control and Prevention. The total number of participants from KNHANES analyzed in this study was 24,594. Participants were excluded from the present study based on the following criteria: data could not be provided for HbA1c (n = 2,350) or renal function (n = 2) or participants were younger than 18 years of age (n = 5,385) or had DM (defined as a self-reported history of a DM diagnosis, a fasting glucose level of126 mg/dL, or
Study variables
Clinical and laboratory data collected during clinical examination included the following: age, sex, serum creatinine (mg/dL), body mass index (BMI, kg/m2), waist circumference (WC, cm), HbA1c (%, mmol/mol), fasting blood glucose (mg/dL), total cholesterol (mg/dL), high-density lipoprotein (HDL) cholesterol levels (mg/dL), triglyceride levels (mg/dL), systolic blood pres-sure (mmHg), diastolic blood prespres-sure (mmHg), smoking status, alcohol intake, and levels of physical activity.
HbA1c levels were measured using a high performance liquid chromatography system (HLC-723G7; Tosoh Co., Tokyo, Japan). In the present study, the participants were divided into three groups according to their HbA1c levels: a Low group (<5.7% or<39 mmol/mol), a Middle group (5.7–6.0% or 39–42 mmol/mol), and a High group (>6.0% or>42 mmol/mol). Serum creatinine levels were measured using a Hitachi Automatic Analyzer (alkaline picrate, Jaffé kinetic). The estimated glomerular filtration rate (eGFR) was calculated using the Chronic Kidney Disease Epidemiology Collaboration (CKD-EPI) equation [10]. CKD was defined as an eGFR<60 mL/min/1.73 m2. Urine albumin level was measured from random samples using a turbidimetric immunoassay (Hitachi Automatic Analyzer 7600, Hitachi). Urine creatinine level was measured using a colorimetric method (Hitachi Automatic Analyzer 7600, Hitachi). Urine albumin and creatinine concentrations were measured in the same laboratory for all sur-veys. The inter-assay coefficient of variation for all laboratory work was consistenly low (<3.1%). The urine albumin-creatinine ratio (UACR) was calculated in mg per g of creatinine (mg/g). Albuminuria was defined as UACR30 mg/g.
Patients were classified according to smoking status as current smokers, ex-smokers, or non-smokers. Alcohol intake was defined using the Korean version of‘standard drinking’
based on the WHO classification [11,12]. Alcohol intake was classified into 3 categories: abstinence (no consumption of alcohol within the last year); moderate drinking (women: 0.1–
19.99 g pure alcohol/day; men: 0.1–39.99 g pure alcohol/day), and heavy drinking (women:
20 g pure alcohol/day; men:40 g pure alcohol/day). Physical activity was assessed by the presence of exercise. The presence of exercise was defined as moderate activity for more than 30 min/day, for 5 days/week or intense activity for more than 20 min/day, for 3 days/week, or walking more than 30 min/day, for 5 days/week. Coronary artery disease (CAD) was defined as a self-reported history of angina or myocardial infarction. Cerebrovascular accident (CVA) was defined as a self-reported history of stroke.
MetS was defined according to the Adult Treatment Panel III criteria using the modified cutoff values for Asian populations as suggested by the Asia-Pacific guidelines [13,14]. Briefly, elevated blood glucose was defined as a fasting blood glucose level100 mg/dL or a self-reported history of DM. Elevated blood pressure was defined as a systolic or diastolic blood pressure130/85 mmHg and a self-reported history of hypertension. A low HDL cholesterol level was defined as<40 mg/dL in men and<50 mg/dL in women. Elevated triglyceride levels were defined as a serum triglyceride level of150 mg/dL. Abdominal obesity was defined as a WC>90 cm in men and>80 cm in women. MetS was defined as the presence of3 compo-nents of MetS.
Statistical analyses
variables. For continuous variables, means were compared using a one-way analysis of vari-ance. Correlations were analyzed in order to assess the strength of the relationship between continuous variables. Linear regression analysis was performed to assess independent predic-tors of eGFR or number of MetS components. Variance inflation factor was used to identify multicollinearity for the multivariable linear regression model. Variance inflation factor greater than 10 was not accepted. Logistic regression analyses were used for estimating the odds ratios (OR) and 95% confidence intervals (CI), which were then applied towards determining the relationship between HbA1c and CKD or MetS.
Confounders were defined by their likelihood of preceding or contributing to the develop-ment of MetS or CKD. The selection of confounder was based on previous literatures [15,16]. For MetS, the covariates were HbA1c, age, sex, BMI, alcohol intake, smoking status, and physi-cal activity. For CKD, the covariates were HbA1c, age, sex, BMI, alcohol intake, smoking status, physical activity, CAD, CVA, WC, HDL cholesterol levels, triglyceride levels, systolic blood pressure, and diastolic blood pressure. Discrimination–which is the ability of the model to dif-ferentiate between participants who have CKD or MetS and those who do not–was examined using the area under the receiver operating characteristic (AUROC) curve. AUROC analysis was also performed in order to calculate cutoff values, sensitivity, and specificity. Optimal cut-off risk point was defined as the maximum Youden index in the AUROC. The AUROC was calculated using the MedCalc software package (v.11.6.1.0, MedCalc, Mariakerke, Belgium). We also calculated the integrated discrimination improvement (IDI) and the net reclassifica-tion improvement (NRI) with a category-free opreclassifica-tion among models, following the methodol-ogy of Penica et al. [17,18]. A restricted cubic spline curve was used to evaluate non-linear relationships between the HbA1c level and CKD, which was adjusted for age and sex. The restricted cubic spline curve was plotted using statistical software SAS version 9.4 (SAS Cam-pus Drive, Cary, NC, USA). AP-value less than 0.05 was considered statistically significant.
Results
Clinical characteristics of participants
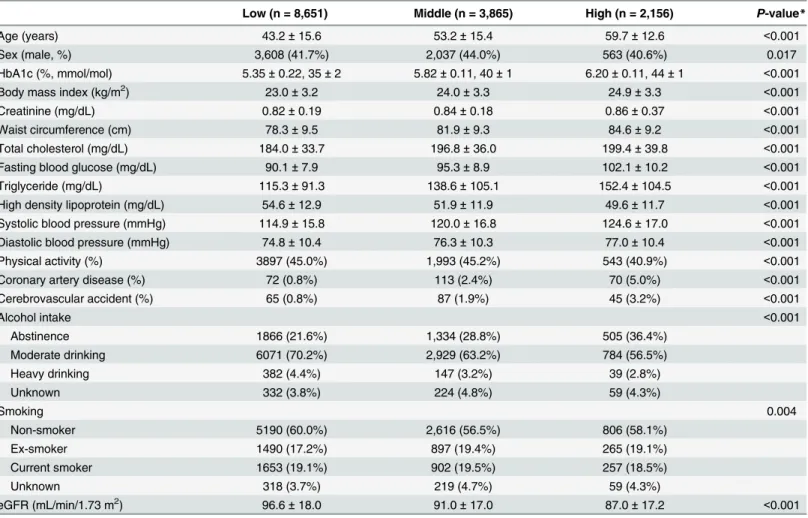
The number of participants allocated to the Low, Middle, and High groups was 8,651, 4,634, and 1,387, respectively (Table 1). Age, BMI, WC, eGFR, total cholesterol, fasting blood glucose, triglyceride levels, and systolic and diastolic blood pressure were higher in the High group than either the Low or Middle group.
The proportion of participants with only MetS in the Low, Middle, and High groups was 9.1%, 20.4%, and 33.9%, respectively (P<0.001), whereas the proportion of participants with only CKD in the Low, Middle, and High groups was 0.9%, 2.0%, and 3.5%, respectively (P<0.001). The proportion of participants with both MetS and CKD in the Low, Middle, and High groups was 0.2%, 0.7%, and 2.0%, respectively (P<0.001). The proportion of participants with only MetS, only CKD, or both MetS and CKD was higher in the High group than in the Low and Middle groups.
Association between HbA1c level and MetS or CKD
We performed univariate linear regression analyses to evaluate the association between HbA1c and each MetS components. Standardizedβ± standard error was 0.25 ± 0.22 for WC,
non-diabetes participants was associated with the number of MetS components observed (S1 Table). Numbers of MetS components increased in accordance with increased HbA1c levels. Univariate and multivariable linear regression analyses were also performed to evaluate the association between HbA1c level and eGFR (S1 Table). eGFR in non-diabetes participants was inversely associated with the HbA1c level, where eGFR decreased as HbA1c levels increased.
Logistic regression showed that the OR for only MetS with a 1% (11 mmol/mol) increase in HbA1c was 7.53 (95% CI, 6.51–8.70) in univariate analysis and 3.38 (95% CI, 2.85–4.00) in multivariable analysis (S2 Table). The OR for only CKD with a 1% (11 mmol/mol) increase in HbA1c was 9.32 (95% CI, 6.16–14.11) in univariate analysis and 2.13 (95% CI, 1.33–3.40) in multivariable analysis. The OR for both MetS and CKD with a 1% (11 mmol/mol) increase in the level of HbA1c was 21.49 (95% CI, 10.86–42.52) on univariate analysis and 4.12 (95% CI, 1.80–9.39) on multivariable analysis. A restricted cubic spline curve was plotted, with 5.6% (38 mmol/mol) as the median HbA1c level, and it was adjusted for age and sex (S1 Fig). A high HbA1c level was associated with increased OR for CKD.
To estimate the incremental value of HbA1c level to predict only MetS, only CKD or both MetS and CKD, we compared the probabilities of events and nonevents of models using rela-tive IDI and category-free NRI (S3 Table). The IDI of adding HbA1c level to the multivariable Table 1. Clinical characteristics of participants by HbA1c level.
Low (n = 8,651) Middle (n = 3,865) High (n = 2,156) P-value*
Age (years) 43.2±15.6 53.2±15.4 59.7±12.6 <0.001
Sex (male, %) 3,608 (41.7%) 2,037 (44.0%) 563 (40.6%) 0.017
HbA1c (%, mmol/mol) 5.35±0.22, 35±2 5.82±0.11, 40±1 6.20±0.11, 44±1 <0.001
Body mass index (kg/m2) 23.0±3.2 24.0±3.3 24.9±3.3 <0.001
Creatinine (mg/dL) 0.82±0.19 0.84±0.18 0.86±0.37 <0.001
Waist circumference (cm) 78.3±9.5 81.9±9.3 84.6±9.2 <0.001
Total cholesterol (mg/dL) 184.0±33.7 196.8±36.0 199.4±39.8 <0.001
Fasting blood glucose (mg/dL) 90.1±7.9 95.3±8.9 102.1±10.2 <0.001
Triglyceride (mg/dL) 115.3±91.3 138.6±105.1 152.4±104.5 <0.001
High density lipoprotein (mg/dL) 54.6±12.9 51.9±11.9 49.6±11.7 <0.001
Systolic blood pressure (mmHg) 114.9±15.8 120.0±16.8 124.6±17.0 <0.001
Diastolic blood pressure (mmHg) 74.8±10.4 76.3±10.3 77.0±10.4 <0.001
Physical activity (%) 3897 (45.0%) 1,993 (45.2%) 543 (40.9%) <0.001
Coronary artery disease (%) 72 (0.8%) 113 (2.4%) 70 (5.0%) <0.001
Cerebrovascular accident (%) 65 (0.8%) 87 (1.9%) 45 (3.2%) <0.001
Alcohol intake <0.001
Abstinence 1866 (21.6%) 1,334 (28.8%) 505 (36.4%)
Moderate drinking 6071 (70.2%) 2,929 (63.2%) 784 (56.5%)
Heavy drinking 382 (4.4%) 147 (3.2%) 39 (2.8%)
Unknown 332 (3.8%) 224 (4.8%) 59 (4.3%)
Smoking 0.004
Non-smoker 5190 (60.0%) 2,616 (56.5%) 806 (58.1%)
Ex-smoker 1490 (17.2%) 897 (19.4%) 265 (19.1%)
Current smoker 1653 (19.1%) 902 (19.5%) 257 (18.5%)
Unknown 318 (3.7%) 219 (4.7%) 59 (4.3%)
eGFR (mL/min/1.73 m2) 96.6±18.0 91.0±17.0 87.0±17.2 <0.001
Data are expressed as numbers (percentages) for categorical variables and mean±standard deviations for continuous variables.
*Pvalues were tested by one-way analysis of variance for continuous variables and Pearsonχ2test or Fisher exact test for the categorical variables.
model improved significantly. The addition of HbA1c to multivariable models resulted in a sig-nificant improvement of the category-free NRI.
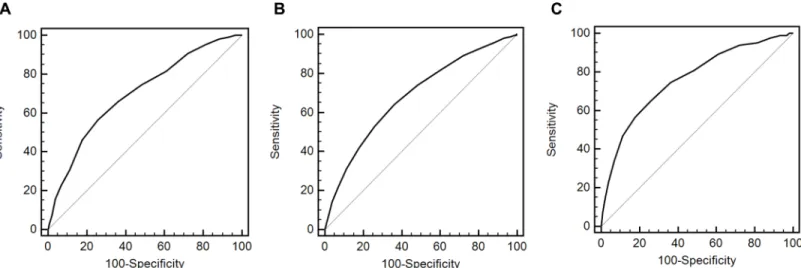
The AUROC value of HbA1c was 0.700 (95% CI, 0.692–0.708) for only MetS, 0.685 (95% CI, 0.678–0.693) for only CKD, and 0.760 (95% CI, 0.752–0.768) for both MetS and CKD (P<0.001). The cutoff value was>5.7%(>39 mmol/mol) for only MetS,>5.6% (>38 mmol/ mol) for only CKD, and>5.7% (>39 mmol/mol) for both MetS and CKD (Fig 1). Sensitivity and specificity for predicting only MetS were 56.7% and 74.2%, respectively. Those for predict-ing only CKD were 64.2% and 63.8%, respectively, while those for predictpredict-ing both MetS and CKD were 65.1% and 74.2%, respectively.
Association between HbA1c level and UACR
In participants with eGFR60 mL/min/1.73 m2, the correlation coefficient between UACR and HbA1c was 0.043 (P<0.001). UACR in the Low, Middle, and High groups was 9.2 (95% CI, 8.1–10.2), 11.5 (95% CI, 9.9–13.1), and 15.9 (95% CI, 12.6–19.1), respectively (P<0.001). The portion of participants with albuminuria in the Low, Middle, and High groups was 329 (4.3%), 239 (5.6%), and 104 (8.2%), respectively (P<0.001).
Discussion
In the present study, a clear association was observed between HbA1c and MetS in non-DM Asian patients, which is in line with numerous other studies that have shown an association between these two variables [6–9,19–23]. Studies aiming to investigate this association should exclude patients with DM as this condition is a critical confounding factor for the prevalence of MetS and certain studies have reported no exclusion of patients with HbA1c6.5% (48 mmol/mol) [21,23]. While a few previous studies did exclude DM patients with HbA1c6.5% (48 mmol/mol), the majority of these were single-center studies with a possibility of selection bias [8,21,23]. The present study analyzed a nationwide, multi-stage, stratified survey of a rep-resentative sample of the South Korean population and excluded patients with HbA1c6.5% (48 mmol/mol). Results were adjusted for variable confounders and revealed that HbA1c in non-DM patients is associated with the number of MetS components. The linear regression Fig 1. Receiver operating characteristic curves of HbA1c for the prediction of metabolic syndrome or chronic kidney disease.A. Only metabolic syndrome. B. Only chronic kidney disease. C. Both metabolic syndrome and chronic kidney disease.
analyses did show an association between HbA1c and each component of MetS as continuous variables.
The present study showed an association between the HbA1c level and CKD with or with-out MetS. The associations between insulin resistance and CKD are very complex and not clear. Previous studies have shown that each component of MetS is associated with develop-ment and progression of CKD. Among the components of MetS, insulin resistance may be the most important related etiological factor for CKD [24]. HbA1c is an indicator predicting insu-lin resistance. High HbA1c level in pre-diabetes is associated with insuinsu-lin resistance or meta-bolic syndrome, which can lead to development and progression of CKD. Our results suggest that high HbA1c is mainly associated with insulin resistance, which may result in development of CKD. However, CKD results in interference with the intracellular signaling pathway initi-ated by insulin, which results in insulin resistance [25].
The literature has shown conflict results concerning an association between HbA1c and CKD. Certain studies have shown that HbA1c is associated with development of CKD in non-DM patients [26–29]. Gerstein et al. conducted a prospective study with an average 4.5-year follow-up and successfully showed that HbA1c is associated with development of overt nephropathy defined by albuminuria or proteinuria [26]. Zhang et al. evaluated a cross-sec-tional study using a German cohort and showed an association between HbA1c and eGFR or CKD defined as eGFR<60 mL/min/1.73 m2[27]. Although DM was adjusted for in multivari-able analysis, this study did include DM patients. A study by Plantinga et al. enrolled non-DM patients using data from the USA; however, this group evaluated the association between CKD and pre-diabetic status classified by fasting glucose level [28]. In contrast to the afore-men-tioned studies, there have been reports that no association exists between the two variables if variable cardiovascular risk factors are adjusted for [30–33]. Selvin et al. observed no significant difference in the development of CKD in patients with HbA1c 5.7–6.5% (39–48 mmol/mol) when compared to patients with HbA1c<5.7% (<39 mmol/mol) [31]. However, that study did not include HbA1c as a diagnostic criterion for DM and could possibly include DM patients. To the best of our knowledge, this is the first study to evaluate the association between HbA1c and CKD in an Asian population. The results of the present study do show an associa-tion between HbA1c and eGFR as a continuous variable for renal funcassocia-tion or CKD as a cate-gorical variable. In addition, we calculated IDI and NRI as more advanced prediction analyses; these analyses showed that in comparison with multivariable models using only traditional risk factors, the addition of HbA1c to multivariable models improved both IDI and NRI. Unfortu-nately, cross-sectional study such as this cannot evaluate the causal relationship among these variables. Further prospective studies are needed to identify the causality between two variables.
The present study showed the association between HbA1c and albuminuria as a surrogate marker for early CKD. In participants with eGFR60 mL/min/1.73 m2, UACR and the pro-portion of participants with albuminuria increased as HbA1c increased. Previous studies dem-onstrated that HbA1c level is associated with albuminuria in participants with DM [34–39]. Poor glycemic control in DM plays a key role in rapid progression to diabetic nephropathy, which is caused by variable hemodynamic, metabolic, or endothelial dysfunction [40]. Many previous studies have demonstrated pathophysiology or factors associated with progression to albuminuria in DM, but there have been few studies regarding the association between HbA1c and albuminuria in non-DM participants. The present study reveals that high-normal HbA1c levels previously considered to be in the normal range may be associated with albuminuria and may function as a marker for early CKD in non-DM participants.
subclinical or clinical atherosclerosis in various vessels. Glycemic control is a well-known risk factor for the development of atherosclerosis in DM participants. Previous studies also showed a positive association between prediabetes and atherosclerosis as measured by carotid intimal thickness, subclinical myocardial damage, or coronary artery calcium [41–43]. These patho-logic changes can develop in the renal vasculature, which results in CKD with albuminuria.
Very low HbA1c level may be associated with malnutrition, inflammation, and atheroscle-rosis. However, in our study, a spline curve showed that low HbA1c level is not associated with CKD compared to median HbA1c level. Two factors may be associated with this discordance. First, malnutrition combined with low HbA1c level is common in participants with severe comorbidities, such as advanced cancer or end-stage renal disease, compared with the general population. Participants enrolled in our study may have been healthier than other selected pop-ulations who visited hospitals, which could have resulted in selection bias. Second, HbA1c may be used as a nutritional marker, but it mainly reflects glucose intake. The numbers of partici-pants with total cholesterol<100 mg/dL as another marker of malnutrition were 6, 7, and 0 in the Low, Middle, and High groups, respectively. There were few participants with malnutrition defined by total cholesterol level in our study.
This study has a number of limitations. First, it is a retrospective cross-sectional design and therefore cannot establish causality between two variables. Second, the available data did not include post-prandial blood glucose levels as a criterion for DM and a small number of DM patients could therefore have included. However, all participants have HbA1c<6.5% (<48 mmol/mol) and a fasting blood glucose<126 mg/dL. Third, KDIGO guidelines define CKD as eGFR<60 mL/min/1.73 m2for>3 months [44]. In our study, CKD was defined using a single serum creatinine or single spot urine sample. However, the effect of these limitations will be reduced by the strength of a nation-wide representative sample.
In conclusion, high HbA1c in non-DM patients may be associated with CKD. Renal func-tion in patients with high HbA1c levels may need to be monitored.
Supporting Information
S1 Fig. Adjusted restricted cubic spline curve showing odds ratio and 95% confidence inter-val (dashed line) for chronic kidney disease associated with HbA1c level (median
value = 5.6% or 38 mmol/mol).Spline curve was adjusted for age and sex. (TIF)
S1 Table. Linear regression analyses for the number of metabolic syndrome components or estimated glomerular filtration rate according to HbA1c level.
(DOCX)
S2 Table. Logistic regression analyses for metabolic syndrome or chronic kidney disease according to HbA1c level.
(DOCX)
S3 Table. AUCs, IDI, and NRI for multivariable models with or without HbA1c level.
(DOCX)
Author Contributions
References
1. Go AS, Chertow GM, Fan D, McCulloch CE, Hsu CY. Chronic kidney disease and the risks of death, cardiovascular events, and hospitalization. N Engl J Med 2004; 351: 1296–1305. PMID:15385656
2. Jin DC, Han JS. Renal replacement therapy in Korea, 2012. Kidney Res Clin Pract 2014; 33:9–18.
3. US Renal Data System, USRDS 2014 Annual Data Report: Atlas of Chronic Kidney Disease in the United States, National Institutes of Health, National Institute of Diabetes and Digestive and Kidney Dis-eases, Bethesda, MD, 2014.
4. American Diabetes Association. Standards of medical care in diabetes-2015. Diabetes Care 2015; 38 Suppl 1: S1–S10.
5. Grundy SM. Pre-diabetes, metabolic syndrome, and cardiovascular risk. J Am Coll Cardiol 2012; 59: 635–643. doi:10.1016/j.jacc.2011.08.080PMID:22322078
6. Osei J, Rhinesmith S, Gaillard T, Schuster D. Is glycosylated hemoglobin A1c a surrogate for metabolic syndrome in nondiabetic, first-degree relatives of African-American patient with type 2 diabetes? J Clin Endocrinol Metab 2003; 88: 4596–4601. PMID:14557428
7. Ong KL, Tso AW, Lam KS, Cherny SS, Sham PC, Cheung BM. Using glycosylated hemoglobin to define the metabolic syndrome in the United States adults. Diabetes Care 2010; 33: 1856–1858. doi: 10.2337/dc10-0190PMID:20504895
8. Park SH, Yoon JS, Won KC, Lee HW. Usefulness of glycated hemoglobin as diagnostic criteria for met-abolic syndrome. J Korean Med Sci 2012; 27: 1057–1061. doi:10.3346/jkms.2012.27.9.1057PMID: 22969252
9. Chen J, Muntner P, Hamm LL, Jones DW, Batuman V, Fonseca V, et al. The metabolic syndrome and chronic kidney disease in U.S. adults. Ann Intern Med 2004; 140: 167–174. PMID:14757614
10. Levey AS, Stevens LA, Schmid CH, Zhang YL, Castro AF 3rd, Feldman HI, et al. A new equation to esti-mate glomerular filtration rate. Ann Intern Med 2009; 150: 604–12. PMID:19414839
11. Rehm J, Room R, Monteiro M, Gmel G, Graham K, Rehn N, et al. Alcohol use. In: Ezzati M, Lopez A, Rodgers A, Murray CJL eds. Comparative Quantification of Health Risks: global and regional burden of disease attributable to selected major risk factors. Geneva, World Health Organization, 2004:959– 1108.
12. The Korea Centers for Disease Control and Prevention: Alcohol drinking. [internet]. Available:http:// health.mw.go.kr/HealthInfoArea/HealthInfo/View.do?idx=5800&subIdx=3&searchCate=
&searchType=&searchKey=&pageNo=&category=&category_code=&dept=&sortType= viewcount&page=1&searchField=&searchWord=.
13. Grundy SM, Cleeman JI, Daniels SR, Donato KA, Eckel RH, Franklin BA, et al. Diagnostic and manage-ment of the metabolic syndrome: an American Heart Association/National Heart, Lung, and Blood Insti-tute Scientific Statement. Circulation. 2005; 112: 2735–2752. PMID:16157765
14. Alberti KG, Zimmet P, Shaw J. 2005. The metabolic syndrome-a new worldwide definition. Lancet. 366, 1059–1062. PMID:16182882
15. Kim Y, Je Y. Dairy consumption and risk of metabolic syndrome: a meta-analysis. Diabet Med 2015 Oct 3. doi:10.1111/dme.12970
16. Johnson DW, Atai E, Chan M, Phoon RK, Scott C, Toussaint ND, et al. KHA-CARI guideline: Early chronic kidney disease: detection, prevention and management. Nephrology 2013; 18:340–50. doi:10. 1111/nep.12052PMID:23506545
17. Pencina MJ, D’Agostino RB Sr, D’Agostino RB Jr, Vasan RS. Evaluating the added predictive ability of a new marker: from area under the ROC curve to reclassification and beyond. Stat Med 2008; 27:157– 72. PMID:17569110
18. Pencina MJ, D’Agostino RB Sr, Steyerberg EW. Extensions of net reclassification improvement calcu-lations to measure usefulness of new biomarkers. Stat Med 2011; 30:11–21. doi:10.1002/sim.4085 PMID:21204120
19. Veeranna V, Ramesh K, Zalawadiya SK, Pradhan J, Jacob S, Afonso L. Glycosylated hemoglobin and prevalent metabolic syndrome in nondiabetic multiethnic U.S. adults. Metab Syndr Relat Disord 2011; 9: 361–367. doi:10.1089/met.2011.0032PMID:21612506
20. Nguyen QM, Srinivasan SR, Xu JH, Chen W, Berenson GS. Distribution and cardiovascular risk corre-lates of hemoglobin A(1c) in nondiabetic younger adults: the Bogalusa Heart Study. Metabolism 2008; 57: 1487–1492. doi:10.1016/j.metabol.2008.04.011PMID:18940383
22. Dilley J, Ganesan A, Deepa M, Sharada G, Williams OD, Mohan V. Association of A1C with cardiovas-cular disease and metabolic syndrome in Asian Indians with normal glucose tolerance. Diabetes Care 2007; 30: 1527–1532 PMID:17351274
23. Kim JH, Choi SR, Lee JR, Shin JH, Lee SJ, Han MA, et al. Association of hemoglobin A1c with cardio-vascular disease risk factors and metabolic syndrome in nondiabetic adults. Korean Diabetes J 2008; 32: 435–444.
24. Prasad GV. Metabolic syndrome and chronic kidney disease: Current status and future directions. World J Nephrol 2014; 3:210–9. doi:10.5527/wjn.v3.i4.210PMID:25374814
25. Thomas SS, Zhang L, Mitch WE. Molecular mechanisms of insulin resistance in chronic kidney dis-ease. Kidney Int. 2015 Oct 7. doi:10.1038/ki.2015.305
26. Gerstein HC, Progue J, Mann JF, Lonn E, Dagenais GR, McQueen M, et al. The relationship between dysglycaemia and cardiovascular and renal risk in diabetic and non-diabetic participants in the HOPE study: a prospective epidemiological analysis. Diabetologia 2005; 48: 1749–1755. PMID:16059716
27. Zhang QL, Koenig W, Raum E, Stegmaier C, Brenner H, Rothenbacher D. Epidemiology of chronic kid-ney disease: results from a population of older adults in Germany. Prev Med 2009; 48: 122–127. doi: 10.1016/j.ypmed.2008.10.026PMID:19041887
28. Plantinga LC, Crews DC, Coresh J, Miller ER 3rd, Saran R, Yee J, et al. Prevalence of chronic kidney disease in US adults with undiagnosed diabetes or prediabetes. Clin J Am Soc Nephrol 2010; 5: 673– 682. doi:10.2215/CJN.07891109PMID:20338960
29. Hernandez D, Espejo-Gil A, Bernal-Lopez MR, Mancera-Romero J, Baca-Osorio AJ, Tinahones FJ, et al. Association of HbA1c and cardiovascular and renal disease in an adult Mediterranean population. BMC Nephrol 2013; 17: 151.
30. Fox CS, Larson MG, Leip EP, Meigs JB, Wilson PW, Levy D. Glycemic status and development of kid-ney disease: the Framingham Heart Study. Diabetes Care 2005; 28: 2436–2440. PMID:16186276
31. Selvin E, Ning Y, Steffes MW, Bash LD, Klen R, Wong TY, et al. Glycated hemoglobin and the risk of kidney disease and retinopathy in adults with and without diabetes. Diabetes 2011; 60: 298–305. doi: 10.2337/db10-1198PMID:20978092
32. Schöttker B, Brenner H, Koenig W, Müller H, Rothenbacher D. Prognostic association of HbA1c and fasting plasma glucose with reduced kidney function in subjects with and without diabetes mellitus. Results from a population-based cohort study from Germany. Prev Med 2013; 57: 596–600. doi:10. 1016/j.ypmed.2013.08.002PMID:23948106
33. Xing FY, Neeland IJ, Gore MO, Ayers CR, Paixao AR, Turer AT, et al. Association of prediabetes by fasting glucose and/or haemoglobin A1c levels with subclinical atherosclerosis and impaired renal func-tion: observations from the Dallas Heart Study. Diab Vasc Dis Res 2014; 11: 11–18. doi:10.1177/ 1479164113514239PMID:24344119
34. Nelson RG, Kunzelman CL, Pettitt DJ, Saad MF, Bennett PH, Knowler WC. Albuminuria in type 2 (non-insulin-dependent) diabetes mellitus and impaired glucose tolerance in Pima Indians. Diabetologia 1989; 32:870–6. PMID:2612758
35. Wiseman M, Viberti G, Mackintosh D, Jarrett RJ, Keen H. Glycaemia, arterial pressure and micro-albu-minuria in type 1 (insulin-dependent) diabetes mellitus. Diabetologia 1984; 26:401–5. PMID:6468790
36. The Diabetes Control and Complications Trial Research Group. The effect of intensive treatment of dia-betes on the development and progression of long-term complications in insulin-dependent diadia-betes mellitus. N Engl J Med 1993; 329:977–86. PMID:8366922
37. Holman RR, Paul SK, Bethel MA, Matthews DR, Neil HA. 10-year follow-up of intensive glucose control in type 2 diabetes. N Engl J Med 2008; 359:1577–89. doi:10.1056/NEJMoa0806470PMID:18784090
38. Duckworth W, Abraira C, Moritz T, Reda D, Emanuele N, Reaven PD, et al. Glucose control and vascu-lar complications in veterans with type 2 diabetes. N Engl J Med. 2009; 360:129–39. doi:10.1056/ NEJMoa0808431PMID:19092145
39. Perkovic V, Heerspink HL, Chalmers J, Woodward M, Jun M, Li Q, et al. Intensive glucose control improves kidney outcomes in patients with type 2 diabetes. Kidney Int. 2013; 83:517–23. doi:10.1038/ ki.2012.401PMID:23302714
40. Lim AKh. Diabetic nephropathy-complications and treatment. Int J Nephrol Renovasc Dis 2014; 15:361–81.
41. McNeely MJ, McClelland RL, Bild DE, Jacobs DR Jr, Tracy RP, Cushman M, et al. The association between A1C and subclinical cardiovascular disease: the multi-ethnic study of atherosclerosis. Diabe-tes Care 2009; 32:1727–33. doi:10.2337/dc09-0074PMID:19549732
population-based cohort–results of the Heinz Nixdorf Recall Study. Diabetologia 2009; 52:81–9. doi: 10.1007/s00125-008-1173-yPMID:18979083
43. Selvin E, Lazo M, Chen Y, Shen L, Rubin J, McEvoy JW, et al. Diabetes mellitus, prediabetes, and inci-dence of subclinical myocardial damage. Circulation 2014; 130:1374–82. doi:10.1161/
CIRCULATIONAHA.114.010815PMID:25149362