Abstract—Because of the increasing product miniaturization, mechanical manufacturing of micro-components gets more important. The combination of high manufacturing rates and low manufacturing tolerances allows the economical production of micro components by using of a comprehensive quality management. Due to the small component sizes and the difficulties associated with the handling process, the classic visual inspection retires as testing procedure. Besides a customized surface inspection technology, an efficient image processing system is needed to identify surface imperfections such as cracks, dents and scratches. This paper presents a prototypical implementation of an automated image processing system by reference to a micro deep-drawn component from the Collaborative Research Center (CRC) 747.
Index Terms—micro production, machine vision, quality control, height maps.
I. INTRODUCTION
Micro technology is one of the most important cross-sectional technologies and the trend of miniaturization will outlast the next decades [1]. Therefore, the automation of micro manufacturing processes is getting more and more important. The big challenge in the development of high performance micro manufacturing processes is the balance between accuracy and efficiency. Because of this conflict, the process configuration is extremely complex and time consuming. Building and equipping manufacturing stations takes many times more than the actual production period of few weeks [2]. Due to the high number of workpieces, the quality assurance is only possible by industrial machine vision techniques. Within the goal of an improved quality control fault workpieces should be identified. Additionally, the quality data should be used as a feedback and control parameter for process configuration.
The aim of this paper is to present a prototypical implementation of an automated image processing system by reference to a micro cup, which is manufactured by a Manuscript received December 30, 2009. This work was supported by the German Research Foundation (DFG) within the Collaborative Research Center 747-B5.
Prof. Dr.-Ing. Bernd Scholz-Reiter is Managing Director of BIBA – Bremer Institut für Produktion und Logistik GmbH and professor at the University of Bremen, Germany (e-mail: bsr@ biba.uni-bremen.de).
Dipl.-Inf. Hendrik Thamer works as a research scientist at the BIBA – Bremer Institut für Produktion und Logistik GmbH at the University of Bremen, Germany (phone: +49(0)421/218-5527; fax: +49(0)421/218-5640, e-mail: [email protected]).
M. Sc. Michael Lütjen works as a research scientist at the BIBA – Bremer Institut für Produktion und Logistik GmbH at the University of Bremen, Germany (e-mail: ltj@ biba.uni-bremen.de).
deep-drawing process within the Collaborative Research Centre 747. Based on three dimensional height maps, which are generated by confocale laser scanning microscopy, surface defects are detected and classified.
II. QUALITY MANAGEMENT IN MICRO PRODUCTION
For the purpose of achieving an economically efficient production of micro parts the application and development of suitable quality-assuring methods is required. A micro part, defined in the CRC 747 with more than two dimensions less than one millimeter, shows different and new problems in comparison to macro manufacturing. However, it is not possible to apply these methods commonly used for macro-products to micro production [3].
The main characteristic of micro manufacturing is based on so-called "size effects" [4], [5]. These size effects prevent the transfer of manufacturing processes known from the macro to the micro level. Vollertsen described in [6], eight different types of size effects, which he divided into three causal categories of "density", "geometric shape" and "micro structure". Because of using such thin materials, e.g. the grain orientation dominates the material behaviour locally and causes probalistic deviations of material parameters. As a consequence, surface defects occur also in stable processes because they are not predictable. Therefore, process planning, control and quality management have to be adapted to the specific characteristics of micro manufacturing.
According to DIN EN ISO 9000 quality management is defined as the result of coordinated activities which implement the quality policy of the company. It contains quality planning, quality control, quality assurance and quality improvement. A special importance in the quality planning of micro-components is the establishment of manufacturing tolerances for shape deviations. These tolerances are in the sub micron range. Due to this dimensions metrology plays an important role because it is the only access to the micro world.
For the geometrical inspection of micro parts many different measuring systems exist which are mostly tailored to one specific task. Additionally, the demands for an inspection system in micro technology are various [7]. Compared to the macro production the ratio of manufacturing tolerance to measurement uncertainty reduces significantly. In addition, the ability to scan micro parts completely three-dimensional is essential. Due to its flexibility the confocale microscope is an inspection system which is often used in quality assurance. It permits not only the three-dimensional shape acquisition but also the characterization of micro structures [8]. Conventional confocale microscopes are suitable for visualizing and analyzing surfaces. In order to inspect complex micro-parts the component is scanned from different views.
Optical Quality Assurance in Micro Production
Another suitable measurement method for Microsystems inspection is the Digital Holographic Microscopy (DHM). It opens a spectrum of applications in the field of Microsystems. However, one main application is the three-dimensional interferometric deformation measurement. The main advantage of the DHM is the easy and fast processing from recording to reconstruction and evaluation [9].
III. QUALITY INSPECTION OF A MICROCUP The aim of the sub project B5 of the CRC 747 is to provide methods to guarantee safe micro assembly processes. These methods should control the quality of the manufactured micro part. Figure 1 shows the single steps of the implemented quality control loop, which are presented in the next sections. The considered defects of the micro parts include only manufacturing faults on the surface of the component.
Figure 1: Quality Control Loop
The surface inspection is one of the essential tasks of the quality inspection and includes according to VDI/VDE 2601 in principle the determination of the condition of the surface. Within the quality inspection geometrical properties of the surface were checked to detect surface faults and shape variations. DIN EN ISO 8785 describes and classifies over 20 different types of surface imperfections such as grooves, scratches, cracks, pores and outgrowths. Already due to this large number of surface characteristics, testing the surface is one of the most complexes and challenging problems in micro quality inspection because e.g. brightness variations and reflections can occur [10]. Therefore, machine vision techniques are applied to recognize fault parts.
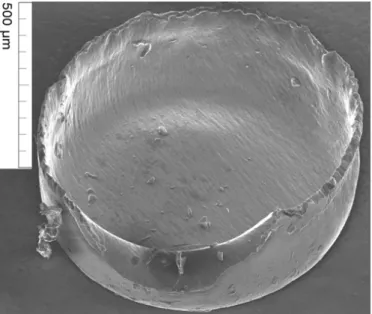
The investigated micro-component "micro-cup" is the result of a deep-drawing process performed in the CRC747. The micro-cup is shown in figure 2. The diameter is about 1 millimeter with a sheet thickness of about 20 microns [11].
In particular, deep-drawn parts cause many problems under the surface examination, because it is difficult to explore the whole angled geometry with the available optics. Problems in manufacturing are tiny impurities of the material or the tool,
which can lead to fractures, blisters and cracks on the micro-cup.
Figure 2: SEM image of a deep-drawn micro cup [11] Recognition of these manufacturing defects requires the use of flexible and robust techniques for industrial image processing. Particular challenges for the metrology and image processing in the CRC 747 is the realization of the surface testing with planned production rates of more than 300 parts per minute and throatiness characteristics up to 0.4 microns. Therefore, extremely fast testing routines are required. For this reason, the DHM is suitable as testing method. To develop the image processing system currently 3D-height maps are used, which are generated by confocale laser scanning microscopy. Later on these 3D-height maps of the laser scanning microscope Keyence VK-9700 should be replaced with ones of the DHM. The wavelength of the VK-9700 laser unit is at 408 nm and in the violet range. The other technical data of the microscope is shown in table 1. The described measurement range is the minimal field of view. The complete measurement range in vertical direction is up to 7 mm.
Table 1: Technical Data Keyence VK-9700 [12] Number of pixels 2048x1536 pixel Measurement Range
(vertical)
67 μm (highest enlargement)
Resolution 0.001 micron
Repeat accuracy 0.02 micron
Optical Zoom 1x to 6x
Light-receiving element Photoelectron Multiplier Tube
loop.
IV. IMAGE PROCESSING OF HEIGHT MAPS Industrial quality inspection is an important application domain of three-dimensional computer vision methods. Traditional vision-based industrial quality inspection systems primarily rely on two-dimensional detection and pose estimation algorithms e.g. relying on the detection of point and line features [13]. One of the most common image processing methods used to recognize a specific object type on a surface is structural analysis [14]. These textural features are calculated directly on the basis of the image to be analyzed or on the basis of a histogram captured from the source image [10]. To detect surface defects on the micro cup these classical image processing techniques are applied on the height maps. Because of the angled geometry of the micro cup, the laser microscope has to record multiple images to reconstruct the whole cup in three dimensional height maps. The pixel intensity of the height maps describes the distance from the laser unit to the micro-object. Figure 2 illustrates the depth image of a micro-cup. The white highlighted area shows a manufacturing error. In this case, a fold can be seen on the surface. For the automatic detection of manufacturing defects several image processing methods are used, which are presented in the following steps. The highlighted segment from figure 3 is used as demonstrating example.
Figure 3: Height map of a micro cup
A. Image Segmentation
Processing the whole image is inefficient because a large area of the height map contains irrelevant information, and is also affected by noise. The noise results from metrology and also from the reflecting surface of the micro cup. In order to reduce processing effort, the object is separated from the noisy background and it is divided into several segments, which are handled independently. Currently, the segmentation in image areas is done by hand, because a lot of the micro cup is affected by noise, which is caused by the reflection of the surface.
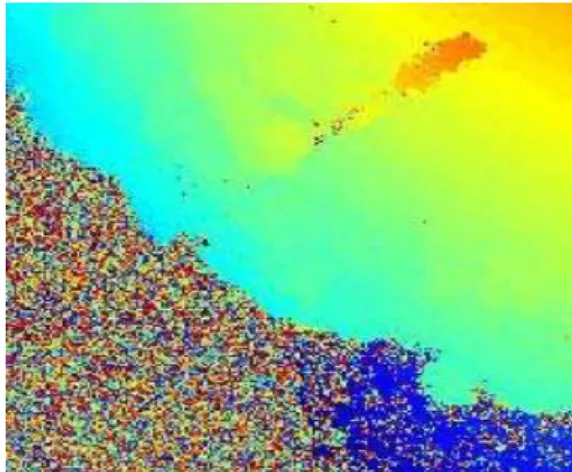
Figure 4 illustrates the highlighted segment from figure 3. In this region the micro part has a manufacturing error. In this case, a fold can be seen on the surface. The characteristics of a fold are a abrupt change in the pixel intensity course. The regular gradient of the pixel values is caused by the angle in
which the micro cup is investigated by the laser scanning microscope.
Figure 4: Height map segment with surface defect
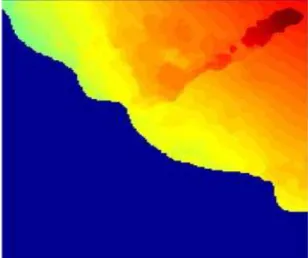
The investigated segment contains part of the noisy background. To distinguish between object and background neighborhood operations were used. In the first step the standard deviation of each pixel of the image segment is computed. The neighborhood pattern is designed as a 20x20 matrix. Image areas which contain noisy background information obtain high values for the standard deviation. Regions which represent the object are characterized by a small standard deviation. Afterwards, a threshold value is defined to distinguish between object and background. Every pixel which value is higher than the threshold is defined as background and represented by the value 0 in the image. In the other case, pixel values which are smaller than the threshold belong to the object and are represented by the value 1. Thereby, a binarization of the image is realized. The result of the binarization is shown in figure 5.
Figure 5: Binarization of the height map segment
The red part represents the micro component and the blue part describes the background. Therefore, segmentation between object and background is done.
B. Measurement Noise Reduction
adapted to three-dimensional images [15]. To reduce measurement noise a median filter is applied to the areas in the original image from figure 4, which are defined as part of the object in the previous segmentation step. The median filter belongs to the class of ranking filters. The values of the pixels in a defined area of a pixel are collected and sorted according to size and placed in a hierarchy. Afterwards, the median in this sorted list is selected and replaces the value of the pixel. Therefore, a reduction of the measurement noise is achieved and shown in figure 6.
Figure 6: Application of median filtering
After the application of the filter, the image is prepared for error region identifying.
C. Edge Detection
The aim of the edge detection the step is to detect continuous edges which are not identical to the edge between object and background. This is performed by applying edge enhancing operators. These operators are also called high-pass filter. They suppress low spatial frequencies, high frequencies were enforced. Thereby, image areas where adjacent pixels different pixel values are emphasized [16]. For this purpose, many different filter algorithms exist. In this case, a Sobel-filter algorithm is applied. The result is shown in figure 7.
Figure 7: Sobel algorithm based edge detection
The red edge has the highest intensity, because the pixel differences between object and background are very high.
The edges, which are detected in the object part of the image, represent surface deformations.
D. Region Definition
The resulting edges have to be classified as surface defect. The necessary characteristics an edge has to fulfill to be classified as surface defect region is a continuous edge pathway. Additionally, the difference between the pixel values from the edge and the environment has to accomplish a special value. The result of the application of these requirements is presented in figure 8.
Figure 8: Defect Region Detection
The green rectangle defines a possible error region, which satisfy the defined requirements. The intensity of the pixel values and the size and shape of the region are determined and committed to the following classification step.
V. DEFECT CLASSIFICATION
The exact classification of defects in material surfaces is essential in the context of the micro-quality system of the CRC 747. The fast and efficient classification should assist the engineers in the process configuration. In order to classify possible surface errors, the application of neural networks is planned, because they have already been successfully used in various numerical applications and their learning ability enables, especially for undefined geometrical forms such as material surface defects, the flexibility needed for identification.
the typologizing of the failure a second classification will be used. This classification decides about good and fault part based on the sizes and the number of defects and also further geometrical deviations will be considered.
VI. CONCLUSION
The mechanical mass production of micro components requires efficient image processing systems in order to meet the stringent quality requirements. To draw conclusions about the surface inspection of micro-components many different standards and applications were presented. Afterwards the developed approach for the surface examination of the micro-cup was described. It uses conventional procedures and machine vision operations on the high-resolution 3D-heigt maps in order to detect surface imperfections on the micro cup.
The implementation of this approach shows that defective surface areas can be successfully identified. The following two-stage classification of the surface imperfection allows a further statistical analysis of manufacturing process, because systematic failures can be identified. The objective of the subsequent project steps are the full implementation of the presented approach and the integration of geometrical measurement.
ACKNOWLEDGMENT
The authors wish to thank the German Research Foundation (DFG) for their support within the Collaborate Research Center 747 – Micro Cold Forming.
REFERENCES
[1] H. Reimer, “BMBF: Die Hightech-Strategie für Deutschland” in Datenschutz und Datensicherheit - DuD, vol. 30, 2006, pp. 665-666
[2] B. Scholz-Reiter, M. Lütjen, N. Brenner, “ Technologieinduzierte Wirkungszusammenhänge in der Mikroproduktion – Entwicklung eines Modellierungskonzepts ” in 22. HAB-Forschungsseminar Digital Engineering, Magdeburg Germany 2009.
[3] J. Fleischer, G. Lanza, M. Schlipf, I. Behrens, “Quality assurance in micro production“ in Microsystem Technologies 12/2006 ; pp.707-712.
[4] K. Zhang, L. Kun, ”Classification of size effects and similarity evaluating method in micro forming” in Journal of Materials Processing Technology 209 (2009) 11, pp. 4949-4953.
[5] X. Lai, L. Peng;, P. Hu, S. Lan, J. Ni, “Material behavior modeling in micro/meso-scale forming process with considering size/scale effects” in Computational Materials Science 43 (2008) 4, pp. 1003-1009.
[6] F. Vollertsen, “Categories of size effects” in Production Engineering 2 (2008) 4. pp. 377-383.
[7] T. Pfeifer, S. Driessen, G. Dussler, “Process observation for the assembly of hybrid micro systems” in Microsystems Technologies 10 (2004) S. 211-218.
[8] T. Wilson, Confocal Microscopy. London: Academic Press, 1996.
[9] W. Jüptner, C. von Kopylow, C. Falldorf, “Digital Holography and its application for microsystems inspection“ in Optoelectronics letters vol. 4 2008.
[10] R. Louban, Image Processing of Edge and Surface Defects. Berlin-Heidelberg: Springer-Verlag, 2009.
[11] F. Vollertsen, Z.Hu, H. Schulze Niehoff, C. Theiler, „State of the art in micro forming and investigations in micro deep drawing“ in Journal of Materials Processing Technology 151, 2004, pp. 70-79.
[12] Keyence 3D Laser Scanning Microscope (VK-9700 SERIES) Specifications.
Available
[13] C. Wöhler, 3D Computer Vision – Efficient Methods and Applications. Berlin-Heidelberg: Springer-Verlag, 2009.
[14] B.Jähne, Digitale Bildverarbeitung. Berlin-Heidelberg: Springer-Verlag, 1997
[15] J. Toriwaki, H. Yoshida, Fundamentals of Three-Dimensional Image Processing. London: Springer-Verlag, 2009.