Original papers
A feasibility cachaca type recognition using computer
vision and pattern recognition
B.U. Rodrigues
a, A.S. Soares
a,⇑, R.M. Costa
a, J. Van Baalen
c, R.L. Salvini
a, F.A. Silva
b, M. Caliari
b,
K.C.R. Cardoso
b, T.I.M. Ribeiro
f, A.C.B. Delbem
e, F.M. Federson
a, C.J. Coelho
d, G.T. Laureano
a, T.W. Lima
a aFederal University of Goiás, Institute of Computer Science, Brazil
bFederal University of Goiás, Food Engineering School, Brazil cUniversity of Wyoming, Computer Science Department, USA
dPontifical Catholic University of Goiás, School of Sciences and Computing, Brazil eUniversity of São Paulo, Institute of Mathematical Science and Computation, Brazil fPolytechnic Institute of Bragança, Portugal
a r t i c l e
i n f o
Article history:
Received 22 July 2015
Received in revised form 6 February 2016 Accepted 21 March 2016
Available online 25 March 2016
Keywords:
Pattern recognition Computer vision Drinks
a b s t r a c t
Brazilian rum (also known as cachaça) is the third most commonly consumed distilled alcoholic drink in the world, with approximately 2.5 billion liters produced each year. It is a traditional drink with refined features and a delicate aroma that is produced mainly in Brazil but consumed in many countries. It can be aged in various types of wood for 1–3 years, which adds aroma and a distinctive flavor with different characteristics that affect the price. A research challenge is to develop a cheap automatic recognition sys-tem that inspects the finished product for the wood type and the aging time of its production. Some clas-sical methods use chemical analysis, but this approach requires relatively expensive laboratory equipment. By contrast, the system proposed in this paper captures image signals from samples and uses an intelligent classification technique to recognize the wood type and the aging time. The classification system uses an ensemble of classifiers obtained from different wavelet decompositions. Each classifier is obtained with different wavelet transform settings. We compared the proposed approach with classical methods based on chemical features. We analyzed 105 samples that had been aged for 3 years and we showed that the proposed solution could automatically recognize wood types and the aging time with an accuracy up to 100.00% and 85.71% respectively, and our method is also cheaper.
Ó2016 Elsevier B.V. All rights reserved.
1. Introduction
Brazilian rum is an alcoholic drink obtained from the fermenta-tion of molasses and other derivatives of sugar producfermenta-tion. Drinks such as whiskey, brandy, and wine are aged in oak barrels, but Brazilian rum uses different wood types in this process, such as amburana (Amburana cearensis), oak (Quercusspp.), and castan-heira (Bertholletia excelsaH.B.K). Each wood has different effects during the aging process, which determine the color, odor, and taste characteristics of the drink.
Legislation classifies cachaca into three types: aged, premium, and extra premium. The difference among types is related to aging time and shelf life. Aged and premium have aging period of at least 1 year. Aged may contain up to 50% non-aged cacacha. Premium
has 100% aged cachaca. Extra premium has a minimum aging per-iod of at least 3 years and cannot contain non-aged cachaca.
Despite the legislation, production can deviate from quality standards or can be fraudulent. Because of this, new technologies have been investigated to improve quality control. The develop-ment of a method to recognize the wood type and the aging time is important for preventing fraud and to enforce regulations related to the identification of the different types.
De Souza et al. (2006) and de Souza et al. (2007)uses gas chro-matography to separate and characterize the odors in cachaca and rum. These two products of sugarcane were compared and pat-terns identified from a descriptive sensory analysis. The author used principal component analysis (PCA), a statistical approach in which data are represented by a subset of their eigenvectors. His work contributed to further studies that use this technique for the identification of artisanal and industrial cachaca as well as the detection of adulteration by adding caramel and other substances such as dyes. The disadvantage of this method is that
http://dx.doi.org/10.1016/j.compag.2016.03.020
0168-1699/Ó2016 Elsevier B.V. All rights reserved.
⇑Corresponding author.
E-mail address:[email protected](A.S. Soares).
Contents lists available atScienceDirect
Computers and Electronics in Agriculture
it differentiates between cachacas and rums using mass spectrom-etry, which is difficult to maintain because of its high cost.
Recent works use techniques of computer vision, neural net-works, genetic algorithms, and statistical methods for food and drink classification (Kongsro, 2014; Kashiha et al., 2014; Fernán dez-González et al., 2014; Kashiha et al., 2013; Rodríguez-Pulido et al., 2013). Duarte-Mermoud et al. (2010)proposed a method based on Quadratic Discriminant Analysis (QDA) for wine recogni-tion, where features were extracted from liquid chromatograms (based on a diode alignment detector) of polyphenolic compounds present in wine samples. Near-infrared spectrometry and chemo-metric methods for classification were applied successfully by Pontes et al. (2006)to verify the adulteration of whiskey, brandy, rum, and vodka. The characterization of drinks was accomplished by chemometric models based on classification methods. Accord-ing toPathare et al. (2013), alternatives to chemometric techniques include the use of a colorimeter, which is a light-sensitive instru-ment that measures how much color is absorbed by an object or substance. Recently,Rodrigues et al. (2014)showed that colorime-ters can obtain useful information about types of Brazilian rum. However, chemometric and colorimetric approaches are expensive in actual practice.
In this paper we propose a relatively cheap system based on visual color information for the recognition of wood type and aging time. The system comprises a capture device and software that processes and classifies samples using color features. The image is captured by a traditional additive color model (RGB), which uses the primitive colors red (R), green (G), and blue (B) to reproduce a broad array of colors (Gevers et al., 2012). The RGB color model is not efficient for representing perceptual color distances in real-world images. RGB components have the same color depth and not all colors can be represented as a combination of primitive col-ors (Gevers et al., 2012). In addition, luminance (luma) and color (chroma) information is distributed in the R, G, and B components, which can complicate wood type recognition.
The proposed system transforms the images captured from RGB into the CIE 1976L⁄a⁄b⁄color model, which separates perceptual lightness information (L⁄) from color opponent information (a⁄ andb⁄) (Reinhard et al., 2008). This model is a non-linear compres-sion of tristimulus CIE 1931 XYZ color space that achieves a percep-tual uniformity and enables computing perceppercep-tual color differences using Euclidean distance. Due to more uniform color perception representation, the CIEL⁄a⁄b⁄color space is more suitable for per-ceptual color metrics (Reinhard et al., 2008). The differences in the perceptual white intensity of samples can be standardized by converting RGB data into theL⁄a⁄b⁄format by removing the light-ness (L⁄) component. This correction reduces the effect of variations in lightness contrast on the color features of samples. Next, an ensemble based on the Adaptive Boosting (AdaBoost) algorithm is carried out on images decomposed by wavelet transforms. The pro-posed method consists of generating an ensemble model as a com-bination of images with different resolutions over the same sample. The images of different resolutions are obtained by using different wavelet transform settings in a way similar to that proposed by Pinto et al. (2010). It has been reported that the ensemble model is often more accurate than its individual classifiers (Schaefer et al., 2014; Sujatha et al., 2013; Yu et al., 2012). The final result is obtained by co-averaging the results of the individual classifiers.
2. Proposed system
The proposed approach is a typical computer vision system with a hardware device for image capture, an information processing method for feature extraction using wavelet coefficients, and a clas-sifier ensemble for making the final decision required for the appli-cation. Each component is describe in the following subsections.
2.1. Hardware device
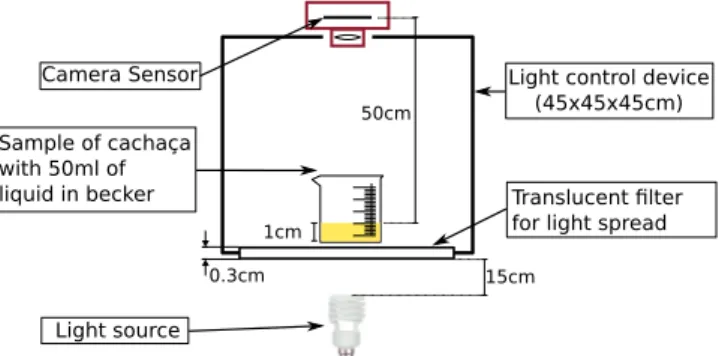
The proposed system comprises a capture device and intelligent software that assigns input signals to the correct wood type and ageing time.Fig. 1shows our capture device. The samples are pho-tographed with a digital camera (Canon EOS REBEL XS) with the ISO 100 configuration, an aperture of 4.0 mm, and image format set to RAW. The light used to photograph the samples is given by a fluorescent lamp (40 W and 6400 K color temperature), which enables the incidence of light to be controlled in the direction opposite to the camera lens. A special 3 mm filter with non-reflective white acrylic prevents reflections in the liquid, thereby producing a digital image that is suitable for computational pro-cessing. The light control device located on the sides and at the top is built from wood painted with matte black paint.
An image collected in the RGB color model is converted into the
L⁄a⁄b⁄color model. The color conversion is performed from RGB to XYZ and finaly to CIEL⁄a⁄b⁄color space considering CIE standard illuminant D65 as described byGevers et al. (2012). TheL⁄ compo-nent is expressed as continuous lightness from 0 for black to 100 for white. The color opponent dimensions,a⁄andb⁄, range from greenish to reddish and from bluish to yellowish respectively in a continuous and unbounded range of values. In the proposed approach, the lightness component is removed from the samples to reduce interference caused by variations in lightness.
2.2. Information processing
Fig. 2presents the basic schema proposed in this paper. It con-sists of wavelet decomposition filter banks with low-pass and high-pass filters, each followed by a downsampling operation (#2). Wavelets are defined by a wavelet functionwðtÞ(also called a mother wavelet) and a scaling function/ðtÞ(also called a father wavelet) in the time domain. The low-pass filter is associated with the father wavelet while the high-pass filter is associated with the mother wavelet (Mallat, 1999). The wavelet filter banks contain a collection of images of decreasing resolution. The first level has the highest resolution while the last level has the lowest.
The choice of the mother wavelet was made empirically (Mallat, 1999; Petrosian and Meyer, 2013). The filter bank was tested with different mothers wavelets of the Daubechies (db), and Symlet (sym) families, which are commonly used in image analysis. Over-all, 10 filters were employed (db2-db6 and sym4-sym8).
InFig. 2(b), each low pass filter result is reapplied to the results of the others to obtain new images at higher levels, i.e., with lower resolution. The input features for the classifiers are the wavelet coefficients in each decomposition level. The multilevel decompo-sition provides the information about frequency components pre-sent and enhance the information about the images. The first level contain high frequencies. The patterns are generally hardly
recognize them because of noise, while the subsequent levels will contain more and more useful information and less noise. The final result is obtained by co-averaging the individual classifiers Multi-Layer Perceptron (MLP), Support Vector Machine (SVM), and Naive Bayes at each decomposition level. In all cases, the number of decomposition levels varied from one to ten.
3. Experiments and settings
In the beverage laboratory at the School of Agronomy in the Fed-eral University of Goiás, Brazil, 105 cachaca samples (35 of each wood type) were aged for 3 years in three wood types: amburana (A. cearensis), oak (Quercusspp.), and castanheira (B. excelsaH.B.K). The chemical analysis measured the intensity of the features described inTable 1, using an alcohol content of 38–48% by volume at 20°C.
The pH (features 4 and 5) was measured with a Digital pH Meter, calibrated at 20°C.
Density (features 1 and 2) was measured using a pyknometer considering specific weight of water with temperature of 20°C. True alcoholic strength at 20°C (features 7–13), volatile acidity, fixed, total and dry extract: were performed according to Brazil-ian official methods of analysis for distilled beverages (DO BRASIL, 1973).
Total phenolic compounds (features 3–14): were determined according to the official method of analysis of AOAC 952.03 (AOAC, 1997), derived from the standard calibration curve with tannic acid, with reading in absorbance at 760 nm.
Aldehydes (features 6–14) and total esters (feature 3) and higher alcohols, isoamyl (feature 10), isobutyl (feature 9) and n-propyl (attributes 8): were determined by gas chromatograph Shimadzu GC-17A equipped with automatic injection, automatic ionization detector, a flame ionization detector and capillary column DB-VAX (30 m0.25 mm0.25 mm). Con-centration of the compounds were measured using the area method with external calibration standards.
Vitro antioxidant activity tests (attributes 3 and 14): were determined by the method described by Willianms in Brand-Williams et al. (1995). This method is based on the stable radi-cal DPPH removal from the reaction medium by the action of antioxidants in the sample.
4. Results
The classifier was trained using the leave-one-out cross-validation method. In this procedure, givennsamples, the classifier is trained withn1 observations. The resulting model is then val-idated with the remaining data. The procedure is repeated until all of the samples have been left out once during training.
The ensemble uses the AdaBoost (Zhang and Ma, 2012) algo-rithm with MLP, SVM, and Naive Bayes classifiers, and six individ-ual classifiers for comparisons: Linear Discriminant Analysis (LDA), Quadratic Discriminant Analysis (QDA),k-Nearest Neighbors algo-rithm (k-NN), MLP, SVM, and Naive Bayes.
All individual classifiers and those that were used in the ensem-ble used built-in functions of Matlab in the standard configuration. The number ofknearest neighbors ofk-NN algorithm was defined experimentally.
4.1. Analysing the wood type
Table 2shows the results using two methods: (1) chemical fea-tures as input for classifiers and (2) feafea-tures based on computer vision for individual classifiers and wavelet ensemble. Using chem-ical features, the best individual result was obtained by MLP with 96.23% (4 errors). In the proposed approach, the use of the
Fig. 2.Ensemble scheme with wavelets coefficients.
Table 1
computer vision system to generate the features improves the accuracy of classifiers, in general.
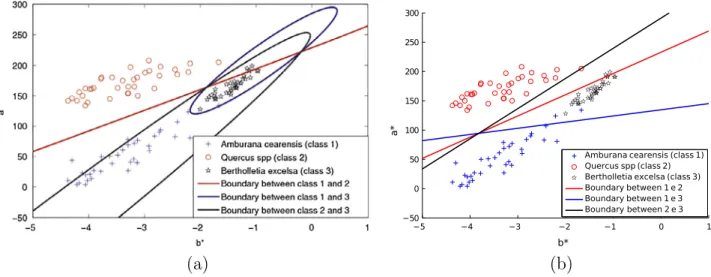
The ensemble based on wavelet coefficients reached 100.00% (no errors) accuracy. Classifiers based on non-linear boundaries (MLP and Ensemble) have higher accuracy than others (LDA, SVM, and Naive).Fig. 3shows the boundary decisions generated by a linear and non-linear classifier.
InFig. 3(a), QDA separates the classes based on a quadric sur-face, i.e., the decision boundaries are quadratic equations produc-ing a more flexible classifier. The decision boundary produced by LDA inFig. 3(b) is linear between classes 1 and 2, as well as the boundary between classes 1 and 3, and between classes 2 and 3.
4.2. Analysing the aging time
Table 3shows the overall result for recognition of aging time. As can be seem, this problem is more difficult than recognition of
wood type. Using chemical features, the best result was obtained by MLP with 16 errors. Using our approach, all individual classifiers had a lower performance than with chemical features. However, using the ensemble, 85.71% (15 errors) accuracy was obtained just like MLP. However, the proposed approach with a computer vision system is cheaper than chemical analysis. The chemical analysis performed in this experiment required equipment that costs between $3000 and $5000 (U.S. dollars). By contrast, the proposed approach uses equipment that costs approximately $100 (U.S. dol-lars), disregarding the software development cost. In this way, it seems clear that the proposed approach is a good option in con-trast to chemical analysis.
5. Conclusions
In this study, we proposed a computer vision system with a wavelet ensemble for recognizing different types of Brazilian rum. The classical solution to this problem involves the use of chemical analysis, which is known to be effective, but requires rel-atively expensive equipment and expert professional skills. By con-trast, our proposed system is significantly cheaper, more effective, yields more accurate classifications and do not requires specialized knowledge about chemical analysis. Our capture device can be built using simple materials and devices (easy to find) such as wood, matte paint, camera and a fluorescent lamp.
In our experiments, using the proposed approach, no sample was incorrectly classified for the recognition of wood type, while for the recognition of aging time fifteen samples were misclassi-fied. The results show that combination of classifiers improves the generalization ability of the classification system is also more stable results than the individual classifiers. The use of AdaBoost
Table 2
Overall result for wood type recognition.
LDA QDA k-NN MLP SVM Naive Ensemble
Using chemical features
Accuracy Rate (%) 93.45 –a 95.23 96.26 93.45 92.38 –
Number of errors 7 – 5 4 7 8 –
Our approach
Accuracy Rate (%) 97.14 99.06 97.14 99.04 99.04 97.14 100.00
Number of errors 3 1 3 1 1 3 0
a Collinearity among the attributes prevented the inversion of the matrix covariance used by the classifier, thus no results were obtained from the QDA with chemical
features.
(a)
(b)
Fig. 3.Boundary decisions generated by (a) QDA and (b) LDA for the wood type recognition problem.
Table 3
Overall result for recognition of aging time.
LDA QDA k-NN MLP SVM Naive Ensemble
Using chemical features
Accuracy rate (%)
79.04 80.95 78.09 84.76 81.90 80.00 – Number of
errors
22 20 23 16 19 21 –
Our approach
Accuracy rate (%)
68.57 70.47 70.47 69.52 72.38 68.57 85.71 Number of
errors
in conjunction with color information provides more satisfactory results than the method which uses the colorimetric data.
More detailed studies and external validation should be carried out to confirm the usefulness of this device. However, the con-struction of an automatic classifier in a controlled environment using images is feasible and represents a new alternative to replace chemical attributes for Brazilian rum type classification.
Acknowledgments
The authors would like to thank the Brazilian research founda-tions: Fundação de Amparo a Pesquisa do Estado de Goiás (FAPEG), CAPES, and CNPq for their financial support.
Appendix A. Supplementary material
Supplementary data associated with this article can be found, in the online version, athttp://dx.doi.org/10.1016/j.compag.2016.03. 020.
References
AOAC INTERNATIONAL, 1997. Official Methods of Analysis 16th ed., vol. 2. AOAC International, Gaitherburg, pp. 1–43, 3rd rev. (Chapter 32).
Brand-Williams, W., Cuvelier, M.E., Berset, C., 1995. Use of a free radical method to evaluate antioxidant activity. {LWT} – Food Sci. Technol. 28 (1), 25–30.
De Souza, M.D., Vásquez, P., del Mastro, N.L., Acree, T.E., Lavin, E.H., 2006. Characterization of cachaça and rum aroma. J. Agric. Food Chem. 54 (2), 485– 488.
de Souza, P.P., Augusti, D.V., Catharino, R.R., Siebald, H.G., Eberlin, M.N., Augusti, R., 2007. Differentiation of rum and brazilian artisan cachaça via electrospray ionization mass spectrometry fingerprinting. J. Mass Spectrom. 42 (10), 1294– 1299.
Do Brasil, S.F., 1973. Decreto no 73.267, 06 de dezembro de 1973.
Duarte-Mermoud, M.A., Beltrán, N.H., Bustos, M.A., 2010. Chilean wine varietal classification using quadratic fisher transformation. Pattern Anal. Appl. 13 (2), 181–188.
Fernández-González, A., Montejo-Bernardo, J.M., Rodríguez-Prieto, H., Castaño-Monllor, C., Badía-Laíño, R., Díaz-García, M., 2014. Easy-to-use analytical approach based on ATR–FTIR and chemometrics to identify apple varieties under Protected Designation of Origin (PDO). Comput. Electron. Agric. 108, 166– 172.
Gevers, T., Gijsenij, A., Van de Weijer, J., Geusebroek, J.-M., 2012. Color in Computer Vision: Fundamentals and Applications, vol. 23. John Wiley & Sons.
Kashiha, M., Bahr, C., Ott, S., Moons, C.P., Niewold, T.A., Ödberg, F., Berckmans, D., 2013. Automatic identification of marked pigs in a pen using image pattern recognition. Comput. Electron. Agric. 93, 111–120.
Kashiha, M., Bahr, C., Ott, S., Moons, C.P., Niewold, T.A., Ödberg, F.O., Berckmans, D., 2014. Automatic weight estimation of individual pigs using image analysis. Comput. Electron. Agric. 107, 38–44.
Kongsro, J., 2014. Estimation of pig weight using a Microsoft Kinect prototype imaging system. Comput. Electron. Agric. 109, 32–35.
Mallat, S., 1999. A Wavelet Tour of Signal Processing. Academic Press.
Pathare, P.B., Opara, U.L., Al-Said, F.A.-J., 2013. Colour measurement and analysis in fresh and processed foods: a review. Food Bioprocess Technol. 6 (1), 36–60.
Petrosian, A.A., Meyer, F.G., 2013. Wavelets in Signal and Image Analysis: From Theory to Practice, vol. 19. Springer Science & Business Media.
Pinto, L.A., Galvão, R.K.H., Araújo, M.C.U., 2010. Ensemble wavelet modelling for determination of wheat and gasoline properties by near and middle infrared spectroscopy. Anal. Chimica Acta 682 (1), 37–47.
Pontes, M., Santos, S., Araujo, M., Almeida, L., Lima, R., Gaiao, E., Souto, U., 2006. Classification of distilled alcoholic beverages and verification of adulteration by near infrared spectrometry. Food Res. Int. 39 (2), 182–189.
Reinhard, E., Khan, E.A., Akyz, A.O., Johnson, G.M., 2008. Color Imaging: Fundamentals and Applications. A.K. Peters, Ltd., Natick, MA, USA.
Rodrigues, B.U., da Costa, R.M., Salvini, R.L., da Silva Soares, A., da Silva, F.A., Caliari, M., Ribeiro, T.I.M., 2014. Cachaça classification using chemical features. Procedia Comput. Sci. 29, 2024–2033.
Rodríguez-Pulido, F.J., Gordillo, B., González-Miret, M.L., Heredia, F.J., 2013. Analysis of food appearance properties by computer vision applying ellipsoids to colour data. Comput. Electron. Agric. 99, 108–115.
Schaefer, G., Krawczyk, B., Celebi, M.E., Iyatomi, H., 2014. An ensemble classification approach for melanoma diagnosis. Memetic Comput. 6 (4), 233–240.
Sujatha, V., Punithavalli, M., Thavavel, V., 2013. Applicability of ensemble clustering and ensemble classification algorithm for user navigation pattern prediction. J. Artif. Intell. 6 (3), 210.
Yu, G., Zhang, G., Yu, Z., Domeniconi, C., You, J., Han, G., 2012. Semi-supervised ensemble classification in subspaces. Appl. Soft Comput. 12 (5), 1511–1522.