450 Hasina Khatun et al.
Experimental Study of Low-Pressure Nitrogen Dielectric Barrier Discharge
Hasina Khatun∗ and A.K. Sharma†
Microwave Tubes Area,
Central Electronics Engineering Research Institute (CEERI)
(A constituent laboratory of Council of Scientific and Industrial Research, CSIR) Pilani, Rajasthan-333031, INDIA
P.K. Barhai‡
Applied Physic Department, Birla Institute of Technology Ranchi-835215, India
(Received on 27 September, 2010)
The electrical and spectral characteristics of a dielectric barrier discharge (DBD) are experimentally investi-gated in a sealed off coaxial cylinder filled with nitrogen at a pressure of 10 mbar. The discharge is a transient diffused glow at low frequency alternating voltage (60 Hz) and changes to a filamentary mode at high frequency alternating voltage (35 kHz). In case of pulsed voltage, the discharge is always transient diffused glow at any frequency. The intensity of a second positive system (SPS) of the nitrogen molecule has been also measured to characterize the discharge excitation. The effective vibrational temperature is estimated from the SPS vibra-tional band,∆v=−2. It is concluded that the intensity of the SPS of the nitrogen and the effective vibrational temperature depends upon the reduced electric field and the energy consumed per cycle by the device. Keywords: Dielectric barrier discharge, Second positive system, effective vibrational temperature.
1. INTRODUCTION
The DBD based plasma sources are mercury free and envi-ronmental friendly. Therefore, the DBD technology is exten-sively adopted by many industries and scientific societies [1-2]. In the DBD, the electrodes are coated with dielectric and the gas is filled in between the coated dielectric electrodes. The electrons gain electrical energy to initiate discharges by either alternating voltage or pulsed voltage. During the dis-charge, the gas is excited and the neutral gas temperature remains close to the ambient temperature. This property of plasma is called non-thermal non-equilibrium plasma.
The DBD sources are excited by low to high frequency operating voltage. Depending on the operating conditions, numerous investigations have been performed to understand and explain the physical basis of the discharge mode [2-6]. There are three types of discharge mode namely filamentary, diffused glow and glow. The DBD consists of microdis-charges and randomly distributed over the gap [3]. These mi-crodischarges are overlapped with each other and cover uni-formly the entire dielectric surface, which in turn appear as the diffused glow and glow. In order to improve and imple-ment the DBD technology for different type of applications, it requires studying the excitation processes in these dis-charge modes. The Townsend’s theory helps to describe the low-pressure gas discharge. The detailed study of the sealed off coaxial low-pressure nitrogen DBDs will contribute the better understanding of the fundamental processes involved in DBDs. The DBD sources can exhibit non-thermal plasma property even at atmospheric pressure or above [6-7]. The atmospheric pressure conditions are most suitable for DBD based ultraviolet (UV)/ vacuum ultraviolet (VUV) excimer
∗Electronic address:shamina\[email protected]
†Electronic address:[email protected] ‡Electronic address:[email protected]
sources. In case of high-pressure discharge, the electron avalanche of critical size distorts the local electric field by the space charges of electrons and positive ions. This mech-anism is called streamer and it is too tough to understand the streamer processes involved in high-pressure DBD.
This paper includes the electrical as well as the optical char-acteristics of the discharge mode at different excitation volt-ages. The experimental results of the low-pressure dielec-tric barrier discharge (LPDBD) source and also the extended studies of Wagnaars et al are described [2]. The diffused glow discharge mode appears at low frequency alternating voltage as well as unipolar-pulsed voltage excitation. The transient filamentary discharge is observed at high frequency alternating voltage. The discharge dynamics are also dis-cussed in terms of the measured emission spectrum of nitro-gen. The intensity of the emission spectrum describes the population of the vibrational states of the nitrogen molecular species. The effective vibrational temperature is calculated from the measured second positive system (SPS) of nitrogen molecule. The effective vibrational temperature affects the plasma reactivity. Further, the experimental results are used to analyse the discharge in terms of the energy consumed per cycle and the reduced electric field,E/NwhereEis the elec-tric field andNis the neutral gas density.
2. EXPERIMENTAL ARRANGEMENT
The sealed off cylindrical coaxial double barrier pyrex glass tube (εr=5.6) of length 300 mm is fabricated. The gap
Brazilian Journal of Physics, vol. 40, no. 4, December, 2010 451
FIG. 1: Schematic diagram of experimental setup. (Gas gap-1, Pyrex-2, CuSil foil-3, Cu mesh-4, Collimated lens with optical fibre-5, High voltage probe-6, Current probe-7, Power supply-8, Resistance-9, Oscilloscope-10, Spectrometer-11)
barrier discharge (LPDBD) nitrogen. The high voltage probe (P6015A) and the current probe (Pearson) are used to mea-sure the voltage waveforms across the DBD and the current waveforms through the DBD, respectively. The schematic of experimental setup is described in figure 1. The digital os-cilloscope (Tektronix TDS3034B, 500 MHz) synchronously displays the voltage and current signals. The characteristic spectrum of nitrogen is measured by a spectrometer (HR: 4000, Ocean Optics) through an optical fiber and focused onto the slit of the spectrometer using a collimated lens.
3. EXPERIMENTAL RESULTS
3.1. Electrical characteristics
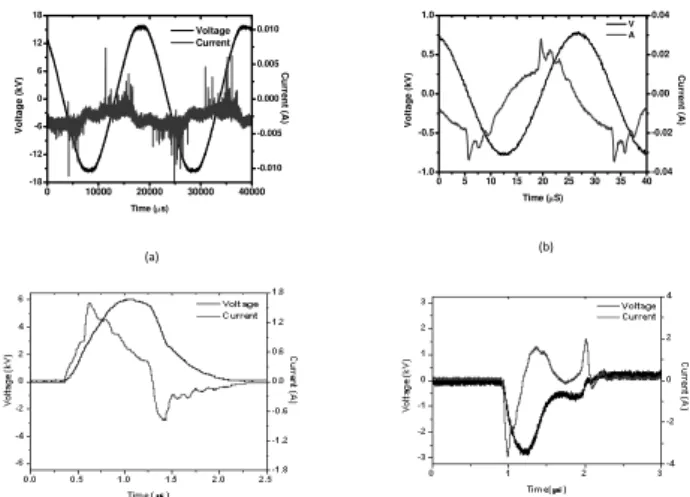
The discharge characteristics in terms of voltage and cur-rent waveforms at diffecur-rent operating conditions are shown in figures 2(a), (b), (c) and (d). At 60 Hz alternating voltage, the current waveform consists of large numbers of current pulses and the duration of each current pulse is more than 1µs (figure 2(a)). The current pulses occurs upto the maximum applied voltage during each half cycle. During the discharge, charges accumulate on the dielectric surface and the internal electric field builds opposite to the external alternating volt-age. The discharge occurs in the form of the microdischarge and the extinction of these microdischarges takes place af-ter few microseconds. Each microdischarge is suppressed by overlapping of the near by microdischarge feet and the tran-sient diffusive glow discharge is appeared in the gas gap [8]. An increase in the driving frequency i.e. 35 kHz, the num-ber of current pulses per half cycle decreases to few numnum-bers and each current pulse of width few hundred nanoseconds (figure 2(b)). The amplitude of the current pulse at the high frequency alternating voltage is much higher than the low frequency alternating voltage. This implies that the number of electron density is higher at the high frequency alternating voltage [9].
0 10000 20000 30000 40000
-18 -12 -6 0 6 12 18
Voltage Current
Time (µs)
V
o
lt
age (kV)
-0.010 -0.005 0.000 0.005 0.010
Cu
rr
e
n
t (A)
(a)
0 5 10 15 20 25 30 35 40
-1.0 -0.5 0.0 0.5 1.0
V A
Time (µS)
Vo
lta
g
e
(k
V)
-0.04 -0.02 0.00 0.02 0.04
Cu
rrent (A)
(b)
FIG. 2: I-V characteristics of nitrogen discharges excited by (a) 16 kVp, 60 Hz alternating voltage (b) 0.767 kVp, 35 kHz alternating
voltage (c) 6 kV, 1 kHz positive unipolar pulsed voltage and (d) 3 kV, 14 kHz negative unipolar pulsed voltage (Pressure=10 mbar)
In case of nitrogen LPDBD driven by the unipolar-pulsed voltage, the current waveform is characterized by single peak at the rising and the trailing edge of the pulsed voltage ir-respective of the applied voltage frequency (figures 2(c) and 2(d)). At the rising front of the voltage pulse, the primary dis-charge is occurred and the voltage falling flank is followed by the secondary discharge, without consuming the external ap-plied energy. Thus, the discharge excitation by the unipolar-pulsed voltage enhances the efficiency of the coaxial DBD source [9-11]. In figure 2(d), the sharp rise in current pulse is observed due to the small pulse width and fast rise time of the negative unipolar-pulsed voltage. The discharge cur-rent peak decreases slowly and covers the entire dielectric surface at the low applied unipolar-pulsed frequency (1 kHz) and the pulse width is about 1 µs. The current waveform at low and high frequency, the unipolar-pulsed voltage con-firms diffused type glow discharge [9]. The magnitude of the current pulses reaches few amperes unlike milliamperes in case of the alternating voltage excitation. This is due to the discharge current superimposed with the high displacement current.
3.2. Optical characteristics
The input electrical energy directly transfers to the elec-trons, results in electronic collision. The gaseous species are excited to the higher electronic states. These species decay from the higher electronic states, which emit photons of their characteristic wavelength. The emission spectrum of the SPS gives information of the molecular nitrogen species and its concentration under different discharge conditions.
Figure 3 shows that the measured emission spectrum consists of the molecular SPS band of nitrogen. According to the operating conditions, the occurrence of the SPS dominates over the first negative system (FNS) [12]. The population of the excited states N2(C3Πu) andN2+(B2Σ+u) are caused
452 Hasina Khatun et al.
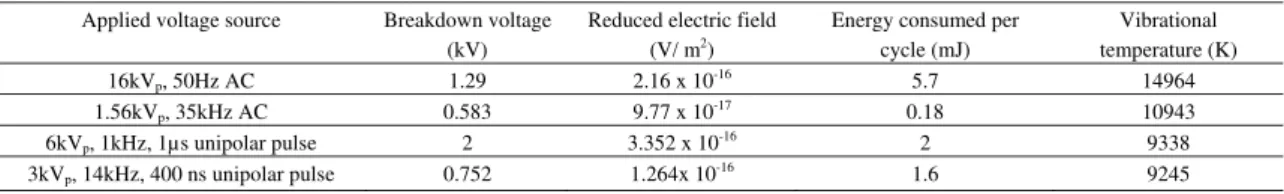
Table 1 Electrical parameters and effective vibrational temperature at different operating condition
Applied voltage source Breakdown voltage
(kV)
Reduced electric field
(V/ m2
)
Energy consumed per cycle (mJ)
Vibrational temperature (K)
16kVp, 50Hz AC 1.29 2.16 x 10⁻¹⁶ 5.7 14964
1.56kVp, 35kHz AC 0.583 9.77 x 10⁻¹⁷ 0.18 10943
6kVp, 1kHz, 1µs unipolar pulse 2 3.352 x 10⁻¹⁶ 2 9338
3kVp, 14kHz, 400 ns unipolar pulse 0.752 1.264x 10⁻¹⁶ 1.6 9245
ground stateN2(X1Σ+g)or via the electron impact ionization
of the nitrogen moleculeN2+(X2Σ+
g). The excitation energy
of the statesN2(C3Πu)andN2+(B2Σ+u)for the corresponding
vibrational levelv′=0, are 11.1 eV and 18.7 eV, respectively. The transition fromN2(C3Πu,v′=0)toN2(B3Πg,v′′=0)
emits the characteristics photons of (0-0) band of the SPS at 337.1 nm [13]. Similarly, the subsequent radiative decays of the excited state N2+(B2Σ+u, v′=0) toN+
2(X2Σ+g,v′′=0)
emits the characteristics photons of (0-0) band of the FNS at 394.1 nm [13].
At low frequency alternating voltage, the nitrogen plasma shows only the SPS spectrum (figure 3 (a)). The high fre-quency alternating voltage and the unipolar pulsed excitation produces two to three times more intense peaks of the SPS band (figures 3 (b), (c), (d)). In these spectrum, few peaks of the FNS band are also observed (figures 3 (b), (c), (d)). The emission intensity of the particular wavelength from the ex-cited state is proportional to the concentration of the species present in that excited state.
In LPDBD nitrogen, the excitations are also characterized in terms of the vibrational temperature,Tv. The vibrational
states of second positive system,∆v=−2 helps to estimate
Tv. For non-equilibrium plasma, the effective vibrational
temperature is evaluated from the slope of log (I/ν4) against
G(v′), whereI is the relative intensity andG(v′)is the vibra-tional term [14]. Figure 4 represents the graphs between log (I/ν4) w. r. t the term value.
4. DISCUSSION
The transient diffusive glow discharge is observed in the ni-trogen LPDBD source driven by the low frequency alternat-ing voltage and low to high frequency unipolar-pulsed volt-age. During the discharge, the energy consumed per cycle is calculated using the breakdown voltage, applied frequency, applied peak voltage and capacitance of the double barrier dielectric discharge [15]. Table 1 shows the above listed pa-rameters at different operating conditions. The breakdown voltage is high at the low frequency irrespective of the ex-citation voltage i.e. the alternating voltage and the unipolar pulsed voltage. In case of the unipolar-pulsed voltage, the rate of change of the applied voltage is fast in comparison to the alternating voltage, causes breakdown of the nitrogen gas at high voltage. The reduced electric field, E/N at the high breakdown voltage is not sufficient enough to cause large ex-cited species as shown in figure 3 (a). The value ofE/N is lower at 35 kHz alternating voltage, which results into high intensity (figure 3 (b)). The fast rise time of the unipolar-pulsed voltage increases the value ofE/N, which results into
2 0 0 3 0 0 4 0 0 5 0 0
0 5 0 1 0 0 1 5 0 2 0 0
In
ten
s
it
y (
a
rbi
trary
u
n
its
)
W a ve le n g th (n m )
(a)
200 300 400 500
0 100 200 300 400 500 600
C
ounts
(a
rbitra
ry
unit)
Wavelength(nm)
(b)
200 300 400 500
0 100 200 300 400 500
Intens
ity (arbitrar
y
units)
Wavelength (nm)
(c)
200 300 400 500
0 125 250 375 500 625 750
In
te
ns
ity
(
a
rb
itra
ry
u
n
it
s
)
Wavelength (nm)
(d)
FIG. 3: Intensity spectrum of second positive system of nitrogen (10 mbar) observed in coaxial DBD driven by (a) 16kVp, 60 Hz alternating voltage, (b) 1.56kVp, 35 kHz alternating voltage, (c) 6 kV, 1 kHz positive unipolar pulse (1µs pulse width) and (d) 3 kV, 14 kHz negative unipolar pulse (400 ns pulse width).
0 1000 2000 3000 4000 5000 6000
-16.1 -16.0 -15.9 -15.8 -15.7 -15.6 -15.5 -15.4 -15.3 -15.2
log(
I
/
ν
4
)
Wavenumber, G(v′)
50Hz AC
1kHz Unipolar pulse 14kHz Unipolar pulse 35kHz AC
FIG. 4: Effective vibrational temperature of nitrogen in a LPDBD at 10 mbar pressure w. r. t term value.
Brazilian Journal of Physics, vol. 40, no. 4, December, 2010 453
ofE/Nis low.
The measured emission intensity of (0-0) band of the FNS and SPS of nitrogen molecule shows that the dominating peak of the molecular band strongly depends upon the input electrical power and also on the operating conditions. The effective vibrational temperature is calculated from the slope of log (I/ν4) against G (v) from figure 4 and is listed in
Ta-ble 1. The effective vibrational temperature is low when ex-cited by unipolar-pulsed voltage in comparison to alternating voltage. From the above statement, we can conclude that the heat generation will be less in case of unipolar-pulsed voltage excitation. The effective vibrational energy also decreases with decrease in the energy consumed per cycle by the DBD source. The results of effective vibrational energy are also in good agreement with well-known correlation [12-13]. The experimental results at the low pressure follow the dis-charge characteristics operating at high pressure [17]. Ei-ther alternating voltage or pulsed voltage excitation, initially the low-pressure discharge follows the Townsend breakdown mechanism and later formation of microdischarges is ob-served. According to Wagnaars et al, the low-pressure ar-gon DBD consists of glow discharge like dc glow discharge2. The results presented in this paper show the transient diffu-sive glow discharge as well as filamentary discharge. This is due to the high operating pressure, smaller gas gap and
dif-ferent excitation method in comparision to Wagnaars et al.
5. CONCLUSION
The microdischarges occur in the low-pressure nitrogen DBD and overlapped by nearby microdischarge feet to cause diffused glow like discharge in case of low frequency alter-nating voltage and low to high frequency unipolar pulsed voltage. The electrical and spectral behaviour is discussed in terms of the reduced electric field and the effective vi-brational temperature, respectively. The pulsed voltage with the fast rise time and the high frequency shows the maxi-mum emission intensity at high reduced electric field. The emission spectrum of the nitrogen mainly consists of SPS band and the vibrational temperature depends upon the en-ergy consumed per cycle as well as reduced electric field.
Acknowledgement
Authors acknowledge the support and encouragement of Di-rector, CEERI Pilani and Dr. SN Joshi, Emeritus Scientist, CEERI Pilani.
[1] U. Kogelschatz, Plasma Chemistry and Plasma Processing 23 (2003) 1.
[2] E. Wagnaars, Plasma Breakdown of Low-Pressure Gas Dis-charges, Ph. D Thesis Technische Universiteit Eindhoven, 2006.
[3] N. Gherardi, G. Gouda, E. Gat, A. Ricard and F. Massines, Plasma Sources Sci. Technol.9(2000) 340.
[4] Hasina Khatun, Alok Mishra, Mahesh Kumar, U.N. Pal, A.K. Sharma and P.K. Barhai, Indian Journal of Pure & Applied Phy. 46 (2008) 889.
[5] U.N. Pal, A.K.Sharma, J.S.Soni, Sonu Kr, H. Khatun, M. Ku-mar, B.L.Meena, M.S. Tyagi, B-J Lee, M. Iberler, J Jacoby and K. Frank, J. of Phys D: Appl. Phys 42 (2009) 45213. [6] U. Kogelschatz, IEEE Trans. On Plasma Sci.30(2002) 1400. [7] U. Kogelschatz, Plasma Sources Sci. Technol.11(2002) A1. [8] J. Rahel, M. SAra, P. Stahel and D. Trunec, Contrib. Plasma
Phys. 47(2007) 34.
[9] R.P. Mildren and R.J. Carman, J. Phys. D: Appl. Phys. 34 (2001) L1.
[10] S. Liu, Electrical modeling and unipolar-pulsed energization
of dielectric barrier discharge: Ph.D Thesis Electronics and Information Techniques (University of Karshuruhe), Germany (2002).
[11] R.J.Carman and R.P.Mildren, J. Phys. D: Appl. Phys. 36 (2003) 19.
[12] F. Iza and J.A. Hopwood, IEEE Trans. On Plasma Sci.32 (2004) 498.
[13] D.C.Tytet, Proc. Phys. Soc.80(1962) 560.
[14] G Herzberg, Molecular Spectra and Molecular Structure: I: Spectra of Diatomic Molecules, D. Van Nostrand company, INC., Princeton, New Jersey, New York, 1950.
[15] U. Kogelschatz, B Eliasson, Ozone generation and applica-tions, Handbook of Electrostatic Processes (J S Chang, A. J. Kelly, J. M. Crowley, eds), p.581. Marcel Dekker, New York (1995).
[16] P. Bletzinger and B.N. Ganguly, J. Phys. D: Appl. Phys.36 (2003) 1550.