Article
Printed in Brazil - ©2012 Sociedade Brasileira de Química0103 - 5053 $6.00+0.00
A
*e-mail: [email protected]
Photocatalytic Degradation of 1,4-Benzoquinone in Aqueous ZnO Dispersions
Yadollah Abdollahi,*,a Abdul H. Abdullah,a,b Umar I. Gaya,b Saeid Ahmadzadeh,b Azmi Zakaria,a,b
Kamyar Shameli,b Zulkarnain Zainal,a,b Hossein Jahangirianb and Nor Azah Yusofb
aAdvanced Materials and Nanotechnology Laboratory, Institute of Advanced Technology and
bDepartment of Chemistry, Faculty of Science,
Universiti Putra Malaysia, 43400 Serdang, Selangor D. E., Malaysia
O presente artigo relata a degradação UV-assistida de 1,4-benzoquinona em suspensões ZnO. As variáveis estudadas incluem a concentração de 1,4-benzoquinona, fotocatalisador, pH e carbono orgânico total. A concentração de 1,4-benzoquinona e o carbono orgânico residual foram medidos usando espectrofotômetro UV-Visível e analisador TOC, respectivamente. Os resultados mostraram que a fotodegradação da 1,4-benzoquinona foi independente do pH. A fotoatividade do ZnO foi máxima na concentração de 1,0 g L-1 e em níveis de 100 mg L-1 de 1,4-benzoquinona. Na faixa de pH 4-10 mais de 80% de 1,4-benzoquinona pode ser removida. ZnO demonstrou capacidade de reutilização no processo.
The present paper reports the UV-assisted degradation of 1,4-benzoquinone in ZnO suspensions. The variables studied include the concentration of 1,4-benzoquinone, photocatalyst, pH and the total organic carbon. The concentration of 1,4-benzoquinone and residue organic carbon were measured using UV-Visible spectrophotometer and TOC analyzer, respectively. The results showed that 1,4-benzoquinone photodegradation was independent of pH. The photoactivity of ZnO was maximum at 1.0 g L-1 concentration and at 100 mg L-1 1,4-benzoquinone levels. Within pH 4-10 more than 80% of 1,4-benzoquinone can be removed. ZnO has demonstrated reusability in the process.
Keywords: photocatalytic degradation, benzoquinone, mineralization, ZnO
Introduction
Photocatalysis is a subject of interest in view of its prosperous application in pollutant decontamination. Photocatalysis takes the advantage of the ability of semiconductor photocatalyst to generate surface bound hydroxyl radical and trapped hole upon excitation by band gap light. One important feature of these photogenerated species is that they are capable of degrading a wide variety of organic compounds owing to their oxidizing power.1-5
Among the several semiconductor photocatalysts used, TiO2
has been considered the most superior in terms of suitability for application.6,7 The current interest in ZnO is based on its
high spectral response in both UV and visible region which presumably, in some studies, resulted in higher efficiency of photocatalytic degradation well over TiO2.8-12 Based on the
aforementioned, ZnO photocatalysis has been proposed as an alternative in the removal of various aqueous pollutants including phenolic compounds.13-20
Even though benzoquinone has been reported as an intermediate of the degradation of aromatic compounds from different organic classes the case of 1,4-benzoquinone individually as potential pollutant has not yet been paid much attention.20-25 Sobczyński et al.,26 have investigated the
photodegradation of 1,4-benzoquinone in TiO2 suspensions.
Experimental
Chemicals and apparatus
High grade chemicals were used in the study, as received. These chemicals include zinc oxide (99%,
Merck) and 1,4-BQ (99%, ACROS). CH2Cl2 (99.95%)
was used for the extraction of intermediate products and the extracts were dried using Na2SO4. The ZnO
has a surface area of 3.3 m2 g-1 that measured by static
BET using Thermo Finnigan Sorptomatic 1990 Series analyzer. The particle size of ZnO recorded on Nanophox facility was 0.4-0.5 µm. Band gap measured using Perkin Elmer Lambda 35 UV-Vis-NIR was 3.02 eV. pH was adjusted using H2SO4 and NaOH. All preparations were
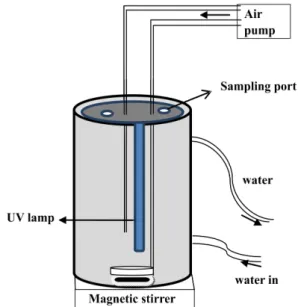
made using deionized water. Photocatalytic experiments were performed in a non-continuous mode (batch) reactor (Figure 1) fitted with 6W UV-A lamp. The pH of the experimental solution was determined using a pre-calibrated DELTO pH meter.
Methods
In all photocatalytic experiments, a mixture of known quantities of ZnO and 1,4-BQ was irradiated for 60 min. The mixture was magnetically stirred to maintain even distribution of suspension throughout the reactor. At specific time intervals, samples were withdrawn from the bulk solution and filtered through a 0.45 µm polytetrafluro-ethylene (PTFE) membrane. In order to compare the efficiency of the photocatalytic degradation of 1,4-BQ, the filtrates were analysed by UV-Vis spectrometry and Gas chromatography-Mass spectrometry (GC-MS). The
concentration of the unreacted 1,4-BQ was analyzed with UV-Vis spectrophotometer (Shimadzu, UV-1650pc) at the maximum absorption wavelength of 1,4-BQ (246 nm). Aromatic intermediates were identified by GC-MS using a Hewlett-Packard 5890 Series II gas chromatograph fitted with an Elite-5MS column (30 m × 0.25 mm × 0.25 µm) and a Hewlett-Packard 5989A mass spectrophotometer operating in EI mode at 70 eV. The column temperature was 40 °C (held for 1 min), then ramped at 10 °C min-1
to 240 °C (held for one min). The total organic carbon in the samples was determined using ANATOC series II total organic carbon analyzer. Parallel experiments were run at the same time and under the same conditions. The percentage photodegradation of 1,4-BQ was calculated using equation 1,
(1)
where Co = initial concentration of 1,4-BQ and
C = concentration of 1,4-BQ after photo-irradiation.
Results and Discussion
Preliminary studies
The photodegradation of 1,4-BQ was first investigated in the absence of ZnO. It was found that under such condition, the maximum loss of 1,4-BQ was 16%. Hence, 1,4-BQ is apparently fairly unstable under UV irradiation. In order to determine the effect of adsorption, the change in the concentration of 1,4-BQ in the presence of ZnO was monitored in the dark. The initial concentration of 1,4-BQ decreased by 10% due mainly to adsorption of 1,4-BQ onto the ZnO surface. In both studies, the starting concentration of 1,4-BQ was 100 mg L-1.
Effect of 1,4-BQ concentration
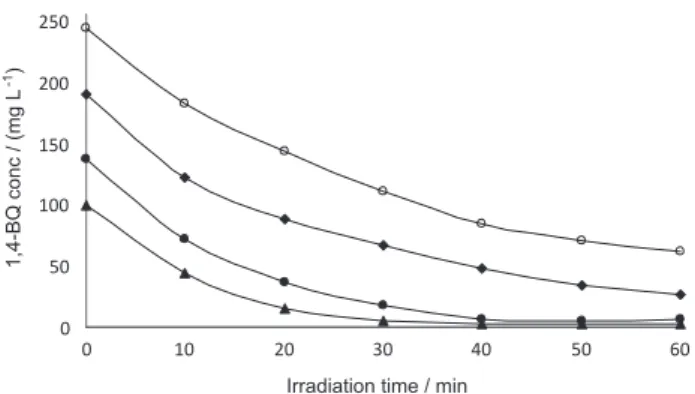
To determine the effect of substrate concentration, the photocatalytic degradation of 1,4-BQ at various initial concentrations (100-250 mg L-1) was studied for 60 min.
The degradation of 1,4-BQ at these concentrations is shown in Figure 2. It would be clearly seen that the amount of 1,4-BQ degraded starts decreasing as substrate concentration reaches 150 mg L-1. This decrease can be
attributed to reduced photo absorption by the catalyst probably as a result of excess 1,4-BQ in solution.13 Put
simply, the amount of 1,4-BQ attacked by h+ or •OH declines as the generation of the latter is limited by catalyst concentration and irradiation.27 Further phototoexperiments
Effect of photocatalyst loading
Series of experiments were carried out by varying the catalyst concentration from 0.5 g L-1 to 4.0 g L-1 so
as to observe the effect of the catalyst loading. Figure 3 shows photodegradation of 1,4-BQ in presence of different concentrations of ZnO over 60 min. From the figure, the percentage of 1,4-BQ degraded was enhanced by increasing the concentration of ZnO. This can be attributed to an increase in the effective surface of the photocatalyst, consequently enhancing hydroxyl radical formation. Maximum degradation (corresponding to about 100% degradation) of 1,4-BQ was observed at 1.0 g L-1
ZnO. There was decrease in photodegradation percentage at higher catalyst concentrations. This decrease in the efficiency as the optimum catalyst loading is exceeded (1.0 g L-1) may be attributed to the screening effect by
excess photocatalyst particles in the solution.28
Effect of pH
The effect of pH (4-10) on the photodegradation of 1,4-BQ was studied at optimum amount of ZnO and 1,4-BQ
as obtained from the previous experiments. Figure 4 shows the effect of pH on the photodegradation of 1,4-BQ. Although the maximum photodegradation was obtained at pH 9 (100%), it would be observed that the relative difference in the effect of pH on the 1,4-BQ photodegradation under the conditions of the study is insignificant. This is likely due to the fact that in alkaline solution (pH 8-9), •OH is easier to regenerate on the photocatalyst surface.13 However, the
amount of 1,4-BQ degraded decreased at pH 10, perhaps due to the presence of •OH radical scavengers,29 such as H
2O2
which can generate weaker oxidising species.
Photoproducts and mineralisation
GC-MS was used for the identification of 1,4-benzoquinone degradation intermediates. Our study of the degradation intermediates detected only hydroquinone as an intermediate. It is well known that benzoquinones form the brink of ring opening during the decomposition of aromatic compounds. The identification of hydroquinone does not contradict the usual order of formation of intermediates proposed by many authors (phenols, hydroquinones, benzoquinones, carboxylic acids then CO2 and H2O respectively), because
the formation of hydroquinone from benzoquinone is a reversible process.30,31
Mineralisation is the main aim of the photodegradation of 1,4-BQ and this can be followed by measuring the total organic carbon.32 Figure 5 shows the TOC and the total
inorganic carbon (TIC) concentrations during 1,4-BQ degradation. It would be seen that the amount of TOC steadily decreased with increasing irradiation time, which indicates the disappearance of 1,4-BQ intermediates. On the other hand, the TIC curve shows that the amount of total inorganic carbon was relatively constant. The presence of inorganic carbon is most likely due to the conversion of some organic carbon into inorganic carbon, such as carbonate ions. It can be concluded from Figure 5 that 84%
Figure 2. Effect of 1,4-BQ concentration on degradation efficiency, () 100 mg L-1, () 150 mg L-1, () 200 mg L-1, () 250 mg L-1, initial condition: ZnO = 1.0 g L-1, pH 7.55 and 25 oC.
Figure 3. Effect of photocatalyst concentration on the degradation of 1,4-BQ at 25 oC. [1,4-BQ] = 100 mg L-1, initial pH = 7.55. Legend:
= 0.5 g L-1, = 1.0 g L-1, = 2.0 g L-1, = 3.0 g L-1, = 4.0 g L-1.
organic carbon is removed from 1,4-BQ solution as CO2.
The residual TOC value (16%) would perhaps indicate the presence of unidentified photoproducts such as aliphatic carboxylic acids, at the end of the reaction.
Reusability of ZnO
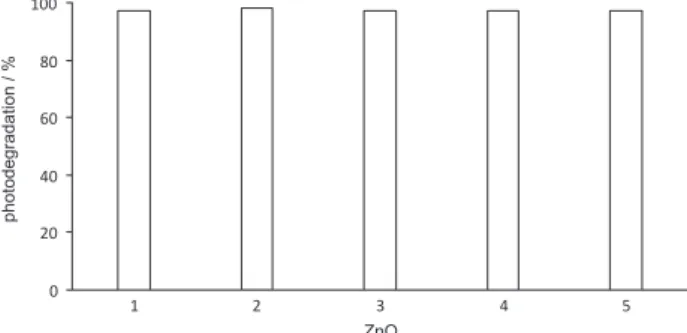
The reusability of ZnO photocatalyst for the 1,4-BQ degradation was studied at 100 mg L-1 levels of 1,4-BQ
and in presence of 1.0 g L-1 ZnO. Other experimental
conditions were maintained constant. ZnO was recovered from reactivity solutions by filtration through 0.45 µm PTFE. The ZnO residue was washed 4 times with distilled water and dried in an electric oven at 96 oC. The dry
ZnO was then reused 4 times in the degradation process. Figure 6 shows the stability of ZnO during the four cycles (photodegradation % = 97). Remarkable stability of the ZnO photocatalyst may be readily observed which indicates successful reuse of the photocatalyst.
Conclusions
The photocatalytic study of 1,4-BQ in aqueous ZnO reveals the following advances. First and foremost,
maximum photodestruction of 1,4-BQ can be achieved at room temperature, with the ZnO photocatalyst and 1,4-BQ concentration fixed at 1.0 g L-1 and 100 mg L-1, respectively.
It should be noted that 1,4-BQ is easily removed from solution. The main aromatic intermediate in the process is hydroquinone. Lastly, it may be concluded that ZnO is a good catalyst for the removal of quinones owing to its efficiency of destruction and reusability.
References
1. Fernández-Ibáñez, P.; Malato, S.; De Las Nieves, F.; Catal. Today 1999,54, 195.
2. Litter, M. I.; Appl. Catal., B1999,23, 89.
3. Schmelling, D. C.; Gray, K. A.; Water Res. 1995,29,2651. 4. Rathi, A.; Rajor, H. K.; Sharma, R. K.; J. Hazard. Mater. 2003,
102, 231.
5. Peiró, A. M.; Ayllón, J. A.; Peral, J.; Doménech, X.; Appl. Catal., B
2001, 30, 359.
6. Brezova, V.; Stasko, A.; J. Catal. 1994,147, 156. 7. Pardeshi, S. K.; Patil, A. B.; Solar Energy 2008,82, 700. 8. Mai, F.; Chen, C.; Chen, J.; Liu, S.; J. Chromatogr., A 2008,
1189, 355.
9. Lachheb, H.; Puzenat, E.; Houas, A.; Ksibi, M.; Elaloui, E.; Guillard, C.; Herrmann, J.-M.; Appl. Catal., B2002,39, 75. 10. Kandavelu, V.; Kastien, H.; Thampi, K. R.; Appl. Catal., B 2004,
48, 101.
11. Chen, C. C.; Lu, C. S.; Chung, Y. C.; J. Photochem. Photobiol., A 2006,181, 120.
12. Özgür, Ü.; Alivov, Y.; Liu, C.; Teke, A.; Reshchikov, M.; Do an, S.; Avrutin, V.; Cho, S.; Morkoc, H.; J. Appl. Phys. 2005,
98, 041301.
13. Konstantinou, I. K.; Albanis, T. A.; Appl. Catal., B2004,49, 1. 14. Akyol, A.; Yatmaz, H. C.; Bayramoglu, M.; Appl. Catal., B
2004,54, 19.
15. da Silva, C. G.; Faria, J. L.; J. Photochem. Photobiol., A2003, 155, 133.
16. Yu, D.; Cai, R.; Liu, Z.; Spectrochim. Acta, Part A 2004,60, 1617.
17. Akyol, A.; Bayramoglu, M.; J. Hazard. Mater. 2005,124, 241.
18. Height, M.; Pratsinis, S.; Mekasuwandumrong, O.; Praserthdam, P.; Appl. Catal., B 2006, 63, 305.
19. Mehrotra, K.; Yablonsky, G. S.; Ajay, K.; Ind. Eng. Chem. Res. 2003, 42, 2273.
20. Guillard, C.; Disdier, J.; Herrmann, J. M.; Lehaut, C.; Chopin, T.; Malato, S.; Blanco, J.; Catal. Today 1999, 54, 217.
21. Theurich, J.; Lindner, M.; Bahnemann, D. W.; Langmuir1996, 12, 6368.
22. Lipczynska-Kochany, E.; Kochany, J.; Bolton, J. R.; J. Photochem. Photobiol., A 1991, 62, 229.
Figure 5. Time course of TOC and TIC during photodegradation of 1,4-BQ, () TOC, () TIC. Initial conditions: 1,4-BQ concentration = 100 mg L-1, ZnO = 1.0 g L-1 and pH = 7.55.
23. Gaya, U. I.; Abdullah, A. H.; Zainal, Z.; Zobir, M.; Int. J. Chem.
2010,2, 180.
24. Durand, A. P. Y.; Brown, R. G.; Chemosphere1995, 31, 3595. 25. Al-Sayyed, G.; D’Oliviera, J. C.; Pichat, P.; J. Photochem.
Photobiol., A 1991, 58, 99.
26. Sobczyński, A.; Duczmal, L.; Dobosz, A.; Monatsh. Chem. 1999, 130, 377.
27. Gaya, U. I.; Abdullah, A. H.; J. Photochem. Photobiol., C2008, 9, 1.
28. Kansal, S. K.; Singh, M.; Sud, D.; J. Hazard. Mater.2008,153, 412.
29. Davis, A.; Huang, C.; Water Sci. Technol. 1989,21,455. 30. Flox, C.; Cabot, P. L.; Centellas, F.; Garrido, J. A.; Rodríguez,
R. M.; Arias, C.; Brillas, E.; Appl. Catal., B2007,75, 17. 31. Minisci, F.; Citterio, A.; Vismara, E.; Fontana, F.;
De Bernardinis, S.; Correale, M.; J. Org. Chem. 1989, 54, 728. 32. Heiland, G.; Mollwo, E.; Stöckmann, F.; Solid State Physics,
Frederick, S.; David, T., eds.; Academic Press: New York, 1959.
Submitted: July 23, 2011