ABSTRACT
Aim: To analyze the relationship between visceral obesity and urinary albumin excretion rate (UAER). Methods: A cross-sectional study of 73 normoalbuminuric (urinary albumin excretion rate < 20 µg/min) type 2 patients was performed. Patients were divided into two groups accord-ing to the median of UAER (7.5 µg/min). Office auscultatory blood pres-sure was meapres-sured in sitting position after a 10-min rest. Results:Waist to hip ratio was higher in the group with UAER > 7.0 µg/min (0.98 ± 0.08), when compared to the other group (0.93 ± 0.08, p= 0.01). Waist to hip ratio significantly correlated with UAER (r= 0.28; p= 0.018). In multiple lin-ear regression analysis, only waist to hip ratio was associated with UAER (r= 0.29; p= 0.04). A1c, DM duration and systolic BP levels were excluded from the model. Conclusions:Type 2 normoalbuminuric diabetic patients with higher levels of UAER could represent a group with an elevated risk for the development of cardiovascular diseases. (Arq Bras Endocrinol Metab 2006;50/3:466-471)
Keywords:Diabetes; Visceral obesity; Albuminuria; Waist-hip ratio
RESUMO
A Obesidade Visceral Está Associada com Níveis Elevados da Excreção Urinária de Albumina em Pacientes com Diabetes Tipo 2 Normoalbu-minúricos.
Objetivo:Analisar a relação entre obesidade e taxa de excreção urinária de albumina (TEUA). Métodos:Este é um estudo de corte de 73 pacientes com diabetes tipo 2 (DM) normoalbuminúricos (TEUA < 20 µg/min), que foram divididos em dois grupos de acordo com a mediana da TEUA (7,5 µg/min). A pressão sanguínea auscultatória foi medida em consultório com o paciente sentado, após repouso de 10min. Resultados:A relação cintura:quadril (RCQ) foi maior no grupo com TEUA > 7,0 µg/min (0,98 ± 0,08), em comparação com o outro grupo (0,93 ± 0,08, p= 0,01). A RCQ correlacionou-se significantemente com a TEUA (r= 0,28; p= 0,018). Na análise de regressão linear múltipla, somente a RCQ associou-se com a TEUA (r= 0,29; p= 0,04). A HbA1c, a duração do DM e os níveis da PA sistóli-ca foram excluídos do modelo. Conclusões: Pacientes com DM2 nor-moalbuminúricos com níveis mais elevados de TEUA podem representar um grupo com risco mais elevado para o desenvolvimento de doenças cardiovasculares. (Arq Bras Endocrinol Metab 2006;50/3:466-471)
Descritores:Diabetes; Obesidade visceral; Albuminúria; Relação cintura-quadril
artigo original
Normoalbuminuric Type 2 Diabetic Patients
Miriam Pecis
Lérida M.A. Zaslavsky
Fabrício B. Mallmann
Larissa Pante
Ana L.D. Krahe
Fernanda F. Stringhari
Luis H. Canani
Endocrinology Division, Hospital Independência, Universidade Luterana do Brasil (MP, LMAZ, FBM, LP, ALDK, FFS, LHC), and Endocrinology Division, Hospital de Clínicas de Porto Alegre (LHC), Porto Alegre, RS.
D
IABETES MELLITUS(DM) is a chronic degenerativedisease characterized by micro- and macrovascu-lar complications. It is also associated with a higher prevalence of systemic arterial hypertension, dyslipi-daemia and, consequently, cardiovascular diseases.
A great proportion of type 2 DM patients pre-sents features of metabolic syndrome which was described by Reaven in 1988 (1), defined as glucose intolerance, insulin resistance or hyperinsulinemia, hypertension, dyslipidaemia and atherosclerotic ma-crovascular disease. Posteriorly, microalbuminuria, hyperuricemia, hyperandrogenism, coagulability abnormalities and visceral obesity were aggregated to this group of metabolic disturbances (2-7). This hype-rinsulinemic state leads to an abnormal sodium reten-tion, greater sympathetic activity and disturbances of lipid profile and fibrinolisys leading to an increased risk for cardiovascular events (8-10).
Among the methods available to access the degree of visceral abdominal fat, computed tomogra-phy and magnetic resonance are the most accurate, but they are very expensive (11,12). Waist to-hip ratio (WHR) has the advantage over simple waist circum-ference measurement, since that method reveals the real fat distribution avoiding misclassification when analyzing obese patients without androgenic fat distri-bution (13).
Visceral obesity defined by the WHR > 0.85 for women and > 0.90 for men (14) and is associated with insulin resistance and hyperglycemia. It was already demonstrated that visceral fat accumulation is a major contributor for multiple risk factor clustering in patients with different degrees of glucose intolerance (15).
Visceral obesity could be related to renal dam-age and higher urinary albumin excretion rate (UAER) both in type 2 DM patients and also in non diabetic subjects (16-18). However, other authors failed to demonstrate such associations (19-21).
Since microalbuminuria and central obesity are strongly associated with cardiovascular diseases, the aim of this study was to analyze the relationship between visceral obesity and UAER in normoalbu-minuric type 2 diabetic patients.
PATIENTS AND METHODS
Subjects and methods
This study followed a cross-sectional design. All type 2 DM patients attending the endocrinology out-patient clinic of the Hospital Independência – Universidade Luterana do Brasil (a tertiary public care center) from
March 2003 to December 2003 were evaluated. Patients with BMI > 40 kg/m2, diabetic (micro- or
macroalbuminuria) or nondiabetic renal disease, can-cer, AIDS or heart failure class IV were excluded. Se-venty-three normoalbuminuric patients with type 2 DM were included. They were classified as having type 2 DM using World Health Organization (WHO) diagnostic criteria (22). They were divided in two groups according to the median of UAER – 7.5 µg/min. Ethnicity was self-reported. Informed con-sent was obtained from each patient, and the protocol was approved by the Research Ethics Committee of the hospital.
Anthropometric measurements were taken in a standing position after subjects removed their heavy clothes. WHR was measured by the author twice and the mean value was used for analysis. Waist and hip cir-cumferences were measured on bare skin at the level of the umbilicus and iliac crest during mid-respiration to the nearest 0.5 cm. The WHR was defined according to the average of two duplicate measurements. Office auscultatory blood pressure (BP) was measured twice in sitting position after a 10-min rest, with a standard 12.5 cm cuff mercury sphygmomanometer (phases I-V), and the mean BP value was used. The presence of diabetic retinopathy was assessed by an ophthalmolo-gist using fundoscopic examination after mydriasis.
Laboratory methods
UAER was determined by radioimmunoassay (DPC, Los Angeles, CA) in 24-h sterile specimens. Patients were classified as normoalbuminuric if at least two measurements at 6-months interval were < 20 mg/min in the absence of angiotensin converting enzyme (ACE) inhibitors for at least two weeks. Glu-cose was measured by the gluGlu-cose-oxidase method, A1c by chromatography method (HPLC,
L9100-Hitachi; normal range: 4.3–6.0%), serum creatinine, total and HDL cholesterol and triglycerides by an enzymatic colorimetric method.
Statistical analysis
systolic BP as independent variables. Data were expressed as means ± SD, except for the UAER and triglycerides that were log transformed for analysis and were expressed as median and range. P< 0.05 was con-sidered significant.
RESULTS
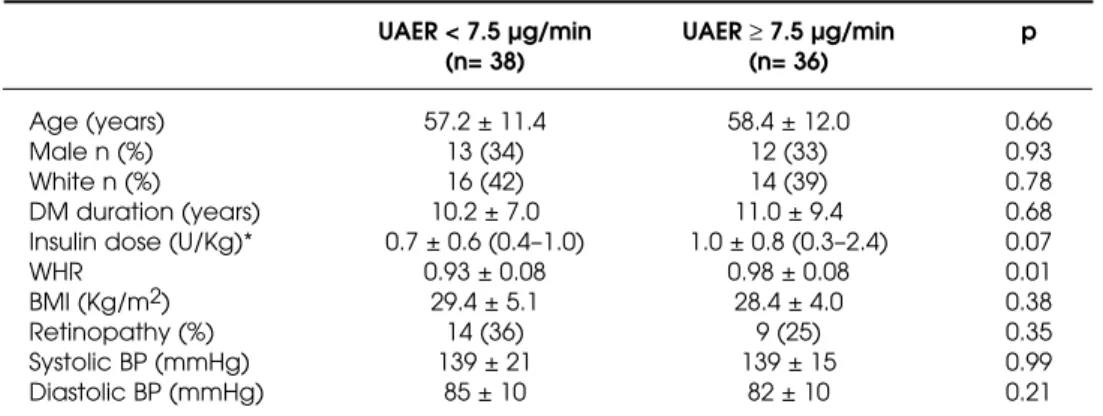
Clinical characteristics of the two groups of type 2 DM patients are shown in table 1. The WHR was higher in the group of patients with UAER ≥ 7.5 µg/min (p= 0.01). No difference was observed when comparing age, sex, ethnicity, DM duration, BMI, prevalence of retinopathy and BP (P > 0.05). Thirty-two patients (89%) were in use of ACE inhibitors in the group of patients with UAER < 7.5 µg/min. In the other group, 11 patients (46%) were in use of ACE inhibitors. Patients with higher levels of UAER were in use of higher insulin dose, although the difference did not reach statistical level of significance (p= 0.07). Laboratory features (table 2) were comparable between the two groups of patients (p > 0.05).
There was a significant correlation (Pearson’s test) of WHR and UAER levels (r= 0.28; p= 0.01, fi-gure 1). A multiple linear regression analysis was per-formed with UAER as the dependent variable and WHR, A1c, DM duration and systolic BP as
indepen-dent variables. Only WHR was associated with UAER variation (r= 0.29; p= 0.04). A1c, DM duration and
systolic BP were excluded from the model.
DISCUSSION
In this study, type 2 normoalbuminuric diabetic pa-tients with UAER levels greater than the median (7.5
µg/min) presented higher WHR when compared to the patients of the other group. WHR was responsible for approximately 30% of UAER variation. As far as we know, this is the first time that levels of UAER under the conventional limit for microalbuminuria were associated with visceral obesity, an important feature of insulin resistance.
The association of WHR and UAER levels was already expected. However, the relationship of these two measurements in patients with normal levels of UAER is not yet clear. The World Health Organiza-tion included microalbuminuria and visceral obesity in the definition of metabolic syndrome (7), and these components showed 99% specificity and 93% sensitivi-ty, respectively for the diagnosis of this syndrome (23). In fact, there is a possible link between elevated viscer-al fat and glomerular vascular lesion. Adipose tissue is an endocrine organ, which secretes cytokines implicat-ed in the vascular and systemic inflammatory process. These adipokines are elevated in obese subjects and lead to a lower insulin receptor phosphorilation lead-ing to insulin resistance and vascular inflammatory abnormalities with elevation of vasoconstrictor sub-stances (24-27).
Centrally obese non-diabetic patients presented a relative risk of abnormal UAER of 18 times greater than controls (17), and this association was also demonstrat-ed in diabetic patients with metabolic syndrome, who presented a relative risk of 3.99 for the development of albuminuria (16). Even in lean patients with a central body fat distribution, renal impairment was already demonstrated (18), reinforcing the importance of vis-ceral obesity and not obesity per se in the genesis and maintenance of this metabolic disturbance.
Other authors (19) did not observe any differ-ence in insulin-stimulated glucose uptake when normo- and microalbuminuric type 2 DM patients
Table 1. Clinical characteristics of type 2 DM patients.
UAER < 7.5 µg/min UAER ≥7.5 µg/min p
(n= 38) (n= 36)
Age (years) 57.2 ± 11.4 58.4 ± 12.0 0.66
Male n (%) 13 (34) 12 (33) 0.93
White n (%) 16 (42) 14 (39) 0.78
DM duration (years) 10.2 ± 7.0 11.0 ± 9.4 0.68
Insulin dose (U/Kg)* 0.7 ± 0.6 (0.4–1.0) 1.0 ± 0.8 (0.3–2.4) 0.07
WHR 0.93 ± 0.08 0.98 ± 0.08 0.01
BMI (Kg/m2) 29.4 ± 5.1 28.4 ± 4.0 0.38
Retinopathy (%) 14 (36) 9 (25) 0.35
Systolic BP (mmHg) 139 ± 21 139 ± 15 0.99
Diastolic BP (mmHg) 85 ± 10 82 ± 10 0.21
were compared. However, DM duration of the nor-moalbuminuric group (9.1 ± 4.6 years) was similar to the duration of the disease of the patients with higher levels of UAER in our study (9.1 ± 5.7 years). Fur-thermore, the levels of UAER of the normoalbumin-uric patients of that study were higher than the levels of the patients with UAER lower than median (geo-metric mean= 4.8 x/÷1.6 µg/min vs. 1.84 x/÷ 1.1 mg/min, respectively). It can be hypothesized that the normoalbuminuric group of the study of Nielsen and cols. (19) presented clinical characteristics comparable to our patients with higher levels of UAER and possi-bly had a greater degree of insulin resistance. Another study (20) did not demonstrate any relationship between UAER and WHR. However the subjects ana-lyzed were healthy individuals with normal glucose tolerance. Recently, other authors also did not observe a higher prevalence of microalbuminuria when glucose intolerant patients were compared to controls (21),
but a multivariate analysis was not performed in order to analyze the possible factors related to UAER varia-tion, which could probably reveal this association.
We did not observe any difference in other con-ventional risk factors for cardiovascular disease such as BP and lipid values when the two groups of patients were compared. Also, these parameters were not asso-ciated with WHR. These findings could be explained by the number of patients analyzed. Another explana-tion is the fact that, unlike UAER, variables such BP and lipid profile are more exposed to different factors (i.e. diet), which could hide a possible difference between the two groups of patients.
Some authors suggest that waist circumference is strongly linked to cardiovascular disease risk factors and is more related with visceral obesity assessed by comput-ed tomography and magnetic resonance (11,12), which are very expensive and could not be applied in routine clinical care. WHR has the advantage over simple waist circumference measurement, since that method reveals the real fat distribution avoiding misclassification when analyzing obese patients without androgenic fat distrib-ution. A cross-sectional study involving nineteen popu-lations observed that, when comparing WHR and abdominal circumference, the former is better to analyze visceral obesity. The measurement of abdominal circum-ference reflects mainly the degree of overweight (13).
Microalbuminuria is a risk factor for cardiovas-cular disease (28), which is the leading cause for mor-tality in type 2 diabetic patients (29). Higher levels of UAER, even within the normal range, were associated with diabetic nephropathy, diabetic retinopathy and hemodinamic abnormalities (30-34) and UAER levels greater than 10 µg/min were considered a risk factor for the development of diabetic nephropathy in type 2 diabetic patients (35). Recently, another study (36) observed that UAER values over 4.8 µg/min were strongly determinant of coronary heart disease and death in general population.
Table 2. Laboratory features of type 2 DM patients.
UAER < 7.5 µg/min UAER ≥7.5 µg/min P
(n= 36) (n= 37)
Fasting Plasma Glucose (mmol/L) 8.96 ± 3.47 9.67 ± 3.8 0.41 A1c (%) 7.9 ± 6.5 (3.8–12.2) 7.7 ± 2.0 (4.8–12.4) 0.86 Total Cholesterol (mmol/L) 5.59 ± 1.12 5.19 ± 1.14 0.14
HDL Cholesterol (mmol/L) 1.26 ± 0.35 1.27 ± 0.34 0.90
Triglycerides (mmol/l)* 3.5 (1.2–7.7) 4.1 (1.5–24.5) 0.10 Serum Creatinine (mmol/L) 75.14 ± 23.0 78.68 ± 20.33 0.49
UAER (µg/min)* 2.30 (0.23–3.95) 9.35 (4.66–16.93) –
* Data are means ± SD or median (range). UAER= urinary albumin excretion rate.
In conclusion, type 2 diabetic patients with higher levels of UAER even within the conventional normal range, present more visceral obesity than patients with lower levels. UAER values under the standard limit for microalbuminuria (20 µg/min) could be associated with insulin resistance and might be predictive for future development of diabetic nephropathy and cardiovascular disease.
REFERENCES
1. Reaven GM. Role of insulin resistance in human disease.
Diabetes 1988;37:1595-7.
2. DeFronzo RA, Ferranini E. Insulin resistance. A multifac-eted syndrome responsible for NIDDM, obesity, hyper-tension, dyslipidemia and atherosclerotic cardiovascu-lar disease. Diabetes Care 1991;14:173-94.
3. Bjorntorp P. Abdominal obesity and metabolic syn-drome. Ann Med 1994;24:465-8.
4. Groop L, Ekstrand A, Forsblom C, Widen F, Groop PH, Teppo AM, et al. Insulin resistance, hypertension and mi-croalbuminuria in patients with type II (non-insulin-depen-dent) diabetes mellitus. Diabetologia 1993; 36:642-7.
5. Yudkin JS. Abnormalities in coagulation and fibrinolysis in insulin resistance. Evidence for a common antecedent?
Diabetes Care 1999;22(suppl 3):C25-30.
6. Reaven GM, Chen Y-DI, Jeppesen J, Maheux P, Krauss RM. Insulin resistance and hyperinsulinemia in individuals with small, dense, low density lipoprotein particles. J Clin Invest 1993;92:141-6.
7. Alberti KGMM, Zimmet PZ; for the WHO consultation. Definition, diagnosis and classification of diabetes melli-tus and its complications. Diabet Med 1998;15:539-53.
8. Reaven GM. Role of insulin resistance in human disease (syndrome X): an expanded definition. Ann Rev Med 1993;44:121-31.
9. Kaplan NM. The deadly quartet: upper-body obesity, glucose intolerance, hypertriglyceridemia, and hyper-tension. Arch Intern Med 1989;149:1514-20.
10. Bjorntorp P. The associations between obesity, adipose tissue distribution and disease. Acta Med Scand 1990;723(suppl.):121-34.
11. Pi-Sunyer FX. Obesity: criteria and classification. Proc Nutr Soc 2000;59:505-9.
12. Zhu S, Wang Z, Heshka S, Heo M, Faith M, Heymsfield SB. Waist circumference and obesity-associated risk factors among whites in the third National Health and Nutrition Examination Survey: clinical action thresholds. Am J Clin Nutr 2002;76:743-9.
13. Molarius A, Seidell JC, Sans S, Tuomilehto J, Kuulasmaa K. Waist and hip circumferences and waist-hip ration in 19 populations of the WHO MONICA Project. Int J Obes Relat Metab Disord 1999;23:116-25.
14. Tichet J, Vol S, Balkau B, Le Clesiau H, D’Hour A. Android fat distribution by age and sex. The wais hip ratio. Dia-bete Metab 1993;19:273-6.
15. Nagaretani H, Nakamura T, Funahashi T, Kotani K, Miyanaga K, Takahashi M, et al. Visceral fat is a major contributor for multiple risk factor clustering in Japanese men with impaired glucose tolerance. Diabetes Care 2001;24:2127-33.
16. Isomaa B, Henricsoon M, Almgren P, Tuomi T, Taskinen M-R, Gropp L. The metabolic syndrome influences the risk of chronic complication in patients with type II diabetes.
Diabetologia 2001;44:1148-54.
17. Mulyadi L, Stevens C, Munro S, Lingard J, Bermingham M. Body fat distribution and total body fat as risk factors for microalbuminuria in the obese. Ann Nutr Metab 2001;45:67-71.
18. Pinto-Sietsma SJ, Navis G, Janssen WM, de Zeeuw D, Gans RO, de Jong PE; PREVEND Study Group. A central body fat distribution is related to renal function impair-ment, even in lean subjects. Am J Kidney Dis 2003;41:733-41.
19. Nielsen S, Schmitz O, Orskov H, Mogensen CE. Similar insulin sensitivity in NIDDM patients with normo- and microalbuminuria. Diabetes Care 1995;18:834-42.
20. Hoffman IS, Jimenez E, Cubeddu LX. Urinary albumin excretion in lean, overweight and obese glucose tole-rant individuals: its relationship with dyslipidaemia, hyperinsulinaemia and blood pressure. J Hum Hypertens 2001;15:406-12.
21. Cruz NS, Sartori MS, Santos ML, Aragon FF, Padovani CR, Pimenta WP. Avaliação quanto à presença de microal-buminúria e hiperfiltração glomerular no estágio de to-lerância à glicose diminuída. Arq Bras Endocrinol Metab 2003;47/2:158-65.
22. World Health Organization. Diabetes Mellitus: Report of a WHO Study Group. Geneva, World Health Org., 1985
(Tech. Rep. Ser., nº727).
23. Marchesini G, Forlani G, Cerrelli F, Manini R, Natale S, Baraldi L, et al. WHO and ATPIII proposals for the defini-tion of the metabolic syndrome in patients with type 2 diabetes. Diabet Med 2004;21:383-7.
24. Hsueh WA, Law RE. Cardiovascular risk continuum: Impli-cations of insulin resistance and diabetes. Am J Med 1998;105:4S-14S.
25. Lyon CJ, Kaw RE, Hsueh WA. Minireview: Adiposity, inflammation and atherogenesis. Endocrinology 2003;144:2195-200.
26. Okamoto Y, Kihara S, Ouchi N, Nishida M, Arita Y, Kuma-da M, et al. Adiponectin reduces atherosclerosis in apolipoprotein E-deficient mice. Circulation 2002;106:2767-70.
27. Van Der Meer IM, De Maat MP, Hak AE, Kiliaan AJ, Del Sol AI, Van Der Kuip DA, et al. C-reactive protein pre-dicts progression of atherosclerosis measured at various sites in the arterial tree: the Rotterdam Study. Stroke 2002;33:2750-5.
28. Valmadrid CT, Klein R, Moss S, Klein BEK. The risk of car-diovascular disease mortality associated with microal-buminuria and gross proteinuria in persons with older-onset diabetes mellitus. Arch Intern Med 2000 ;160:1093-100.
30. Schmitz A, Vaeth M, Mogensen CE. Systolic blood pres-sure relates to the rate of progression of microalbumin-uria in NIDDM. Diabetologia 1994;37:1251-8.
31. Gilbert RE, Tsalamandris C, Bach LA, Panagiotopoulos S, O’Brien RC, Allen TJ, et al. Long-term glycemic control and the rate of progression of early diabetic kidney dis-ease. Kidney Int 1993;44:855-9.
32. Microalbuminuria Collaborative Study Group, United Kingdom. Intensive therapy and progression to clinical albuminuria in patients with insulin-dependent diabetes mellitus and microalbuminuria. BMJ 1995;31:973-7.
33. Mathiesen ER, Ronn B, Storm B, Foght H, Deckert T. The natural course of microalbuminuria in insulin-dependent diabetes: a 10-year prospective study. Diabetic Med 1995;12:482-7.
34. Pecis M, Azevedo MJ, Moraes RS, Ferlin EL, Gross JL. Autonomic dysfunction and urinary albumin excretion rate are associated with an abnormal blood pressure pattern in normotensive normoalbuminuric type 1 dia-betic patients. Diabetes Care 2000;23:989-93.
35. Murussi M, Baglio P, Gross JL, Silveiro SP. Risk factors for microalbuminuria and macroalbuminuria in type 2 dia-betic patients. Diabetes Care 2002;25:1101-3.
36. Klausen K, Borch-Johnsen K, Feldt-Rasmussen B, Jensen G, Clausen P, Scharling H, et al. Very low levels of microalbuminuria are associated with increased risk of coronary heart disease and death independently of renal function, hypertension, and diabetes. Circulation 2004;110:32-5.
Endereço para correspondência:
Miriam Pecis Av. Taquara 386/401 90460-210 Porto Alegre, RS Fax: (51) 3388-3130