0103 - 5053 $6.00+0.00
Article
* e-mail: [email protected]
Study of the Particulate Matter Emitted from Residual Oil Combustion and
Natural Gas Reburning
Celso A. Bertran* and Carla S. T. Marques
Instituto de Química, Universidade Estadual de Campinas, CP 6154, 13084-971 Campinas - SP, Brazil
Neste trabalho, realizou-se o estudo dos materiais particulados emitidos na combustão de óleo residual do tipo 4B e na requeima de gás natural aplicada à combustão deste óleo numa fornalha em escala piloto. Os tamanhos, as morfologias e a distribuição dos elementos inorgânicos nas partículas foram analisados por microscopia eletrônica de varredura acoplado a um espectrômetro de energia dispersiva de raio-X (EDS). Foram observados três tipos de partículas: cenosferas esféricas, compactas e lisas de 0,6 a 1,5 Pm; cenosferas com poucos poros de aproximadamente 10-20 Pm e cenosferas porosas na faixa de 20-50 Pm. O particulado emitido na combustão de óleo residual apresenta predominantemente as pequenas cenosferas compactas e lisas, enquanto que o emitido no processo de requeima mostra preferencialmente as cenosferas maiores e porosas. As microanálises de EDS mostraram principalmente Al e Si nas partículas menores e S e V nas cenosferas com poucos poros e nas cenosferas porosas e maiores.
In this work, a study of the particulate matter emitted from standard residual oil combustion and from natural gas reburning during oil combustion in a pilot scale furnace was carried out. The sizes, morphologies and chemical element distribution of particles were analyzed through scanning electron microscopy coupled to an X-ray energy dispersive spectrometer (EDS). The microscopy results show three sorts of particles: spherical, very compact and smooth cenospheres with sizes of 0.6-1.5 Pm; cenospheres with a few pores with sizes of 10-20 Pm and larger porous cenospheres with sizes of 20-50 Pm. The particulate emitted from standard oil combustion shows predominantly spherical and very compact small cenospheres, with a smooth surface, while those emitted from the reburning process present a majority of larger porous cenospheres. The EDS microanalysis showed mainly Al and Si in the smaller cenospheres and mostly S and V in the cenospheres with a few pores and in the larger porous cenospheres.
Keywords: particulate matter, residual oil combustion, natural gas reburning
Introduction
Heavy fuel oils have been applied widely throughout the whole world to generate energy (as heat in internal combustion engines, boilers and industrial furnaces). Although combustion of residual fuel oils is low cost and shows high efficiency (if properly manipulated), the pollutant emission levels, mainly of particulate matter, are usually larger from such heavy combustion processes.
The particulate matter from oil combustion consists of two types of particle groups: soot and cenospheres.1 It well
known that the cenospheres represent ca. 95% of the mass of the particulate matter emitted from residual oil combustion.2
Soot particles are produced in the combustion gas phase through a hydrogen-abstraction / carbon-addition mechanism (HACA mechanism), where C2H2 is the main C-species added to a surface radical site created by hydrogen abstraction.3 Soot is constituted of spherical
shaped particles with diameters generally of 10-50 nm and chainlike aggregates of these spherical units.4 We have
seen primary soot particles of 60-150 nm and aggregates of several tens of micrometers for C2H2 combustion.5
Toussait and Peyrot1 believe that soot particles could reach
up to 500 nm in fuel oil pyrolysis.
the contact of oxygen molecules with the oil droplet and allowing a very fast pyrolysis of fuel oil with local formation of solid residues (cenospheres). The solid particles accumulate on the surface of the droplets and may form a film permeable to volatile species undergoing vaporization.6,7 The cenospheres produced are then
oxidized by a heterogeneous surface reaction, whose oxidation rate is limited by the oxygen supply.7
Cenospheres are normally hollow ovoid and/or spherical particles with a large range of diameters, 1-100 Pm.1,7
Studies of particulate formation have attempted to establish a relationship between the asphaltene or Conradson Carbon Residue content of fuel oil and particulate mass.6,8-10 They suggest a trend, but they cannot
suitably represent the particulate emission from a wide range of fuel oils.6,11
Taylor and Burgess11 reported that a correlation is only
possible if additional parameters are taken into account, such as metal concentrations, coke burning, combustion temperatureetc. On the other hand, Bomo et al.12 showed
that the cenospheres yield is dependent on the molecular structure of asphaltenes instead of the asphaltene levels.
There are some works focused on cenosphere formation and its control parameters, like initial droplet diameter of the fuel oil, temperature, residence time, metal concentrations, additives etc.1,2,6,7,11-16 The greater part of
these studies were executed in isolated droplet combustion systems and cenosphere production was analyzed through morphology and mass yield.
In this work, a study of particulate matter emitted from residual oil combustion and natural gas reburning in a pilot scale furnace was carried out.
Natural gas reburning applied to heavy oil combustion is an efficient technology recognized for NOx emission reduction.17-19 In the reburning process, part of the power
produced by oil combustion is replaced by injection of reburning fuel (usually natural gas) in a subsequent region, creating a slightly fuel-rich so-called reburning zone. In this reaction zone, the CHx radicals produced react with NOx, forming other nitrogen species, which are oxidized in the burnout zone with excess of air.19,20
The particulates emitted from reburning processes due to the fuel-rich condition are an effect of this technology, which is of concern, but which has received little attention in the literature. This fact motivated our present study on particulate matter. The sizes and morphologies of the particles emitted from standard residual oil combustion and from natural gas reburning were evaluated by scanning electron microscopy. The inorganic elements present in the particulates were identified and mapped through X-ray energy dispersive microanalysis.
Experimental
Fuel oil characteristics
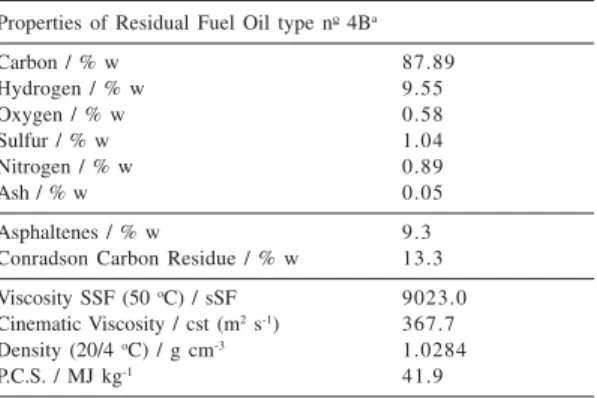
The particulate matter is strongly dependent on the chemical and physical properties, combustion conditions (such as atomization, combustion air, temperature etc.) and the oxidation processes of the fuel oil. In Brazil, the industrial combustion devices are usually operated with heavy fuel oils having higher viscosities and higher levels of nitrogen, ash, carbon residue and asphaltene than in other countries. Table 1 shows the properties of a typical Brazilian residual fuel oil used in the combustion experiments.
Particulate collection
The particulate matter was collected in the chimney from a pilot scale furnace of the Laboratory of Combustion and Gasification of the Institute of Technological Research of São Paulo State (LCG/IPT) using method no 5, approved
by the U.S. Environmental Protection Agency (EPA).21 This
experimental technique is also the gravimetric standard method usually applied for determination of particulate emission from stationary sources in Brazil and accepted by Brazilian environmental regulation agencies.
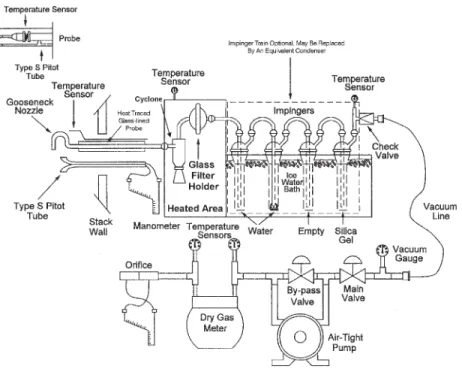
An experimental diagram for particulate sampling collection through this methodology is presented in Figure 1. The gas in the chimney was sampled isokinetically by a heated probe; that is the inlet gas and the duct flue gas have the same velocity. The velocity of inlet gas was constantly monitored through the type S Pitot tube connected to the probe. The isokinetic sampling rate was kept constant by adjusting the probe suction flow. For a validated particulate
Table 1. Properties of residual fuel oil type no 4B used in the com-bustion experiments
Properties of Residual Fuel Oil type no 4Ba
Carbon / % w 87.89
Hydrogen / % w 9.55
Oxygen / % w 0.58
Sulfur / % w 1.04
Nitrogen / % w 0.89
Ash / % w 0.05
Asphaltenes / % w 9.3
Conradson Carbon Residue / % w 13.3
Viscosity SSF (50 oC) / sSF 9023.0 Cinematic Viscosity / cst (m2 s-1) 367.7 Density (20/4 oC) / g cm-3 1.0284
P.C.S. / MJ kg-1 41.9
sampling the isokinetic rate must be maintained between 90 and 110%.21 The gas sampled passed through the
preweighed glass fiber filter, where the particulates were deposited. The filter was placed and held in a heated chamber at 120±10 oC. Both probe and filter were kept heated to
prevent gas condensation. The condensable components (usually water vapor) were trapped in the impinger train. Particulates deposited on filter and recovered from the line and probe by washing were weighed. Each particulate collection was carried out for about 1 h.
Particulates emitted from standard heavy fuel oil (type no 4B) combustion at ca. 1 MW power with 2% O
2 excess
in the flue gases (O1 = 1.10) and from the reburning process
applied to this oil combustion with 12.5% of power replaced by natural gas (O1 = 1.10 and O2 = 0.80) in a subsequent
region (2.8 m from oil combustion), were sampled. After the reburning zone, air excess was added (3.8 m from oil combustion). The combustion air was pre-heated and the fuel oil was atomized by water vapor.
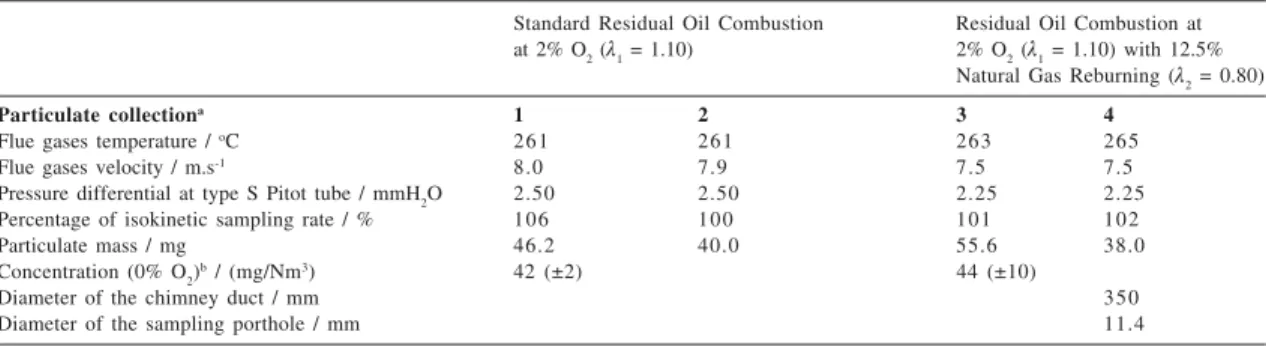
Table 2 shows the particulate sampling conditions and the particulate mass and concentration results for each combustion process.
Particulate microanalysis
The morphology and size of the particles and the collected aggregates were analyzed by scanning electron microscopy (SEM) using a JEOL type T300 microscope.
The chemical element distribution (inorganic elements) in the particulates was determined through the spectra and mapping of X-ray energy dispersive coupled to the JEOL microscope. The range of measurement of chemical elements in the JEOL microscope is in the range of 1.04-10 keV. Thus, only the chemical elements above Na X-ray fluorescence are detected (above 1.04 keV).
Samples of particulate matter collections emitted from both combustion processes, standard residual oil combustion and natural gas reburning on residual oil combustion, were prepared for microscopic analysis. Particulates collected on two glass fiber filters for each process were microanalyzed. Particulate samples of particles and aggregates from the center and border of the collection filters were placed on a conducting carbon adhesive tape fixed to a carbon sample holder and afterwards were covered with carbon film for microanalysis. Several microregions of particulate samples were analyzed by SEM and the micrographs presented in this work suitably represent the morphology and sizes of particles and aggregates of all the samples taken. The particle diameters were determined through a measurement tool of the Semafore software coupled to the microscope and by using the scale bar placed in the micrographs. Most of the particles on the micrographs taken were measured and evaluated.
Many X-ray energy dispersive (EDS) spectra on different micrographs were obtained in order to determine the main
elements in the particulate samples. The chemical element distributions in different kinds of particles were distinguished through EDS mappings. The EDS mappings were made selecting the detector range only in the energy interval corresponding to the EDS spectra peaks of the each element.
Results and Discussion
The glass fiber filters covered with particulate matter emitted from residual oil combustion without and with natural gas reburning were predominantly yellow with a few black particles.
Table 2 presents the particulate mass in the collection filters used for microanalysis and the mean particulate concentration for each combustion process studied. The data in Table 2 show that the natural gas reburning process has little influence on particulate concentration. Although natural gas combustion after residual oil combustion is fuel-rich (O < 1.0), it produced only a few soot particles (since methane is the main fuel of natural gas) from the reburning process and their contribution to the total mass of particulates is negligible. Thus, the particulate matter collected from both combustion processes studied (Table 2) should be predominantly related to oil combustion with respect to size, morphology and chemical element distribution of the particles.
Figures 2 and 3 present micrographs taken with particulates from standard residual oil combustion and residual oil combustion with natural gas reburning. The micrographs in Figure 2 show characteristic particles of particulate matter collected for each process and the micrographs in Figure 3 show the sizes and morphologies of some preponderant particles in detail.
In all particulate samples analyzed by scanning electron microscopy (SEM) and for both combustion
processes studied – residual oil combustion (O1 = 1.10)
and natural gas reburning (O2 = 0.80) on residual oil
combustion (O1 = 1.10) – the same sort of particles were
observed: 1) cenospheres called beads,2 which are very
spherical, compact and smooth particles with smaller diameters; 2) cenospheres approximately spherical in shape with a few exposed pores and intermediate diameters; 3) typical cenosphere particles (hollow spheres like sponges),
Table 2. Particulate sampling conditions and particulate mass and concentration results for collections from standard residual fuel oil combustion and residual oil combustion with natural gas reburning
Standard Residual Oil Combustion Residual Oil Combustion at at 2% O2 (O1 = 1.10) 2% O2 (O1 = 1.10) with 12.5%
Natural Gas Reburning (O2 = 0.80)
Particulate collectiona 1 2 3 4
Flue gases temperature / oC 261 261 263 265
Flue gases velocity / m.s-1 8.0 7.9 7.5 7.5
Pressure differential at type S Pitot tube / mmH2O 2.50 2.50 2.25 2.25
Percentage of isokinetic sampling rate / % 106 100 101 102
Particulate mass / mg 46.2 40.0 55.6 38.0
Concentration (0% O2)
b / (mg/Nm3) 42 (±2) 44 (±10)
Diameter of the chimney duct / mm 350
Diameter of the sampling porthole / mm 11.4
aData provided from Laboratory of Combustion and Gasification of Institute of Technological Research of São Paulo State (LCG/IPT);bMean concentration of three particulate sample collections.
a)
b)
that are ovoid or spherical in shape, with several pores irregularly distributed on their surface and having larger particle diameters. However, each combustion process shows different particulate features as to the preponderance of the different types of particles.
For residual oil combustion (without the reburning process) in a pilot scale furnace, the particulate matter produced is mainly constituted of fine material spread on the sample holder surface as shown in the micrograph of Figure 2a. These particles are solid non-porous cenospheres called “beads”, they form aggregates and are very spherical, compact, smaller and with a smooth surface, as can be observed in the micrograph of Figure 3a.
The majority of the “bead” particles have diameters in the range of 0.6-1.5 Pm, but this type of solid non-porous cenospheres with larger diameters, around 2-5 Pm, were also observed. Most aggregates are formed by smaller “bead” particles than the predominant ones, which have sizes of 0.3-1 Pm.
For natural gas reburning on residual oil combustion in a pilot scale furnace, the particulate matter is composed essentially by porous cenospheres (like sponges) with larger diameters and cenospheres with a few pores and
intermediate diameters, as shown in the micrograph of Figure 1b. These particles have diameters between 10-90Pm. The greater part of them is porous cenospheres, which have principally sizes of 20-50 Pm. The micrograph in Figure 2b shows in detail the larger porous cenospheres typically found in the particulate collected from natural gas reburning on residual oil combustion and the cenospheres with a few pores, usually having smaller sizes, around 10-20 Pm.
The morphology of particulates is strongly dependent on the formation process of the particle, instead of particle oxidation that is more associated with mass reduction. Since the fuel oil and the O2 level (2% O2 excess) in the zone of particle formation is the same for both combustion processes, the morphology should be related to the different combustion environment in standard residual oil combustion and natural gas reburning applied to oil combustion.
Hence, the different morphologies of particles: “bead” cenospheres with smaller sizes found predominantly in the particulate from standard oil combustion and larger porous cenospheres mainly present in the particulate from natural gas reburning on oil combustion, can be related to the dissimilar residence times and thermal conditions for heavy oil droplet vaporization, pyrolysis and combustion that lead to the formation of particles and their characteristics.
before the total evaporation of the lighter components, the droplet will swell because of still holding volatiles and, as a consequence, the larger and porous cenospheres are formed, such as those presented in the micrograph of Figure 3b.
To determine the inorganic element distribution of particulates, several EDS spectra for different microscopic regions of the samples were taken. Figure 4 shows the characteristic EDS spectra for particulates collected from standard residual oil combustion for the microscopic region of the micrograph presented in Figure 2a and Figure 5 shows the characteristic EDS spectra for particulates collected from natural gas reburning on residual oil combustion for the microscopic region of the micrograph presented in Figure 2b.
For both combustion processes the same elements were observed: Al, Si, S, K, Ca, V, Cr, Fe and Ni, of which Al, Si, S and V are in the highest abundance, as shown in the spectra of Figures 4 and 5. The difference between the elemental EDS microanalysis of the two kinds of particulate matter collected – from standard oil combustion where
“bead” particles are in the majority and from natural gas reburning where larger porous cenospheres are predominant – is the slightly higher relative percent of S (ca. 5%) in the particulate from this latter process.
The elemental EDS mapping for the particulate matter emitted from the combustion processes studied was also obtained with the aim of identifying the differences in the chemical element distribution and possibly in the formation mechanism of the three types of particles: “bead” cenospheres of small sizes, cenospheres with a few pores of intermediate sizes and larger porous cenospheres, observed in both particulates, as shown in the micrograph of Figure 6a.
Figures 6b, 7a and 7b show the EDS mapping of Al, Si and S, the majority elements in the particulate, for the microscopic region in the micrograph presented in Figure 6a. The EDS mapping of vanadium is very similar to that of sulfur (Figure 6b) and for this reason it is not shown.
The EDS mappings show higher Al and Si levels in the “bead” particles, that are compact, smaller and with a smooth surface, as shown in Figures 6b and 7a. On the other hand, S and V elements are present throughout the
Figure 4. Energy dispersive X-ray spectra (EDS) for fine particu-lates collected from standard residual oil (type no 4B) combustion (X200).
Figure 5. Energy dispersive X-ray spectra (EDS) for particulates collected from natural gas reburning on residual oil (type no 4B) combustion (X200).
a)
b)
cenospheres with a few pores and the larger porous cenospheres, as can be observed in Figure 7b.
These results suggest that the formation of “bead” particles is not completely in agreement with the mechanism usually described in literature for cenosphere formation.2,6,7 For this cenosphere mechanism, particles are
expected with the same inorganic chemical element distribution, independent on their sizes and morphologies, because it considers the same composition for the oil fuel droplets in the competition between volatilization and the hardening of the carbon shell. The literature also reports that silicon may condense on the surface of a cenosphere particle, while sulfur and vanadium are located throughout the material.13 The similar EDS mappings
observed for aluminum and silicon (Figure 6b and 7a) allow extending the behavior of silicon to that of aluminum.
The aluminum and silicon levels on the bead’s surface and the characteristic smooth surfaces of these beads allow proposing that these elements form aluminosilicates, which are melted due to the high flame temperature. The high aluminum and silicon concentrations on the bead surfaces may be related to the smoother surface of particle and are also probably associated with the ash constituted
of aluminosilicates produced by the complete combustion of other fuel oil droplets, which adhered and melted on the surface of even smaller cenospheres.
Although different inorganic chemical element distributions in dissimilar types of particles were observed, associated with the combustion conditions, the particulate material is, in fact, mainly composed of carbon.
This study showed that natural gas reburning applied to residual oil combustion, in addition to NOx emission reduction with low particulate emission (below Brazilian standard emission, 124 mg/Nm3),22 the particulate matter
emitted is predominantly constituted of large and porous cenosphere particles with sizes much above the inhalant particles (PM2.5, d < 2.5 um) usually associated with respiratory illness and mortality. This indicates the importance of the determination of particle morphologies and sizes in the particulate matter emitted from combustion processes.
Conclusion
The study of particulate matter emitted from residual oil combustion with a 2% O2 excess (O1 = 1.10) and from
natural gas reburning (O2 = 0.80) on heavy oil combustion
(O1 = 1.10), both in a pilot scale furnace, presents the follows
conclusions.
The characteristics of particulates are due to fuel oil composition and its burning conditions such as atomization, combustion air, temperature etc. The natural gas combustion itself has no influence on particulate formation, since the great part of particles have sizes above 300 nm.
Very compact spherical cenospheres with a smooth surface called “beads” have predominantly diameters of 0.6-1.5Pm and are the main portion of the particulates produced in standard residual oil combustion. Their formation probably occurs at high temperature and with short residence times. Otherwise, the cenospheres with a few pores having typical diameters of 10-20 Pm and the larger porous cenospheres, usually with diameters of 20-50 Pm, are the principal components of the particulates emitted from the reburning process on residual oil combustion and their production can be associated with lower temperatures and the longer residence times of this process.
EDS microanalysis of the particulates studied showed the same inorganic chemical element distribution: Al, Si, S, K, Ca, V, Cr, Fe and Ni, of which Al, Si, S and V are preponderant. The “bead” particles presented higher Al and Si contents, while S and V are dispersed throughout the larger porous cenospheres. The high levels of aluminum and silicon on the “bead” particles is probably related to
Figure 7. (a) Silicon mapping of EDS on the micrograph of Figure 6a and (b) Sulfur mapping on the micrograph of Figure 6a. Bar length = 10 Pm (3500X).
a)
their smaller sizes and smoother surfaces, and is due to aluminosilicate formation and melting on the surfaces of these particles.
Acknowledgements
The authors are grateful to Laboratory of Combustion and Gasification of Institute of Technological Research (LCG/IPT). This work was supported by FAPESP (Fundação de Amparo à Pesquisa do Estado de São Paulo) through projects 00/10991-4 and 00/13741-1 and CTPetro/FINEP (Fundo Setorial do Petróleo e Gás Natural do Brasil) through project 479369/01-1.
References
1. Toussait, M.; Peyrot, J.; Rev. Gén. Therm.1977,182, 141.
2. Witzel, L.; Moszkowicz, P.; Otterbein, M.; Muller, A.; Claus, G.;Rev. Gén. Therm.1991,353, 306.
3. Xu, F.; Lin, K. C.; Faeth, G. M.; Combust. Flame1998,115,
195.
4. Calcote, H. F.; Combust. Flame1981,42, 215.
5. Bertran, C. A.; Marques, C. S. T.; Benvenutti, L. H.; J. Braz.
Chem. Soc.2002,13, 47.
6. Claus, G.; Rev. Gén. Therm.1988,314, 78.
7. Moszkowicz, P.; Witzel, L.; Claus, G.; Chem. Eng. Sci.1996,
51, 4075.
8. Cheetham, H. A.; Champion, J. B.; Proceedings of the
Deuxième Symposium European sur la Combustion, The
Combustion Institute (French section), Orléans, France, 1975,
p. 653.
9. Bocca, P.; Fontana, M.; Belli, R.; Billi, B.; Tarli, R.; La Rivista
Combustibili1976,30, 239.
10. Munro, A. J. E.; Westlake, D.; Lewis, A.; J. Inst. Fuel1978,
51, 10.
11. Taylor, R. A.; Burgess, A. R.; Fuel Sci. Technol.1988,6, 43.
12. Bomo, N.; Lahaye, J.; Prado, G.; Claus, G.; Rev. Gén. Therm.
1984,274, 561.
13. Urban, D. L.; Dryer, F. L.; Proceedings of the Twenty-Third
Symposium (International) on Combustion, The Combustion
Institute, Orléans, France, 1990, p. 1437.
14. Witzel, L.; Moszkowicz, P.; Otterbein, M.; Muller, A.; Claus, G.;Rev. Gén. Therm.1995,406, 641.
15. Witzel, L.; Moszkowicz, P.; Claus, G.; Fuel1995,74, 1881.
16. Villasenor, R.; Garcia, F.; Fuel1999,78, 933.
17. Bilbao, R.; Alzueta, M. U.; Millera, A.; Lezaun, J.; Adanez, J.,
Proceedings of the Second International Conference on
Combustion Technologies for a Clean Environment, Lisbon,
Portugal, 1993, p. 1.
18. Patrapas, J.; Bluestein, J.; Power Eng.1994,98, 47.
19. Myerson, A. L.; Proceedings of the Fifteenth Symposium
(International) on Combustion, The Combustion Institute,
Tokyo, Japan, 1974, p. 1085.
20. Bilbao, R.; Alzueta, M. U.; Millera, A.; Prada, L.; Proceedings
of the Fourth International Conference on Combustion
Technologies for a Clean Environment, Lisbon, Portugal, 1997, p. 51.
21. EPA – Environmental Protection Agency. Code of Federal
Regulations, U.S. Government Printing Office, Washington,
1991,Title 40 – Part 60, Appendix A, 166.
22. Vergnhanini Filho, R.; Sousa, F. D. A.; Marques, C. S. T,;
Bertran, C. A.; Serfaty, R.; Proceedings of the Seventh
International Conference on Combustion Technologies for a
Clean Environment, Lisbon, Portugal, 2003, p.32.1.1.
Received: February 11, 2003
Published on the web: July 6, 2004