J. Braz. Chem. Soc., Vol. 15, No. 4, 523-526, 2004. Printed in Brazil - ©2004 Sociedade Brasileira de Química 0103 - 5053 $6.00+0.00
Article
* e-mail: [email protected]
Determination of Inorganic Ions in Ethanol Fuel by Capillary Electrophoresis
Rodrigo A. A. Munoz, Eduardo M. Richter, Dosil P. de Jesus, Claudimir L. do Lago and
Lúcio Angnes*
Instituto de Química, Universidade de São Paulo, Av. Prof. Lineu Prestes, 748, 05508-900 São Paulo - SP, Brazil
O controle do conteúdo de íons inorgânicos em combustíveis veiculares tem uma importante função na manutenção do motor. Um método novo e versátil para análise rápida de íons em etanol é apresentado. Eletroforese capilar foi utilizada para quantificar cátions (sódio, potássio, cálcio, magnésio e amônio) e ânions (sulfato, cloreto e nitrato). A injeção direta da amostra no capilar apresentou falta de repetibilidade nos resultados. A evaporação prévia do etanol, seguida pela resuspensão do material residual, levou a resultados confiáveis. Os limites de detecção para os oito íons estiveram na faixa de
0,06 a 0,18 mg L-1. Limites de detecção inferiores podem ser obtidos com o aumento do tempo de
injeção e/ou da pressão de injeção.
The control of the content of inorganic ions in vehicular fuels plays an important role in the engine maintenance. A novel and versatile methodology to carry out rapid analysis of ions in ethanol is presented. Capillary electrophoresis was used to quantify cations (sodium, potassium, calcium, magnesium, and ammonium) and anions (sulfate, chloride, and nitrate). The injection of the sample directly in the capillary shows some lack of repeatability of the results. The prior evaporation of the ethanol, followed by a re-suspension of the residual material, leads to reliable results. The detection
limits of the eight ions range between 0.06 and 0.18 mg L-1. Lower detection limits could be attained
by increasing the injection time and/or the injection pressure.
Keywords: ethanol fuel, inorganic ions, capillary electrophoresis
Introduction
In Brazil, ethanol as a fuel is obtained from the fermentation of sugar cane, and this process is now well established. With an annual production of 13 x 109 L in
2002,1ethanol is predominantly consumed as vehicular
fuel, both in the anhydrous form, (mixed with gasoline, which enhances the octane number and acts as anti-knocking agent), or in the hydrated form (94 % ethanol). The contamination of the ethanol fuel with metal ions such as copper, iron, and sodium and inorganic anions such as chloride and sulfate can affect engine performance, since salts and sediments that are formed can block the nozzles and induce corrosion in the vehicle components in contact with the fuel.2
Almeida et al.3 and Oliveira et al.4 described
methodologies for sodium determination in ethanol fuel using flame photometry. The determination of metals in ethanol fuel by electrothermal atomic absorption spectrometry5-7 is well established and flame atomic
absorption spectrometry can be used for same determinations after preconcentration.8,9 Anodic stripping
voltammetry was used for zinc determination.10 The
Brazilian Petroleum National Agency – ANP (Agência Nacional de Petróleo) establishes upper limit of 1, 4, and 2 mg/kg for chloride, sulfate, and sodium ions, respectively, in hydrated ethanol fuel.11 The recommended techniques
for the determination of chloride, sulfate, and sodium ions in this fuel sample are, respectively, potentiometry, precipitation titration, and atomic emission spectroscopy. Ion chromatography (IC) is also described by ANP for the simultaneous determination of chloride and sulfate.11
Methods for the determination of cations and anions in ethanol fuel are scarcely found in the literature. Piatnicki et al.12 showed preliminary results for the determination of
524 Munoz et al. J. Braz. Chem. Soc.
successfully for the determination of ions in rainwater13
and in human serum samples.14 The main advantages of
CE over IC are the lower cost and shorter time of analysis. In this work, we describe a method based on capillary zone electrophoresis with CCD for the determination of some cations and anions in ethanol fuel.
Experimental
Reagents and samples
All reagents were of analytical grade. 2–[N-morpholino]ethanosulfonic acid (MES), L-histidine (HIS), N-cetyl-N-N-N-trimethylammonium bromide (CTAB), lactic acid, NH4Cl, KCl, NaCl, LiOH, CaCl2, MgCl2, NaNO3, and Na2SO4 were purchased from Merck (Darmstadt, Germany). Running buffer and individual stock solutions (2000 mg L-1 of each cation) were prepared with 18 M:.cm
deionized water (NANOpure UV, Barnstead/Thermolyne Co., Dubuque, Iowa, USA). The lithium and lactate (2000 mg L-1) stock solutions were prepared by the total
neutralization of LiOH and lactic acid with HCl and NaOH, respectively. Standard solutions with mixtures of cations and anions were prepared by dilution of individual stock solutions until the desired concentration. Bromide in CTAB was replaced by hydroxide (CTAH) using an anion exchanger column (Merck, Darmstadt, Germany). The running buffer for anions analysis contained 20 mmol L-1
MES/HIS and 0.2 mmol L-1 CTAH.13The CTAH was added
to promote the inversion of the direction of the electroosmotic flow. For cations, 20 mmol L-1 HIS/lactic
acid and 2.5 mmol L-1 18-crown-6-ether14 solution was
used. The crown-ether was added to delay the K+ peak,
otherwise superimposed to the NH4+ peak.
Two hydrated ethanol fuel samples (A and B) were purchased at different local fuel station in the city of São Paulo and were stored in glass bottles carefully cleaned with ultra pure water.
Equipment
A home made capillary electrophoresis equipment was used for the analysis.15,16 A Pentium® 133 MHz
microcomputer controls the instrumental parameters and the acquisition of the signals from the CCD operating at 600 kHz. The detector was placed at 10 cm from the end of the capillary. The samples were injected by gravity from a height of 100 mm for 30 s into a 75 mm inner diameter and 50 cm length fused-silica capillary (Agilent Technologies, São Paulo, Brazil). The applied voltages were -15 and +15 kV for anion and cation determinations, respectively.
Sample preparation
1 mL of sample was completely evaporated17,18 in a 10
mL glass beaker on a hot plate at 90oC and then an equal
volume of ultra pure water was added. This pretreatment takes 2 min and can be carried out for several samples simultaneously. The utilized beakers were previously maintained overnight filled with deionised water. This procedure avoids contamination of the sample during the alcohol evaporation process.
Results and Discussion
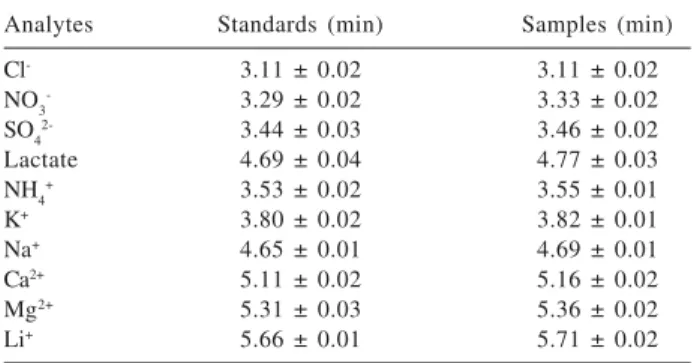
The injection of untreated samples directly into the capillary was tested without success. The responses obtained in this way showed a marked lack of repeatability, probably due to the adsorption of organic substances present in the samples on the internal capillary wall. In addition, the difference in conductivity between the samples and the buffer solution generated different migration times for the analytes. The evaporation of the ethanol allowed overcoming both problems. Table 1 contains the migration times of all ions in standard solutions and pretreated samples. The relative standard deviations (n = 4) are below 0.8 %, which indicates excellent repeatability of the signals.
Figure 1 shows the electropherogram of ethanol fuel (a) and the same sample with addition of 1.94 mg L-1 of
each anion (b). The peaks for chloride (1), nitrate (2), and sulfate (3) could be identified. Lactate (4) was used as an internal standard (2.4 mg L-1). Good peak resolution and
baseline can be observed with MES/HIS/CTAH running buffer. The use of CTAH instead of CTAB for inversion of the electroosmotic flow avoids the negative peak13
associated to the bromide peak (from CTAB), which would reduce the sensitivity of chloride.
Figure 2 presents the electropherogram of ethanol fuel (a) and the same sample with addition of 1.94 mg L-1 of Table 1. Migration times measured for the ions in standard solutions and ethanol fuel samples (n = 4)
Analytes Standards (min) Samples (min)
Cl- 3.11 ± 0.02 3.11 ± 0.02
NO3- 3.29 ± 0.02 3.33 ± 0.02
SO42- 3.44 ± 0.03 3.46 ± 0.02
Lactate 4.69 ± 0.04 4.77 ± 0.03
NH4+ 3.53 ± 0.02 3.55 ± 0.01
K+ 3.80 ± 0.02 3.82 ± 0.01
Na+ 4.65 ± 0.01 4.69 ± 0.01
Ca2+ 5.11 ± 0.02 5.16 ± 0.02
Mg2+ 5.31 ± 0.03 5.36 ± 0.02
525 Determination of Inorganic Ions in Ethanol Fuel by Capillary Electrophoresis
Vol. 15, No. 4, 2004
each cation (b). The peaks for ammonium (1), potassium (2), sodium (3), calcium (4), and magnesium (5) were also identified. Lithium (6) was used as an internal standard (3 mg L-1).
Table 2 shows the concentrations of anions and cations in two samples and the respective recoveries upon addition
of 1.94 mg L-1 of each ion. The concentrations of chloride,
sulfate, and sodium in the two samples were below the upper limits established by ANP. The presence of the potassium and calcium ions in the samples can also cause similar engine problems as the sodium ions. Therefore, it is also important to check these ions in ethanol fuel.
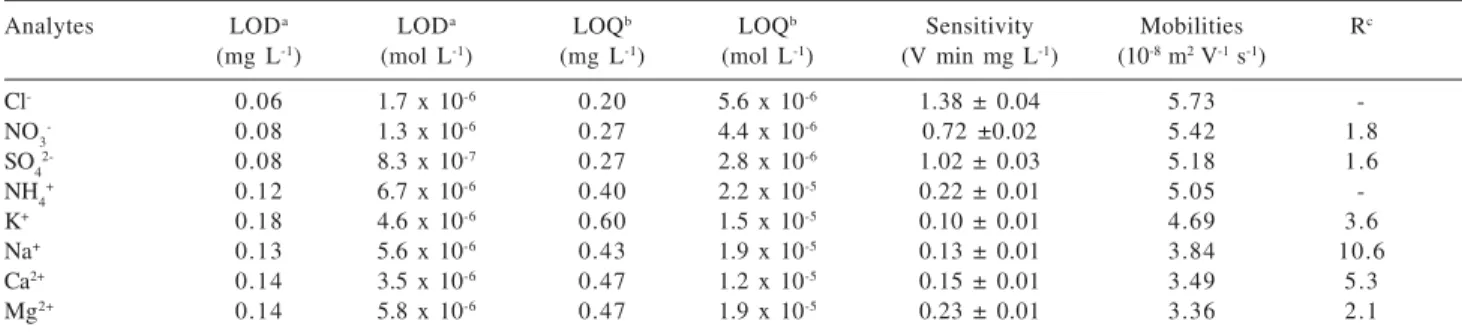
Table 3 presents the analytical characteristics of the proposed method. It was observed a good linearity up to the highest standard solution utilized (4 mg L-1) in the
analytical curves. However, this linearity is higher, but it was not evaluated in this work. It is important to emphasize that these limits of detection could be improved by using higher pressure and/or longer time of injection, without significant degradation of the electrophoretic separation.
Conclusions
Capillary electrophoresis with CCD was found to be very suitable for the determination of inorganic ions in ethanol fuel. The proposed method has lower cost and
Table 2. Concentration of anions and cations in two ethanol fuel samples and the respective recoveriesa(n = 4)
Ions Sample A Sample B
Found Recovery Found Recovery
(mg L-1) (%) (mg L-1) (%)
Cl- 0.19 ± 0.02 101 ± 5 0.45 ± 0.05 98 ± 6 NO3- 2.30 ± 0.10 123 ± 5 3.51 ± 0.18 97 ± 3 SO42- 0.98 ± 0.03 98 ± 4 0.48 ± 0.05 100 ± 8
NH4+ < LOD 97 ± 4 < LOD 117 ± 6
K+ 0.63 ± 0.06 103 ± 1 0.49 ± 0.06 109 ± 4 Na+ 0.68 ± 0.08 96 ± 5 0.90 ± 0.05 95 ± 3
Ca2+ < LOD 98 ± 9 0.94 ± 0.08 99 ± 8
Mg2+ < LOD 99 ± 3 < LOD 97 ± 3
a addition of 1.94 mg L-1 of each ion.
Figure 1. Separation of inorganic anions: (a) Electropherogram of ethanol sample: (b) Electropherogram of the same ethanol sample with addition of 1.94 mg L-1 of each analyte. Running buffer: 20 mmol L-1 MES/HIS and 0.2 mmol L-1 CTAH. Separation voltage -15 kV; gravity injection at 100 mm for 30 s; silica capillary with 75 mm inner diameter and 50 cm long; Peaks: (1) chloride, (2) nitrate, and (3) sulfate. Lactate (4) was used as internal standard (2.4 mg L-1).
526 Munoz et al. J. Braz. Chem. Soc.
Table 3. Analytical characteristics of the proposed method
Analytes LODa LODa LOQb LOQb Sensitivity Mobilities Rc
(mg L-1) (mol L-1) (mg L-1) (mol L-1) (V min mg L-1) (10-8 m2 V-1 s-1)
Cl- 0.06 1.7 x 10⁻⁶ 0.20 5.6 x 10⁻⁶ 1.38 ± 0.04 5.73
-NO3- 0.08 1.3 x 10⁻⁶ 0.27 4.4 x 10⁻⁶ 0.72 ±0.02 5.42 1.8
SO42- 0.08 8.3 x 10⁻⁷ 0.27 2.8 x 10⁻⁶ 1.02 ± 0.03 5.18 1.6
NH4+ 0.12 6.7 x 10⁻⁶ 0.40 2.2 x 10⁻⁵ 0.22 ± 0.01 5.05
-K+ 0.18 4.6 x 10⁻⁶ 0.60 1.5 x 10⁻⁵ 0.10 ± 0.01 4.69 3.6
Na+ 0.13 5.6 x 10⁻⁶ 0.43 1.9 x 10⁻⁵ 0.13 ± 0.01 3.84 10.6
Ca2+ 0.14 3.5 x 10⁻⁶ 0.47 1.2 x 10⁻⁵ 0.15 ± 0.01 3.49 5.3
Mg2+ 0.14 5.8 x 10⁻⁶ 0.47 1.9 x 10⁻⁵ 0.23 ± 0.01 3.36 2.1
a for SNR = 3; b for SNR = 10, c Resolution between the corresponding peak and the previous one.
shorter analysis time, if compared to IC, despite the sample pretreatment step. The detection limits attained in the present study satisfy the upper limits established by ANP for ethanol fuel analysis.
Acknowledgements
The authors wish to thank FAPESP (Fundação de Amparo à Pesquisa do Estado de São Paulo), CNPq (Conselho Nacional de Desenvolvimento Científico e Tec-nológico) and CNPq/CTPetro (process 502452/2003-0) for financial support.
References
1. http://www.anp.gov.br/anuario2002/apresentacao.html; accessed in July 2003.
2. Moreira, J.C.; Gushikem, Y.; Anal. Chim. Acta1985, 176, 263.
3. Almeida, L.F.; Martins, V.L.; Silva, E.C.; Moreira, P.N.T.; Araújo, M.C.U.; J. Braz. Chem. Soc.2003,14, 249. 4. Oliveira, A.P.; Okumura, L.L.; Neto, J.A.G.; Moraes, M.; Eclet.
Quim.2002,27, 285.
5. de Oliveira, A.P.; de Moraes, M; Neto, J.A.G.; Lima, E.C.;
Atom. Spectrosc.2002, 23, 39.
6. de Oliveira, A.P.; de Moraes, M; Neto, J.A.G.; Lima, E.C.;
Atom. Spectrosc. 2002,23, 190.
7. Pierre, T.S.; Aucélio, R.Q.; Curtius, A.J.; Microchem. J.2003,
75, 59.
8. Pesco, C.; de Campos, E. A.; Costa, C. M. M.; Mikrochim. Acta
1997,127, 229.
9. Gomes, L.A.M.; Padilha, P.M.; Moreira, J.C.; Filho, N.L.D.; Gushikem, Y.; J. Braz. Chem. Soc.1998,9, 494.
10. de Oliveira M.F.; Saczk, A.A.; Okumura, L.L.; Stradiotto, N.R.;
Eclet. Quim.2002,27, 153.
11. h t t p : / / w w w . a n p . g o v . b r / d o c / p o r t a r i a s / 2 0 0 2 / Portaria_ANP_002_2002.pdf; accessed in July 2003. 12. Piatnicki, C.M.S.; Bockel, W.J.; Vilar, R.B.C.; Veses, R.C.;
Samios, D.; Book of Abstracts of XII SIBEE (Simpósio Brasileiro
de Eletroquímica e Eletroanalítica) 2002, p. 273.
13. Rocha, F.R.; da Silva, J.A.F.; do Lago, C.L.; Fornaro, A.; Gutz, I.G.R.;Atmos. Environ.2003,37, 105.
14. da Silva, J.A.F.; Ricelli, N.L.; Carvalho, A.Z.; do Lago, C.L.;
J. Braz. Chem. Soc.2003,14, 265
15. da Silva, J.A.F.; Guzman, N.; do Lago, C.L.; J. Chrom. A
2002, 942, 249.
16. da Silva, J.A.F.; do Lago, C.L.; Anal. Chem.1998,70, 4339. 17. Bruning, I.M.R.A.; Malm, E.B.; Research and Development
Center of Petrobras Company, Rio de Janeiro, 1980, 25, 15,
apud ref. 9.
18. Bruning, I.M.R.A.; Malm, E.B.; Bol. Tec. Petrobras1982,25,
217,apud ref. 9.
Received: August 12, 2003 Published on the web: June 18, 2004