DRIVERS OF REVENUES AND EXPENSES IN
HIGHER-EDUCATION NON-PROFIT
INSTITUTIONS
Ana Rita Vitório
Nova School of Business and Economics
Maastricht University
Master Thesis supervised by:
Dr. Leonard Wolk
Dr. Ana Marques
December 2014
Abstract
1
INTRODUCTION
Although sometimes disregarded, the non-profit sector is a significant
contributor to the American economy. According to “The Nonprofit Almanac” (Roeger, Blackwood and Pettijohn , 2012) and to “The Nonprofit Sector in Brief” (McKeever and Pettijohn, 2014), the third sector, as it is commonly known, in 2012 accounted for 5.4% of the US’s GDP, which represents over $887 billion worth of output. In that year, there were 1.44
million organisations in the sector that reported close to $4.85 trillion in
total assets. The changes and growing importance of the sector makes it
interesting to measure the performance of its constituencies, particularly the
ones that most greatly influence it.
However, the studies still show that there are many imbalances in the sector.
For example, according to their results, 4% of charities account for more
than 85% of the spending in 2012 and hospitals alone account for over 50%
of revenues and expenses in the sector. Higher education is the other
sub-sector that stands out in their analysis by representing, in that year, merely
0.7% of total number of public charities in the United States but over 11%
of their revenues and expenses. The significant relative importance of each
institution when compared to organizations from other sub-sectors is the
reason that drives me to focus on higher education non-profits.
According to Speckbacher (2003), the US government’s pressure is becoming more significant as charities progressively engage in the provision
of state funded services. As of 2012, government contributions accounted,
directly or indirectly, for over 32% of the non-profit institutions’ source of revenues (McKeever and Pettijohn, 2014). Therefore, I analyse the drivers
of donations and efficiency in the non-profit sector, not only for the private
donators, but also for the government that indirectly represents the
tax-payers. This way, these unintended contributors can understand what their
money is being used for and the institutions can know how to obtain more
2
(Morris, 2000; Bennet and Svani, 2003; Wainwright 2003; Ritchie and
Kolodinsky 2003; Ramirez and Saraoglu 2011; Cameron 1978). However,
there has been much controversy about how to measure the performance of
institutions that are so different from their private counterparts. The
particularities of non-profit organizations, like their goals (such as, the
well-being of the population or the provision of education) or their inputs (like volunteers’ time), are hard to quantify in monetary terms which makes them a target of different approaches for efficiency measurement.
Still, it is crucial not to disregard the importance of a good and effective
governance and management for the survival of non-profit organizations.
This study analyses the reasons for the success of some higher education
organizations and the failure of others, focusing on their structure of
expenses and revenues. I construct my data set based on Charity Navigator – an online platform that gathers information on and rates over 7,000 of the
largest charitable institutions of the USA. The final sample includes 95
higher education institutions, and their data is analysed over a 3-year period
(2011-2013). Although most of these institutions are connected to
universities, these are not the universities themselves. It comprises: alumni
associations, endowment funds and organizations that aim at improving
teaching, research and assisting the inclusion of any specific ethnic/religious
group.
The academic contribution of this study is to shed light on the discussion
surrounding the performance of non-profit organizations, in particular the
higher education sub-sector. I analyze not only the perceived performance,
by looking into the drivers of the contributions, but also the actual efficiency
with which the institutions apply the received income, by looking at the
drivers of expenses. Ever more attention is being paid to this matter due to
the growing importance of this sector in the global economy and, as a
consequence, several different theoretical approaches have emerged in the
recent years. Still there is a deficiency in the performance evaluation in what
3
focus on ways to help institutions become more effective, which is highly
specific to each organization.
The practical contribution of my study is to provide a framework that all
institutions within an industry can follow to better understand what drives
their performance so that they can focus on it and improve. Moreover, I
wish to make this subject clearer to donors so that the decision making
process regarding the application of their funds can be more conscientious
and aware. It is my intention that this study and its results can be replicated
to other industries so that its conclusions may involve the complete
non-profit sector.
Therefore, I aim at answering the following question:
What characteristics drive revenues and expenses in higher-education
non-profit institutions?
I divide the study into the two topics that are being analysed. I start by
assessing the non-profit institutions’ allocation of expenses. Throughout the paper I refer to “overhead” as any expenses a non-profit organization may have that are not directly linked to the program it tries to implement
(administrative and organizational expenses as well as fundraising expenses
i.e. publicity, campaign printing, staffing etc.). According to Hyndman (1990), this measure as a percentage of total expenses “was the most important type of financial information required by contributors”. The first consideration is that the higher this proportion is, out of the total expenses
amount, theoretically, the worst performing the organization would be. “The logic, of course, is that donors do not want to fund overhead; they want to
finance programs that help people and communities” (Glassman and Spahn, 2012). Therefore, I start by analysing the determinants of that proportion.
Understanding what makes a non-profit organization have more or less
overhead may be a step to comprehending why some are able to survive and
prosper by helping to satisfy a need in society and others are not. As well as
4
invest in are just being poorly managed or if it is inherent to the it’s specific type to have high overhead expenses.
I use the concept of program expenses which is the percentage of a charity’s total budget spent on the programs and services it exists to deliver. The
higher this proportion, the more efficient the organization should be.
The second part of the study assesses the generation of revenue, because
even if the institution excels at using its funds, if these are not sufficient for
the proposed objectives the accomplishments are always constrained. This
way, it is important to understand why some have funds to spare and others
struggle to obtain them.
I conclude that size is statistically associated with both the proportion of
expenses allocated to the program and the revenues of the organizations.
Larger institutions not only have higher contributions but also allocate a
bigger share of those contributions to the program instead of overhead. I
also find that higher-education institutions clearly affiliated to a determined
religion tend to have more of their spending assigned to administration and
fundraising activities than non-religious organizations. I conclude that
accountability and transparency lead to an increase of the amount spent in
the program as a share of total expenses.
Regarding revenues, I find that, in general, fundraising activities have a
positive effect on contributions. There is also autocorrelation in the revenues
of the sample organizations. This leads me to conclude that donors are
persistent regarding the institutions they choose to contribute to. These
variables explain most of the variations in contributions (95.6%).
Accountability and transparency do not seem to be considered by the
donors.
I start this paper with a literature review of what has been done in this
domain and the principal results. In this chapter there are covered several
5
thesis. First, I present a quick overview and the relevance of the non-profit
industry. Then I identify the importance of having a performance
measurement in the non-profit sector and the struggle to find common
ground between the approaches. I include the advantages and potential
pitfalls of using the financial results as a proxy for efficiency and their
different interpretations. I also include the main differences regarding not
only the profit driven firms but also regarding public institutions. Finally I
introduce studies more closely related to the higher education sub-sector.
The following section is dedicated to the research design of the paper. I start
by stating the sample constitution and how the data collection was made and
organized. This chapter also includes the methodology which comprises the
definition of each variable and the prediction or expected results of their
influences in the dependent variables. Next, I introduce the results and their
interpretation. This chapter is also divided into sections: first I present the
descriptive statistics of the sample and their correlation and only then do I
analyze the proposed regressions. Finally, I state my conclusions and
mention the limitations of this study.
LITERATURE REVIEW
The importance of the Non-profit Sector
There are over 1.44 million organizations in the nonprofit sector in the
United States alone (McKeever and Pettijohn, 2014). These mostly relate to
education, health, art and culture, environment, animals, religion, human
services or international affairs. According to a study performed by Ramirez
and Saraoglu (2011) this number and scope of nonprofits are growing
significantly. However, after the steady growth of the early 2000’s, the
financial recession hit the sector and revenues stabilized (McKeever and
Pettijohn, 2014). Still, non-profit organizations have an important role in the
6
percent of gross domestic product. But the significance of the nonprofit
sector in the economy goes further than the directly observed contributions.
First, it is a steady source of employment. These organizations are, in their
core, similar to ordinary institutions and as such require specialized works
to operate. Still, a significant part of the labor force comes from volunteers.
More than a quarter of the adults in the United States volunteer in an
organization, summing up to 8.1 billion hours, which represents $163 billion
(McKeever and Pettijohn, 2014).
The notion of profit, as it is usually used, should not be applied in this
situation, as the real importance of this sector lays on the improvement of
the welfare of individuals. The third sector, as it is commonly known, “fosters social capital that, in turn, promotes economic growth and contributes to the healthy operation of democratic societies” (Morris, 2000). According to this theory, one of the most salient characteristics of this sector’s organizations is the positive externalities that are created for society. When analyzing these institutions, in line with this strand of
literature (Morris, 2000; Kaplan, 2001), the focus should not be on the
product they supply but rather on the externalities of the process by which
they do so. This does not imply, however, that a nonprofit could not
generate profits in the sense of cash surplus, only that when examining its
productivity or efficiency this should not be the only consideration.
The importance of performance measurement
In this scenario, it becomes more complicated for donors to make a decision
that is consistent with their donations’ objectives. Competition for a share of the available resources has lead nonprofit organizations to be keen on trying
to demonstrate their performance, by publicly disclosing their financial
statements. These perform an important role in sustaining public trust and
confidence, and have the capacity to attract donations (Bennett and Savani,
2003). Wainright (2003) notes that besides showing their performance to
increase contributions, non-profit organizations also do this due to the
7
government and non-government funders, donors, volunteers, employees,
users and beneficiaries.
The nonprofit sector organizations in the US currently obtain close to one
third of their income from the state (Boland and Fowler, 2000; McKeever
and Pettijohn, 2014). According to Johnes (2006), this is the reason why it is “essential, in the interest of accountability, to measure the efficiency of the institutions which comprise these sectors". As nonprofits progressively
engage in the provision of state funded services the government pressure is
becoming more significant, since it has to keep track of the efficiency at
which its resources are being used (Speckbacher 2003; Morris, 2000).
Informed donors usually spend some time on a due diligence in order to
adequately allocate their contribution. The issue in this case is that the
donors are the taxpayers. Because governments make this allocation for
them, it strikes me as important to have an easy to interpret performance
measurement. This characteristic adds to the urge of finding a performance
measurement that can simplify the choice of donation allocation.
Moxham (2009) summarizes the importance of performance measurement
by stating four drivers. The first is financial reporting: as previously noted
there is an increasing pressure to keep regulators and funders updated about the firm’s performance. Donors want to be certain that institutions spend their contributions efficiently and that their services or products meet the
needs of those who require it. Secondly, the study proves there is a
significant positive correlation between the demonstration of achievement
and increasing the funding from current and new donors. The third
mentioned factor is operational control. This is simply for regulators to
assure the institution is in compliance with charity law and acting in the
benefit of the public. Finally, performance measurement is used to facilitate
the continuous improvement of the institution itself. This last reason has led
to the appearance of a number of performance measurement frameworks
8
Differences in performance measurement between the non-profit sector and its private and public counterparts
There is a consensus in the literature that nonprofits do not behave in the
same manner as normal profit driven firms because these “lack the simple elegance of a financial measure such as profitability or shareholder returns
used by for-profits” and as such cannot be assessed in the same way (Kaplan, 2001). The two main differences lie on the way they generate
money and on who the customers are (Kaplan, 2001; Micheli and
Kennerley, 2005). “In a private sector transaction, customers both pay for the service and receive the service. The two roles are so complementary that most people don’t even think about them separately. But in a nonprofit organization, donors provide the financial resources – they pay for the service, whereas another group, the constituents, receives the service” (Kaplan, 2001). However, even being aware that there is a difference
between the nonprofits and its private counterparts, there is no common
agreement about the definition of a nonprofit (Vincent and Harrow, 2005).
Salamon and Anheier (1992) define this sector as a group of institutions
which must share these five main characteristics: organization, private
ownership (i.e. institutionally separate from the government), non-profit
distributing (their owners or directors may not keep any of the profits since
the totality of these should be put to the pursuing of the institutions
mission), self-governing and some meaningful degree of voluntary work.
The similarities in objectives and goals of both public and nonprofit
organizations make their distinction unclear. Weisbrod and Dominguez
(1986) and Feiock and Andrew (2006) argue in favor of the Public Goods
Theory. This is based on the notion that both nonprofits as well as
governmental entities provide services overlooked by the private sector. The
difference however lies on the fact that public organizations satisfy the general public’s needs but there is always some residual unsatisfied demand of groups with particular interests which is eventually satisfied by
9
Kaplan (2001), be the best manner to measure their performance. For this
reason, it is the author’s view that nonprofit organizations should disclose nonfinancial quantitative measures of the quantity and quality of the
services provided.
The difficulties in the definition of a performance measurement
It is now clear that nonprofit and charitable entities play an important role in
modern society and that it is increasingly important for them to make their
financial statements available to the public. Without a comparison basis,
however, donors still struggle with the analyses of those results. Sheehan
(1996) concludes that even though most organizations have their objectives
clearly stated most do not have any measurement to grasp to what extent
those are successfully achieved and their actual impact in society.
Benefactors face a big challenge because “determining where to allocate scarce resources is hard when there is no performance measurement agreed on” (Ritchie and Kolodinsky, 2003). Academics as well as practitioners have found several difficulties and so far they have not reached any definite
conclusions (Poister, 2008; Franco-Santos et al., 2007; Bourne et al., 2000).
In the 1980’s there was a movement towards the importance of a multidimensional approach to measure the effectiveness of non-profits
(Cameron 1978, 1982; Connolly, Conlon and Deutsch, 1980; Kanter and
Summers, 1994). To meet that need, Kaplan (2001) suggests a Balanced
Scorecard that measures how the organization creates value in four different
ways: in a customer perspective, financial perspective, internal perspective
and a learning and growth perspective. However, this is meant to be a
method of organization for the firms to improve their management and
governance by clearly defining their main objectives, measures, targets and
initiatives. So, the outcome of his work was a highly specific appreciation of
how well the non-profit was fulfilling its objectives. This could be relevant
to facilitate the continuous improvement of the institutions but it would
hardly serve as a comparison bases between the analyzed firms given that
10
for the disclosure of the information pointed out by Moxam (2009), this
process only covers the last one leaving the remaining unattended.
According to Neely (1999), pressure to compete increases in terms of value
rather than cost. This forces businesses to consider their performance in
terms of quality of service, flexibility, customization, innovation and rapid
response. However, as Glassman and Spahn (2012) suggest, good measures
of impact are difficult and expensive to obtain. One would have to make
complicated choices between simplicity and precision; comprehensive data
and the costs of gathering information; comparability and individual
performance. Nonetheless, the aforementioned authors agree that
standardized performance measures would be very hard, if not impossible,
to obtain. Still, they propose the gathering of information to construct
performance standards within each program, which he called Key
Performance Indicators (KPI). These measure the performance of the non-profits according to the program’s outputs, outcomes and impact. Yet, even these are theoretically solid but practically unattainable.
Wainwright (2003) also introduces a theory in similar lines. Impact
assessment, as he names it, is defined as “all changes resulting from an activity, project or organization. It includes intended as well as unintended,
negative as well as positive, and long-term as well as short-term effects”. Even considering the relevance and value of such an approach, it is rarely
straight-forward and due to the diversity found in the nonprofit sector, very
hard to generalize.
Organizational effectiveness is therefore both a powerful and problematic
concept, in the sense that it is essential for the evaluation and exposure of
the organizations, but it can mean different things to different people
11
effectiveness, researchers have tended to lean on one or some combination
of the three major approaches. The first is the goal attainment approach,
which is based on the assumption that organizations objectives are easily
identifiable and unambiguous. The second approach relies on system
resource, which emphasizes organizational resource procurement and
defines effectiveness as viability or survival probability. Finally, there is the reputational approach, which “associates effectiveness with the reported opinion of key persons, such as clients or service professionals”.
Therefore, assessing the efficiency instead of the effectiveness of nonprofits
has been the most addressed way of assessing their performance throughout
the literature. The simple question of whether a specific production process
is efficient, that is, whether resources are not wasted, is still difficult to
answer for nonprofits, in comparison to other private and public institutions
(Speckbacher, 2003). The logic is that these types of organizations
frequently have goals that are amorphous and offer services that are
intangible or bundled (Forbes, 1998). In some cases, even the inputs are
hard to measure (like volunteer’s time) making it very difficult to clearly define the metrics for their performance in a quantitative way (Speckbacher,
2003). To this difficulty or even impossibility of measurement, Hyndman and McKillop (1999) add the “multiplicity of objectives and outputs; differing outputs at different organizational levels; and, the allocation of joint costs to various outputs”, to the list of major problems organizations trying to measure efficiency have to confront.
Van Peursem et al. (1995) alerts for the limitations of using financial results
as efficiency indicators. According to this study’s results, these can be “deceptive because they falsely convey an impression of objective truth”. For instance, at first, overhead costs (administrative and fund-raising) are
usually looked at as wasteful - featuring excessive salaries, numerous
perquisites and unnecessary staff. This leads organizations, including
charity watchdogs and rating platforms like the one used to gather the data
12
administration enhances organizational capacity which may be positive for
the organizations. Tinkelman and Mankaney (2007) find evidence that
when resources decrease, charities cut programs reducing this share of
expenses, but when the resources increase the opposite does not happen.
This is consistent with the theory (Chang and Tuckman, 1991) that in case
of fiscal adversity, administrative expenses may serve as a cushion for
organizations, allowing charities to continue with their work. These
opposing views imply, according to Bowman (2006), the existence of an
optimal level of spending on administrative costs, which differs from
organization to organization. Moreover, different organizational
characteristics and circumstances imply different costs for fund-raising. By
putting the focus on certain aspects of performance, other management
activities are marginalized, creating a bias towards institutions in sectors of
activity that are more favorable in overhead containment.
The question of whether donors should care about overhead expenses is also
discussed in the academic domain. Steinberg (1986) writes about the
irrelevance of overhead ratios and argues that donors should not care about
them because they provide no useful information about marginal costs and
returns. He illustrates his point with the following example (1994):
“The first budget of $10.000 will produce $50.000 in donations and provide a 500 percent ratio return ($40.000 actual net return). The
second budget of $100.000 will produce $200.000, a 200 percent
ratio return ($100.000 actual net return). If a charity wished to
maximize the rate of return on its fund-raising investment, it would
choose the first budget; if it cared about maximizing its resources for
providing charitable services, it would choose the second.”
The increased administration costs and other overhead expenses are
therefore, according to the author, a necessary evil to gather more funds and
provide the services the institutions are created to deliver. Bowman (2006)
agrees that the ratios alone are meaningless but, on the contrary, believes
13
“a change in a charity's overhead ratio correlates positively with a change in the price of giving, which, like any price, contains useful information for consumers”. Nonetheless he points out that changes in overhead ratios are only one of the many things donors care about, and collectively other factors
are much more important.
Nevertheless, as mentioned, one of the most important reasons for charities
displaying their financial results is the gathering of funds (Moxam, 2009).
As such, whether donors should care about the overhead ratio is not as important as whether they actually docare. Andreoni’s (1990) “warm glow” theory suggests that the act of giving itself increases a donor's utility
independently of how his donation is used. There are other studies regarding
the relationship between fund-raising overhead and donations but the results
are still inconclusive. Steinberg (1986) finds no statistically significant
correlation between the variables but Okten and Weisbrod (2000) and
Weisbrod and Dominguez (1986) reported a negative one, i.e. an increase in
overhead expenses reflects negatively on the amount of donations.
The higher-education sub-sector
Similarly to the remaining non-profit sector, higher-education institutions
have seen their trends of growth change in recent years. The revenues of the
higher education sub-sector have grown, between 2002 and 2012, 47.8
percent (after adjusting for inflation), to $184 billion. However, most of that
growth happens in the first half of the period, and after the economic slump
there is merely a marginal increase in the revenues. Even after the
slowdown of the sector, the segment still sets itself apart from the remaining
because it constitutes only 0.7% of the total institutions but represents over
11% of the revenues and expenses of the sector. This comparable relevance
of each individual institution is only surpassed by the hospitals and primary
care facilities that account for 2.4% of the total number of charities and
represent over 50% of the revenues and expenses (McKeever and Pettijohn,
14
Education organizations have other particularities that add to their
importance. The future generations’ progress and development of knowledge is, up to a certain point, dependent on the widespread availability
of education. Endowment funds and similar contributions gain significance
in a time when education is still expensive and thus not affordable to
everyone. Most innovation initiatives and research depend on funding,
without which they would not be undertaken. While European universities
get most of their funds from public sources, Anglo-American systems of
higher education depend mostly on private funding (Liefner, 2003).
Cameron (1978) conducted a study on measuring the organizational
effectiveness in institutions of higher education. One of the main issues the
author faces is the variety in characteristics, goals and constituencies of the
organizations. This diversity leads to each type of institution or industry requiring a “unique set of effectiveness criteria”. Similarly to other authors (Sheehan, 1996; Ritchie and Kolodinsky, 2003), Cameron (1978) finds
several difficulties in empirically assessing organizational effectiveness
because no ultimate criterion of effectiveness exists. However, the author
focuses on the quality of the services they provide, like student satisfaction;
academic career and personal satisfaction, etc.
Others have dedicated their studies to investigating specific variables of the
higher-education segment like the quality of graduate programs (Cartter,
1966; Blau and Margulis, 1974) or the accuracy of ratings (Beyer and
Snipper, 1974). The analysis regarding not the effectiveness but the
efficiency (as in the lack of waste of resources) of the organizations,
however, has been rather less debated.
I intent to add to this discussion by answering the question: What are the
main drivers of revenues and expenses of higher-education non-profit
institutions? I am concentrating specifically on these characteristics of
efficiency, as in how well the resources are used, instead of effectiveness.
This distinction may allow me to perform a study that can be replicated to
15
Finding the common features between institutions with more or less
financial resources or with different income allocation may lead us to
understand why some fail and others succeed. In order to do so, I formulate
two hypotheses that address each of the components.
Hypothesis 1: the part of available income spent in program expenses
increases with the accountability and transparency (Governance) and varies
as well with the Characteristics of a charitable institution.
Hypothesis 2: revenues increase with the accountability and transparency
and vary as well with the Characteristics of a charitable institution.
I also formulate three sub-hypotheses. First I believe that fundraising
expenses increase the revenues of a non-profit organization. This addresses the importance of marketing and determines how big its role is in a charity’s generation of revenues. Second, I expect to find autocorrelation in the
generation of revenues. I believe it is relevant to understand how much of
the institution’s ability to raise new funds, is predetermined by the funds it usually raises. Finally, I expect revenues to decrease with the increase in the
proportion spend in overhead. I base this on the assumption that donors do
not want to contribute to institutions that allocate too much of the available
income to administrative or fundraising activities.
RESEARCH DESIGN
Sample
The data collection is based on an online platform called Charity Navigator
- the largest and most-utilized charity watchdog in the United States. Itself a
non-profit, this organization rates over 7,000 of the worthy charities in the
USA, using a 1-4 scale where 4 is the best performing and 1 the worst. Its
16
objective is to provide donors with the tools to make informed decisions as
of their investments in non-profit institutions. This platform is the chosen
for this study because it comprises the most detailed information about each
institution1. The advanced research availability of Charity Navigator
allowed me to find all the institutions rated by this platform within the
industry and parameters I selected for this study. Furthermore, major
American magazines like TIME Magazine, Forbes, Reader’s Digest and Kiplinger’s Financial Magazine as well as networks refer to it, approving its reliability. Besides having been profiled or quoted in nearly every major
American newspaper, it has also published editorials and articles on charity
accountability, the role of government regulation in the charitable sector,
fundraising ethics and non-profit leadership in such newspapers as The
Atlanta-Journal Constitution, The Chronicle of Philanthropy, The Seattle
Post-Intelligencer and the Los Angeles Times.
Charity Navigator assigns each charity to a category and cause, based on
several criteria. First they use the activity code each charity has to select
when they are filling their IRS forms within the 9 available: Animals; Arts,
Culture and Humanities; Education; Environment; Health; Human Services;
International; Public Benefit; Religion. Second, they assess the charity’s programmes and services to determine what a charity actually does and only
then assign it to a category. Within the Education activity code, the
institutions are divided into four broad groups: Universities, Graduate
Schools and Technological Institutes; Private Elementary and Secondary
Schools; Other Education Programs and Services; Private Liberal Arts
Colleges. This study focuses in the first category, which represents the
higher-education charities.
The sample is composed by 95 non-profit institutions in the USA. Although
these are not universities, they are organizations that are tied to the
provision or facilitation of access to higher-education. These institutions
1
17
include alumni associations, endowment funds that provide scholarships and
support research and publications, as well as organizations which objectives
that lay in improving teaching, and assisting the inclusion of any specific
ethnic/religious group.
The assessment of the platform of transparency and accountability based on
indicator variables is relatively recent so this study is only based on the last
3 years (2011-2013), to guarantee that the entire sample has the same data.
Methodology
In the first hypothesis, I state that the part of available income spent in
program expenses increases with the accountability and transparency
(Governance) as well as with the size and age (Characteristics) of a
charitable institution. In order to test this hypothesis, I estimate the
following model:
𝑃𝑟𝑜𝑔𝑟𝑎𝑚 𝐸𝑥𝑝𝑒𝑛𝑠𝑒𝑠 = 𝛽0+ ∑ 𝛽𝑖𝐶ℎ𝑎𝑟𝑎𝑐𝑡𝑒𝑟𝑖𝑠𝑡𝑖𝑐𝑠 + ∑ 𝛽𝑗𝐺𝑜𝑣𝑒𝑟𝑛𝑎𝑛𝑐𝑒 + 𝜀
(1)
The dependent variable (Program Expenses) is a measure that reflects what
proportion of the total budget a charity spends on the programs and services
it exists to deliver. This excludes administrative and organizational expenses
as well as fundraising expenses i.e. publicity, campaign printing, staffing
etc. Dividing a charity's program expenses by its total functional expenses
yields this measurement. Therefore it will vary between zero and one.
The Characteristics category includes three variables: age, religious
affiliation and size. I discuss them next:
Age – This variable is calculated by subtracting the current year of analysis and the foundation of the institution. On one hand, more
years of experience should increase the efficiency of the institution,
18
the level of organization, knowledge and experience of older
institutions is higher than that of new entrants to any market which
also decreases the need for expenditures on administrative staff
(Glisson and Martin, 1980). However, according to Glisson and
Martin (1980), “with increased evidence of survival ability, older organizations may be expected to relax a bit”. Given this, I cannot make any predictions about the sign of the estimated coefficient. Religious Affiliation (Rel)2 – This is an indicator variable coded as
one when the organization is affiliated with a religion and zero
otherwise. On the one hand, Wooten and Coker (2003) state that
"generally, leaders of religious NPOs (non-profit organizations) lack
a financial management background". I believe this may lead
organizations with this characteristic to be less efficient in their
expense allocation. On the other, they are also less likely to rely on
fundraising activities (Hodgkinson, 1999). That extra portion of
income may revert to the program. Therefore, once again I do not
make any predictions regarding the sign of the estimated coefficient. Size (LSize) – I use net assets as a proxy for this variable. Due to non-linearities, I convert it into million$ and take the logarithm of
the value. Hyndman and Mckillop (1999) report the existence of
significant economies of scale relative overhead. This implies that
larger organizations have a lower proportion of the expenses
allocated to overhead and bigger ones to the program. The authors
also find a positive correlation between size and the increase in
fundraising expenditures. This means that although expenses with
fundraising are higher in larger institutions, the proportions allocated
to the program is also greater. However, according to Glisson (1980), “human services organizations that are more highly centralized and formalized are also more productive and efficient in
terms of number of clients served and the cost of serving them”. On
2
19
the one side, according to his study, size reports a negative
correlation to centralization because an increase in differentiation
(into more divisions and departments) leads to decision making
authorities becoming more dispersed. On the other, he finds that
bigger institutions are also more formalized because “greater size leads to greater development and utilization of formalized rules, procedure and guidelines” (Glisson and Martin, 1980). This contradictory relationship makes the overall correlation between size
and efficiency, and consequently the sign of the coefficients, hard to
predict.
Governance has two sub-categories: Accountability and Transparency. A
manager who is better at allocating his resources should theoretically be
more willing to explain his actions or make all the critical data available.
Therefore, I expect to find a positive correlation between accountability and
transparency and the dependent variable Program Expenses, since this is
used as a proxy for efficiency.
Accountability can be defined as the obligation or willingness by a charity
to explain its actions to shareholders. This is measured by twelve indicator
variables, which signal the presence of good practices. Thus, I expect all of
them to have positive estimated coefficients. The variables are defined by
the Charity Navigator as follows:
Independent Voting Board Members (IndBoard) – The presence of an independent governing body is strongly recommended by many
industry professionals to allow for full deliberation and diversity of
thinking on governance and other organizational matters.
No Material Diversion of Assets (MDA) - A diversion of assets is described as any unauthorized conversion or use of the
organization's assets other than for the organization's authorized
purposes, including but not limited to embezzlement or theft. This
20
variable is coded as 1 if there has been no material diversion of
assets and as zero otherwise.
Audited financials prepared by independent accountant (IndAud) - Audited financial statements provide important information about
financial accountability and accuracy. They should be prepared by
an independent accountant with oversight from an audit committee.
(It is not necessary that the audit committee be a separate committee.
Often at smaller charities it falls within the responsibilities of the
finance committee or the executive committee). The committee
provides an important oversight layer between the management of
the organization, which is responsible for the financial information
reported, and the independent accountant, who reviews the financials
and issues an opinion based on its findings.
Does Not Provide Loan(s) to or Receive Loan(s) From related parties (Loan) - Making loans to related parties such as key officers,
staff, or board members, is not standard practice in the sector as it
diverts the charity's funds away from its charitable mission and can
lead to real and perceived conflict-of-interest problems. This practice
is discouraged by sector trade groups which point to the
Sarbanes-Oxley Act when they call for charities to refrain from making loans
to directors and executives. The IRS is concerned enough with the
practice that it requires charities to disclose on their Form 990 any
loans to or from current and former officers, directors, trustees, key
employees, and other "disqualified persons." Furthermore, some
state laws go so far as to prohibit loans to board members and
officers. And although employees and trustees are permitted to make
loans to charities, this practice can also result in real and/or
perceived conflict of interest problems for the charity. Furthermore,
it is problematic because it is an indicator that the organization is not
financially secure.
21
contemporaneous document exists for future reference. Charities are
not required to make their Board meeting minutes available to the
public.
Provided copy of Form 990 to organization's governing body in advance of filing (Copy) - Providing copies of the Form to the
governing body in advance of filing is considered a best practice, as
it allows for thorough review by the individuals charged with
overseeing the organization.
Conflict of Interest Policy (ConfInt) - Such a policy protects the organization, and by extension those it serves, when it is considering
entering into a transaction that may benefit the private interest of an
officer or director of the organization. Charities are not required to
share their conflict of interest policies with the public
Whistleblower Policy (WbP) - This policy outlines procedures for handling employee complaints, as well as a confidential way for
employees to report any financial mismanagement.
Records Retention and Destruction Policy (RDP) - Such a policy establishes guidelines for handling, backing up, archiving and
destruction of documents. These guidelines foster good record
keeping procedures that promotes data integrity.
CEO listed with salary (CEOS) - Charities are required to list their CEO's name and compensation on the new 990, an issue of concern for many donors. Charity Navigator’s analysts check to be sure that the charities complied with the Form 990 instructions and included
this information in their filing.
Process for determining CEO compensation (CEOC) - This process indicates that the organization has a documented policy that it
follows year after year. The policy should indicate that an objective
and independent review process of the CEO's compensation has been
conducted which includes benchmarking against comparable
22
Board Listed / Board Members Not Compensated (BoardComp) - The IRS requires that any compensation paid to members of the
charity's governing body be listed on the form 990. Furthermore, all
members of the governing body need to be listed whether or not they
are compensated. It is not unusual for some members of the board to
have compensation listed. The executive director of the organization
frequently has a seat on the board, for instance, and is compensated
for being a full time staff member. However, it is rare for a charity to
compensate individuals only for serving on its Board of Directors.
Although this sort of board compensation is not illegal, it is not
considered a best practice.
The second sub-category of Governance is Transparency, which can be
defined as an obligation or willingness by a charity to publish and make
available critical data about the organization. This is measured via five
indicator variables, coded as one in the presence of good practices. Thus, I
expect all of them to have positive estimated coefficients. The variables are
defined by the Charity Navigator as follows:
Donor Privacy Policy (DonPriv) - Donors have expressed extreme concern about the use of their personal information by charities and
the desire to have his information kept confidential. The sale of lists
for telemarketing and the mass distribution of "junk mail," among
other things, can be minimized if the charity assures the privacy of
its donors. Privacy policies are assigned to one of the following
categories:
o 0 - This charity does not have a written donor privacy policy
in place to protect their contributors' personal information.
o 1 - This charity has a written donor privacy policy published
on its website, which states unambiguously that (1) it will not
sell, trade or share a donor's personal information with
anyone else, nor send donor mailings on behalf of other
23
once the donor has given the charity specific permission to
do so.
Board Members Listed (Board) - Our analysts check to see if the charity lists Board members on its website. Publishing this
information enables donors and other stakeholders to ascertain the
make-up of the charity's governing body. This enables stakeholders
to report concerns to the Board.
Audited Financials (AudFin) – Charity Navigator checks the charity's website to see if it has published its audited financial
statements for the fiscal year represented by the most recently filed
IRS Form 990. It is important for donors to have easy access to this
financial report to help determine if the organization is managing its
financial resources well.
Form 990 (F990) - We check the charity's website to see if it has published its most recently filed IRS Form 990 (a direct link to the
charity's 990 on an external site is sufficient). It is important for
donors to have easy access to this financial report to help determine
if the organization is managing its financial resources well.
Key staff listed (KStaff) - It is important for donors and other stakeholders to know who runs the organization day-to-day. Charity
Navigator does not cross-check the leadership listed on the website
with that reported on the Form 990 because the latter often isn't
available until more than a year after the charity's fiscal year ends. In
that time, the charity's leadership may have changed and the charity
typically reflects those more recent changes on the website. In other
words, since the Form 990 isn't especially timely, it cannot be used
to verify the leadership information published on the charity's site.
In the second hypothesis, I state that revenues increase with the
accountability and transparency and vary as well with the Characteristics of
a charitable institution. I also formulate three sub-hypotheses: fundraising
expenses increase the revenues of a non-profit organization; there is
24
the increase in the proportion spent in overhead. In order to test the second
hypothesis as well as the three sub-hypotheses, I estimate the following
model:
𝑅𝑒𝑣𝑒𝑛𝑢𝑒𝑠𝑡 = 𝛽0+ ∑ 𝛽𝑖𝐶ℎ𝑎𝑟𝑎𝑐𝑡𝑒𝑟𝑖𝑠𝑡𝑖𝑐𝑠 + ∑ 𝛽𝑗𝐺𝑜𝑣𝑒𝑟𝑛𝑎𝑛𝑐𝑒
+ 𝛼1𝑅𝑒𝑣𝑒𝑛𝑢𝑒𝑠𝑡−1+ 𝛼2𝐹𝑢𝑛𝑑𝑟𝑎𝑖𝑠𝑖𝑛𝑔 𝐸𝑥𝑝𝑒𝑛𝑠𝑒𝑠
+∝3𝑂𝑣𝑒𝑟ℎ𝑒𝑎𝑑 + 𝜀
(2)
The dependent variable in this regression is the value of revenues of the
institution, which serves as a proxy for the ability or efficiency of a firm to
gather funds. Similarly to size, I also take the logarithm of this variable.
The characteristics category is divided into the same 3 variables: age,
religious affiliation and size, which are defined in the previous section. The
expectations regarding their relationship with the revenues are the
following:
Age - An older institution should be more recognized by the public, possibly increasing its ability to gather funds. However, older
institutions are expected to rely on this fact and be less aggressive in
marketing and publicity (Glisson, 1980). Therefore it is not clear
how the age of an organization influences its fund raising abilities
and I make no predictions of the sign of the estimated coefficient. Religious Affiliation (Rel) – If only people that share the same
religious values donate to such institutions, this should have a
negative impact on revenues. However, according to the literature
(Rose-Ackerman, 1996; Ben-Ner, 1994), the predicted donation per
donor is higher; so once again, the outcome is hard to predict.
Size (LSize) - According to Hyndman and Mckillop (1999), size has
a positive correlation to the increase in marketing expenses which
25
Besides, the bigger the institution the bigger the required donations
to survive. This leads me to predict a positive relation between
revenues and size and therefore a positive sign for the coefficients.
Governance, as well as its two sub-categories (Accountability and
Transparency), is described above. I expect them have a positive influence
on the institution’s ability to collect funds right now and in the future, i.e. its revenues.
I recall that the three sub-hypotheses proposed are: fundraising expenses
increase the revenues of a non-profit organization; there is autocorrelation in
the generation of revenues; and revenues decrease with the increase in the
proportion spends in overhead. The independent variables used to assess the
proposed sub-questions are the following:
Revenues(t-1) (LRev1) - is a lag variable and it is included in the Revenues regression to control for autocorrelation. I use the
logarithm, as in Revenues. I expect it to have a positive correlation to the institutions’ current revenues because I anticipate some consistency in this matter, i.e. an institution that in the previous year
had $1 million is expected to have more revenues this year than one
that only had $100.
Fundraising Expenses (LFund) - This measure reflects the logarithm
of the amount spent by a charity to raise money. Fundraising
expenses can include campaign printing, publicity, mailing, and
staffing and costs incurred in soliciting donations, memberships, and
grants. The purpose of incurring in these expenses is increasing
revenues. Therefore, I expect a positive sign in the predicted
coefficient.
Overhead (Ovhd) – This variable reflects a proportion of the expenses not spent in the program. It is calculated as one minus
programme expenses. Thus, it varies between zero and one. I expect
26
want to fund the projects the institutions propose to accomplish and
not other type of expenses, however necessary these may be
(Glassman and Spahn, 2012).
RESULTS AND DISCUSSION
Descriptive Statistics
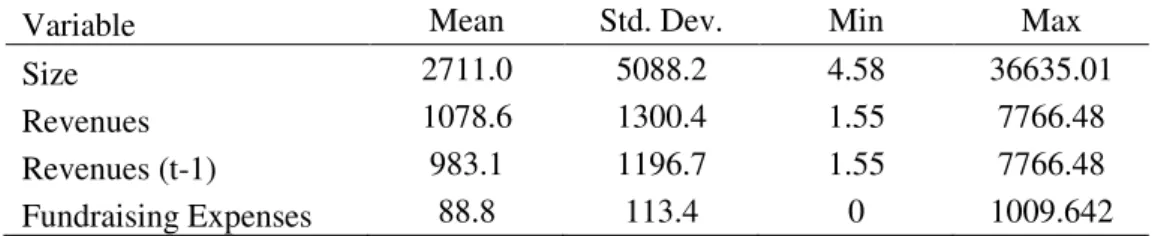
Table 1 reports the summary statistics of main variables.
Table 1: Summary Statistics of variables in USD ($millions)
As can be seen in Table 1, the average size is over $2.7 billion but this
variable ranges from $4.6 million to $36.6 billion. Revenues had a mean of
$1.08 billion. When I compare this to the revenues of the previous year, I
find that these have been increasing. Fundraising expenses amount, on
average, to $88.8 million, representing 8.2% of revenues.
Given the high standard deviations reported above, I do a more detailed
analysis of the variables. In figure 1, I show the distribution of the variables
Size and Revenues. The figure shows that the institutions that constitute the
sample of the study are not homogeneous and do not follow a normal
distribution. The high skewness and kurtosis of the variable Size, in
particular, indicates disparities in the sample. In fact, approximately 75% of
the sample is constituted by small institutions, with assets worth close to $2
billion. The observation with the largest value, however, has a size of $36.6
billion. The same, although in a less pronounced way, happens to the
variable Revenues. In Table a) and Table b) of the Appendix I present
further detail of the descriptive statistics of these variables.
Variable Mean Std. Dev. Min Max
Size 2711.0 5088.2 4.58 36635.01
Revenues 1078.6 1300.4 1.55 7766.48
Revenues (t-1) 983.1 1196.7 1.55 7766.48
27
Figure 1: Distribution of the variables Size and Revenues (in $.000)
I proceed by presenting the table of summary statistics of all the variables,
as used in the equations. I divide Table 2 into four groups: The first three
include variables that are common to both regressions and the fourth is
where I present the dependent variables and the variables required to
address the sub-hypothesis.
The first sector of Table 2 (characteristics category) presents data on Age,
Religious Affiliation and Size (logarithm). The average age of the
institutions is approximately 140 years and only about 24% are affiliated to
any particular religion. The distribution of the variable Size has been
analyzed above.
In the second sector of Table 2, I present the distribution of the
accountability variables. As can be seen, most of these are present in more than 90% of the sample, except for the variables: “Does Not Provide Loan(s) to or Receive Loan(s) From related parties” and “Records Retention and Destruction Policy” which are only present 66.3% and 86.7% of the observations, respectively. It is also relevant to notice that two of the
variables are always present. Given that they do not induce variation in the
28
Table 2: Summary Statistics of the variables in the sample
The transparency variables (Donor Privacy Policy, Board Members Listed,
Audited Financials, Form 990 and Key Staff), in Table 2, present more
variation. Most of the institutions have their board members (89.1%) as well
as their key staff (94.7%) listed. However, most of the analyzed
organizations do not provide to the donors an easy access of their latest
Variables Mean Std. Dev. Min Max
Age Age 139.916 58.972 9 376
Religious Affiliation Rel 0.242 0.429 0 1
Log (Size) LSize 6.768 1.620 1.521 10.509
Independent Voting Board Members IndB 0.996 0.059 0 1
No Material diversion of assets MDA 0.972 0.165 0 1
Audited financials prepared by
independent accountant IndAud 0.993 0.084 0 1
Does Not Provide Loan(s) to or
Receive Loan(s) From related parties Loans 0.663 0.473 0 1
Documents Board Meeting Minutes Minute 1.000 0.000 1 1
Provided copy of Form 990 to organization's governing body in advance of filing
CopyF 0.916 0.278 0 1
Conflict of Interest Policy CI 0.982 0.132 0 1
Whistleblower Policy WbP 0.947 0.224 0 1
Records Retention and Destruction
Policy RDP 0.867 0.341 0 1
CEO listed with salary CEOS 1.000 0.000 1 1
Process for determining CEO
compensation CEOC 0.979 0.144 0 1
Board Listed / Board Members Not
Compensated BComp 0.940 0.237 0 1
Donor Privacy Policy DonPriv 0.407 0.492 0 1
Board Members Listed BList 0.891 0.312 0 1
Audited Financials AudFin 0.509 0.501 0 1
Form 990 F990 0.105 0.307 0 1
Key staff listed KStaff 0.947 0.224 0 1
Program Expenses PExp 0.858 0.078 0.524 0.971
Overhead Ovhd 0.142 0.078 0.030 0.048
Log (Fundraising Expenses) LFund 3.615 1.709 -1.904 0.917
Log (Revenues) LRev 6.127 1.632 0.441 8.958
29
filling of the form 990 (only 10.5%). Close to half provide easy access to
the latest financial statements (50.9%) and only 40.7% are clear on their
website about their donor privacy policy.
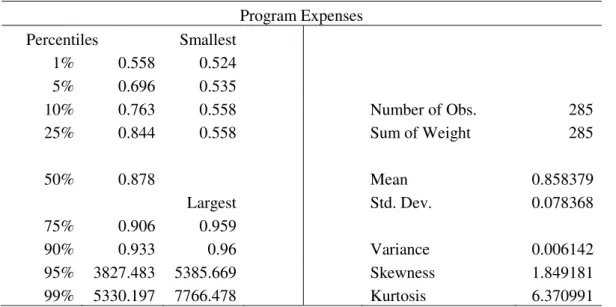
Table 2 also reveals that, on average, higher-education institutions allocate
85.8% of their expenses to the program they exist to provide. This variable
ranges from 52.4% to 97.1% of expenses. Thus, these organizations spend
on average 14.2% of their total spending in administration or fundraising
activities. In figure 2, I analyze the distribution of Program Expenses, which
has a negative skewness. In fact,75% of the sample employs more than 80%
of the money available into the program, but 5% still do not use more than
70% of their resources with the program. Further analysis on the distribution
can be found in Table c) of the Appendix.
Figure 2: Distribution of the variable Program Expenses
In table 3, I present a correlation matrix where the most significant results
are highlighted in bolt (significant at the 1% level). We can see that there is
a significant positive correlation between the age of an organization and the
variables Size, Revenues, Fundraising Expenses and Program Expenses.
This means that, older institutions tend to be bigger, have higher revenues,
and spend a higher amount in fundraising but a lower proportion of their
expenses in overhead. Religious affiliation has a significant negative
correlation with Size, Program Expenses and Revenues. Therefore, a
30
lower revenues and employ a smaller portion of its expenses into the
program (and thus, more into overhead).
It is also interesting to note in Table 3 that the two main dependent variables
of this study are significantly positively correlated (0.65). This indicates that
usually, organizations with higher revenues allocate a lower proportion of
their expenses to overhead and a greater one to the program.
Table 3: Correlation Matrix (Bold – correlation significant at the 1% level)
Estimation of Models
In table 4, I present the results of estimating my first model, where the value
of program expenses is the dependent variable.
When analyzing the results for the institution’ characteristics we see that only size and religious affiliation are associated with the value of program
expenses. The fact that an institution is bigger has a statistically significant
positive influence on the proportion of expenses allocated to the program.
This is aligned with Hyndman and Mckillop’s (1999) findings which indicate the existence of economies of scale regarding non-charitable
expenses (overhead) over total expenses. This study (Hyndman and
Mckillop, 1999), also reports that bigger institutions spend higher mounts
on fundraising activities which is also consistent with my results
(correlation between LFund and LSize of 0.7), presented in Table 3.
The dissimilarity of results when comparing to Glisson’s (1980) formalization and centralization theory may derive from the difference of
Age Rel LSize PExp LFund LRev Ovhd
Age 1
Rel -0.07 1
LSize 0.61 -0.25 1
PExp 0.33 -0.25 0.52 1
LFund 0.46 -0.14 0.70 0.65 1
LRev 0.51 -0.28 0.88 0.65 0.80 1
31
concepts of efficiency used. While I use the ratio of program expenses over
total expenses as a proxy, the author defines efficiency as the number of
clients served and the cost of serving them. In the case of higher education
non-profits, this definition may not be so easily applied and probably no
even the most accurate.
Table 4: Program Expenses regression3.
There is also evidence, in Table 4, that the institutions that are affiliated to a
religion have less expenditure allocated to the program, i.e. spend a higher
proportion of their budget in fund-raising activities and administrative
doings. Theoretically, the fact that an institution has some religious
3
The model is defined by equation (1). *Significant at the 10 percent level. **Significant at the 5 percent level. ***Significant at the 1 percent level.
Expectation
Program Expenses (1)
Age ? -0.000
Rel ? -0.028**
LSize ? 0.023***
IndB + -0.016
MDA + -0.008
IndAud + -0.022
Loans + -0.007
CopyF + -0.004
CI + -0.071
WbP + 0.064*
RDP + 0.010
CEOC + -0.014
BComp + -0.006
DonPriv + 0.023*
BList + 0.024
AudFin + -0.006
F990 + -0.020
KStaff + 0.006
_cons 0.757***
N 285
R-sq 0.3510
32
foundation or values should not influence how well their funds are applied.
However, the results show that there is a significant difference between
religious and non-religious organizations, corroborating Wooten and Coker
(2003) assumption that the leaders of religious non-profit organizations
were not always financially literate. However, there are other possible
explanations for this negative influence of the affiliation on the proportion
of program expenses. For example, the decision making department may
simply chose to apply a larger part of their available income into overhead
or, in some account, this may even be justified by what is considered by
each institution as a program expense. One of the almost constantly present
goals of religious institutions is the transmission of the values of their faith.
If the expenditures in doing so are not considered as direct program
expenses then these institution have an extra liability when compared to the
remaining organizations.
In what concerns the governance variables, results indicate that only two
variables are positively associated with our dependent variable: the fact that
an institution has a whistleblower policy and a donor privacy policy easily
accessible, as was previously expected.
In Table 5, I isolate the influence of each group of independent variables.
This reveals that when the accountability variables are considered
independently (in column (3)), two variables are statistically significant.
However, once all the groups are included, the variable “receive loan from related parties” loses its significance probably due to its correlation to one of the remaining variables. If we consider the only remaining significant
variable amongst this group as a proxy for accountability, we can conclude
that it increases the proportion of program expenses which was already
expected. According to the Charity Navigator:
“Generally speaking, charities that follow best practices in governance, donor relations and related areas are less likely to engage in unethical or
33
In the Transparency group, considering the only significant variable, donor
privacy policy, I determine that this variable also has a positive influence on
Program expenses. Also according to the Charity Navigator:
“(…) charities that are accountable and transparent are more likely to act with integrity and learn from their mistakes because they want donors to know that they're trustworthy.”
Table 5: Program Expenses’ Alternative Regression4.
4
*Significant at the 10 percent level. **Significant at the 5 percent level. ***Significant at the 1 percent level.
Program Expenses
(2) (3) (4) (5)
Age 0.000
Rel -0.024* -0.029**
LSize 0.023*** 0.023***
IndB -0.051
MDA -0.031
IndAud -0.005
Loans -0.034*** -0.004
CopyF 0.005
CI -0.070
WbP 0.089** 0.046**
RDP -0.014
CEOC -0.033
BComp -0.012
DonPriv 0.009 0.022**
BList 0.025
AudFin 0.011
F990 -0.043** -0.020
KStaff 0.039
_cons 0.704*** 1.004*** 0.794*** 0.665***
N 285 285 285 285
R-sq 0.29 0.09 0.063 0.325
34
Table 6shows the results of the estimation of the revenues model.
Table 6: Log (Revenues) regression5
Regression (1) tests hypothesis 2. It shows the influence of the characteristics, accountability and transparency in the institutions’ revenues. At the 1% level of confidence only Size has a statistically significant
association with revenues. As would be expected, the association is positive.
Larger institutions only became so with large donations in the past. As such,
5
The model is defined by equation (2). *Significant at the 10 percent level. **Significant at the 5 percent level. ***Significant at the 1 percent level.
Expectation (1) (2) (3) (4)
LRev1 + 0.892*** 0.767*** 0.745***
Ovhd - -0.012 -0.193 -0.182
LFund + 0.107*** 0.104*** 0.114***
Age ? -0.001 -0.001 -0.001
Rel ? -0.259* -0.065 -0.072
LSize + 0.849*** 0.145*** 0.158***
IndB + -0.412 -0.369
MDA + -0.735** -0.152
IndAud + -0.345 0.032
Loans + -0.182 0.017
CopyF + 0.057 0.019
CI + -0.593 -0.216
WbP + 0.432 0.058
RDP + 0.052 0.029
CEOC + -0.232 0.041
BComp + -0.039 0.104
DonPriv + -0.023 -0.021
BList + 0.446** 0.027
AudFin + 0.030 0.012
F990 + -0.400* -0.103
KStaff + -0.465 -0.118
_cons 2.580* 0.359* 0.255 0.833
N 285 285 285 285
R-sq 0.806 0.953 0.957 0.959