DOI: 10.1590/0004-282X20160005
ARTICLE
Extratemporal abnormalities in phosphorus
magnetic resonance spectroscopy of patients
with mesial temporal sclerosis
Anormalidades extratemporais na espectroscopia de fósforo por ressonância magnética
em pacientes com esclerose mesial temporal
Eun Joo Park1, Maria Concepción Garcia Otaduy1, Katarina Paz de Lyra1, Celi Santos Andrade1, Luiz Henrique
Martins Castro2, Valmir Passarelli2, Rosa Maria Figueiredo Valerio2, Carmen Lisa Jorge2, Miriam Harumi Tsunemi3,
Claudia da Costa Leite1
Temporal lobe epilepsy (TLE) is the most common form of ep-ilepsy in adult patients and the mesial temporal sclerosis (MTS) is the most frequent entity associated with medically refractory TLE. MTS is characterized by selective neuronal loss in CA1, CA3 and the dentate gyrus of the hippocampus. MTS may also involve the amygdala, parahippocampal gyrus, and entorhinal cortex. More widespread temporal lobe involvement may also occur1.
Previous studies have discovered metabolic dysfunction in the temporal and extratemporal regions in mesial temporal
sclerosis. Interictal 18-FDG-PET studies in MTS2 have shown ipsi-
and contralateral decreased glucose metabolism not only in the temporal lobe but also in the basal ganglia3 and frontal lobes4.
hese indings are in agreement with proton magnetic resonance
spectroscopy (1H-MRS), phosphorous magnetic resonance
spec-troscopic imaging (31P- MRS)5 and single-photon emission
com-puted tomography (SPECT)6 studies in which extensive temporal
and extratemporal structural and metabolic involvement in epi-lepsy has been associated with MTS.
1Universidade de São Paulo, Faculdade de Medicina, Departamento de Radiologia, Sao Paulo SP, Brazil;
2Universidade de São Paulo, Faculdade de Medicina, Departamento de Neurologia, Sao Paulo SP, Brazil;
3Universidade Estadual Paulista Júlio de Mesquita Filho, Instituto de Biociências, Botucatu SP, Brazil.
Correspondence: Eun Joo Park; Rua Aimbere, 909 / apt.24; 05018-011 Sao Paulo SP, Brasil; E-mail: [email protected] Conflict of interest: There is no conlict of interest to declare.
Received 19 June 2015; Received in inal form 04 October 2015; Accepted 26 October 2015. ABSTRACT
Objective: We evaluated extratemporal metabolic changes with phosphorus magnetic resonance spectroscopy (31P-MRS) in patients with
unilateral mesial temporal sclerosis (MTS). Method: 31P-MRS of 33 patients with unilateral MTS was compared with 31 controls. The voxels
were selected in the anterior, posterior insula-basal ganglia (AIBG, PIBG) and frontal lobes (FL). Relative values of phosphodiesters- PDE, phosphomonoesters-PME, inorganic phosphate - Pi, phosphocreatine- PCr, total adenosine triphosphate [ATPt = g- + a- + b-ATP] and the ratios PCr/ATPt, PCr/g-ATP, PCr/Pi and PME/PDE were obtained. Results: We found energetic abnormalities in the MTS patients compared to the controls with Pi reduction bilaterally in the AIBG and ipsilaterally in the PIBG and the contralateral FL; there was also decreased PCr/g-ATP in the ipsilateral AIBG and PIBG. Increased ATPT in the contralateral AIBG and increased g-ATP in the ipsilateral PIBG were
detected. Conclusion: Widespread energy dysfunction was detected in patients with unilateral MTS.
Keywords: phosphorus spectroscopy, magnetic resonance imaging, neurometabolism, mesial temporal sclerosis, epilepsy. RESUMO
Objetivo: Nós avaliamos as alterações metabóblicas através da espectroscopia de fósforo por ressonância magnética (31P-MRS) em
pacientes com esclerose mesial temporal (EMT) unilateral. Método: 31P-MRS de 33 pacientes com EMT unilateral foram comparadas aos de
31 controles. Foram selecionados os voxels nas regiões insulonuclear anterior e posterior (RINA e RINP) e frontal (RF). Os valores relativos de fosfodiésteres – PDE, fosfomonoésteres- PME, fosfato inorgânico- Pi, fosfocreatina –PCr, adenosina trifosfato total [ATPt = g- + a- + b-ATP] e as razões PCr/ATPt, PCr/g-ATP, PCr/Pi e PME/PDE foram obtidas. Resultados: Nós encontramos anormalidades em pacientes com EMT em comparação aos controles. Redução de Pi nas RINA bilateralmente, RINP ipsilateral e RF contralateral, redução de PCr/g-ATP nas RINA e RINP ipsilaterais foram detectadas. Aumentos de ATPT na RINA contralateral e aumento de g-ATP na RINP ipsilateral também foram encontradas. Conclusão: Disfunção energética difusa foi encontrada em pacientes com EMT unilateral.
1H-MRS studies have reported decreased
N-acetylaspartate/creatine (NAA/Cr) in ipsilateral mesial
temporal structures compared to the contralateral side and to controls7,8 with 87% sensitivity, 92% speciicity and later
-alization in 86% of patients9,10. Signiicant decreases in the
NAA/Cr ratio were also found in the contralateral hippocam-pus and thalami11, as well as in the frontal, parietal and
occip-ital lobes bilaterally compared to control group7. hese ind
-ings were more pronounced in the ipsilateral hemispheres
of MTS patients compared to controls7. Patients who
pre-sented with bitemporal or extratemporal abnormalities on
18-FDG-PET and 1H-MRS have poorer surgical outcomes12
and more severe cognitive impairment4 than patients who
presented with unilateral temporal changes.
Phosphorous magnetic resonance spectroscopic
im-aging (31P- MRS) allows a non-invasive measurement of
the phosphorus metabolites related to the energy state and membrane composition as well as an evaluation of mitochondrial function, considering that ATP is mainly generated by mitochondria13.
Previous studies have investigated the lateralizing abil-ity of 31P-MRS in patients with TLE. hese studies found re
-duced PCr/Pi and PCr/ATP ratios in the temporal lobes, which was more pronounced ipsilaterally, allowing for cor-rect seizure focus lateralization in 70 to 73% of cases14. In
extratemporal locations, decrease of PCr/g-ATP ratio in the patient’s ipsilateral parietal gray matter compared to the
same region in controls14 and reduced PCr/ATP ratios were
found bilaterally in the hippocampi and ipsilaterally in the thalamus and striatum15.
he temporal lobe metabolic abnormalities were well char -acterized by the methods mentioned above however, further characterization of the extratemporal abnormalities in MTS, specially considering the information that 31P- MRS can provide,
can facilitate our understanding of the extent of metabolic dys-function and their role in refractoriness to clinical treatment, as well as of the cognitive and psychiatric impairment associated
with refractory epilepsy. his characterization may also contrib -ute for predicting the postoperative outcome.
here are few reports in the literature regarding 31P-MRS
in patients with MTS, most of which with small sample sizes,
some performed in low magnetic ield. he aim of this study
was to use 31P- MRS to evaluate extratemporal metabolic
changes in a strict, large selection of patients with refractory epilepsy related to unilateral MTS.
METHOD
Subjects
We analyzed a consecutive series of patients with TLE secondary to unilateral MTS. Diagnosis of TLE was
estab-lished by MRI and EEG indings. Brain MRI indings of uni -lateral hippocampal volume loss on T1-weighted images
and increased signal intensity on T2-weighted and/or FLAIR images, without other MRI lesions except minor white mat-ter changes on T2 or FLAIR sequences, also supported the diagnosis of MTS. All patients presented with medically re-fractory epilepsy and were in the process of surgical evalu-ation. All patients underwent prolonged video-EEG moni-toring with recording of at least one epileptic seizure and had electrographic onset in the temporal lobe. Patients with other neurological or active psychiatric disease, previous or current ethanol abuse and comorbidity with nonepileptic
psychogenic seizures were excluded.Healthy controls,
ful-illing the other inclusion and exclusion criteria served as a
control group.
We studied 33 patients (20 women, age range 23 to 55 years, mean age 35.9 ± 9.7 years) and 31 controls (19 women, age range 18 to 53 years, mean age 32.5 ± 9.9 years). All pa-tients reported being seizure–free for at least 48 hours prior to MRS examination.
he institution ethics committee approved this study. All
patients and controls signed the approved informed consent form prior to study enrollment.
31P-MRS
hree-dimensional (3D) 31P-MRS was performed on an
Intera Achieva 3.0 T system (Philips, Best, he Netherlands)
using a double-tuned 31P/1H head coil (AIRI, Cleveland, USA).
A T1-fast ield echo axial sequence was acquired (TR = 7.6 ms; TE = 3.7 ms; lip angle = 8°; isotropic 1-mm3 resolution) with
sagittal and coronal plane reconstructions.
31P-MRS acquisition was based on a pulacquire type
se-quence (TE/TR = 0.31 ms/5093 ms), using an adiabatic pulse, broadband decoupling (power factor = 0.4; ofset = 100 Hz)
and an automatic shimming procedure. Saturation bands were placed around the grid to avoid muscle
contamina-tion. he total ield of view was 180 x 210 x 120 mm (right to
left x anterior to posterior x superior to inferior), divided into six slices with six columns and seven lines each, resulting in 30 x 30 x 20 mm individual voxels. Following 31P-MRS
acquisi-tion, low resolution T1 images (TR = 9.4 ms; TE = 4.6 ms; lip angle = 8°; section thickness = 3 mm) were obtained to ensure
the same head location throughout the examination. he to -tal exam time was 43 minutes.
Spectral processing and quantiication were performed
with jMRUI software using the AMARES algorithm16. he
postprocessing included truncation of the irst two data
points to reduce the baseline broadline component distortion
efects. Starting values for line-width constraints, chemical shifts and J coupling were used as prior knowledge in the it
-ting algorithm. Zero- and irst-order phase corrections were applied for convergence during spectral itting.
hese steps were repeated for all analyzed voxels and
were always performed by the same investigator.
he relative values of each metabolite divided by the sum of all
inorganic phosphate - Pi, phosphocreatine- PCr, total adenosine triphosphate [ATPt = g- + a- + b-ATP]), as well as the metabolite ratios PCr/ATPt,PCr/g-ATP, PCr/g-ATP, PCr/Pi and PME/PDE,
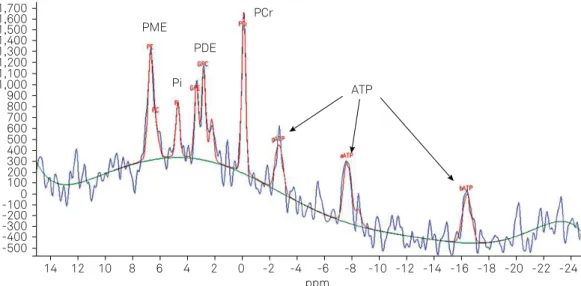
were obtained for patients and controls. A typical 31P- MRS is
presented in Figure 1.
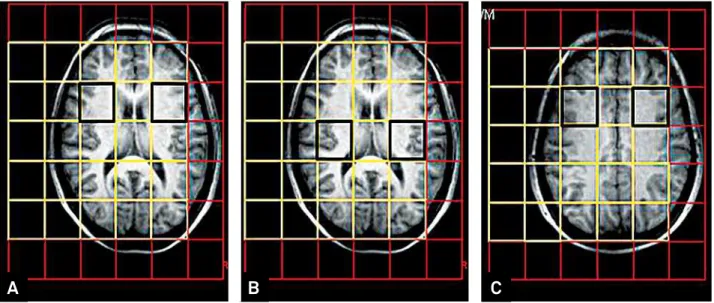
Although a large number of voxels was obtained, to avoid multiple comparisons errors, muscle contamination and to provide reproducibility, the most homologous voxels in the
basal ganglia and frontal lobes were analyzed. herefore, we selected the anterior insula-basal ganglia (AIBG) regions, pos
-terior insula-basal ganglia (PIBG) regions and frontal lobes (FL)
voxels (Figure 2), located ipsi- or contralaterally to the MTS.
Statistical analysis
All metabolite measurements and studied ratios of each selected voxel for the patients were compared to the average values of controls.
he t test was used to compare groups; p < 0.05 was con
-sidered statistically signiicant. Statistical analyses were performed with the SPSS version 17.0.1 software package
(SPSS Inc., Chicago, IL, U.S.A.).
RESULTS
Twenty patients with left MTS and 13 patients with right MTS were studied.
In the ipsilateral AIBG, we found reduced Pi (patients = 0.081 vs. controls = 0.089, p = 0.009) and PCr/ g-ATP
(patients = 1.966 vs. controls = 2.146, p = 0.027) in the patients
compared to controls (Table 1).
In the contralateral AIBG, we detected reduced Pi (pa
-tients = 0.082 in patients vs. controls = 0.089, p = 0.013) and increased total ATP (patients = 0.298 vs. controls = 0.286, p = 0.026) in the patients compared to controls (Table 2).
Table 1. Comparison of the metabolite proile in the ipsilateral regions.
Location Metabolites and ratios
Patients Controls
p-value
mean SD mean SD
AIBG Pi 0.081 0.013 0.089 0.007 0.009 PCr 0.194 0.017 0.198 0.014 0.289 g-ATP 0.100 0.014 0.094 0.011 0.071 ATPT 0.293 0.022 0.286 0.018 0.165 PCr/ATPT 0.668 0.100 0.699 0.081 0.183 PCr/g-ATP 1.966 0.310 2.146 0.327 0.027 PCr/Pi 2.465 0.599 2.264 0.235 0.081 PME 0.173 0.017 0.174 0.014 0.706 PDE 0.196 0.018 0.194 0.015 0.616 PME/PDE 0.889 0.133 0.903 0.086 0.604 PIBG Pi 0.077 0.011 0.083 0.008 0.009 PCr 0.197 0.017 0.200 0.012 0.520 g-ATP 0.098 0.009 0.093 0.009 0.024 ATPT 0.294 0.019 0.286 0.019 0.080 PCr/ATPT 0.674 0.085 0.704 0.075 0.132 PCr/g-ATP 2.023 0.249 2.194 0.306 0.017 PCr/Pi 2.629 0.533 2.437 0.303 0.081 PME 0.167 0.013 0.168 0.011 0.739 PDE 0.206 0.015 0.207 0.016 0.736 PME/PDE 0.817 0.088 0.819 0.082 0.929
FL Pi 0.088 0.012 0.093 0.010 0.106
PCr 0.195 0.021 0.195 0.015 0.941 g-ATP 0.102 0.014 0.101 0.011 0.977 ATPT 0.296 0.019 0.303 0.016 0.121 PCr/ATPT 0.663 0.107 0.645 0.069 0.420 PCr/g-ATP 1.969 0.418 1.957 0.303 0.892 PCr/Pi 2.252 0.443 2.139 0.279 0.233 PME 0.175 0.017 0.173 0.012 0.689 PDE 0.185 0.018 0.180 0.016 0.261 PME/PDE 0.954 0.131 0.971 0.099 0.560 AIBG: anterior insula-basal ganglia regions; PIBG: posterior insula-basal ganglia regions; FL: frontal lobes. g-ATP: gamma adenosine triphosphate; Pi: inorganic phosphate; PCr: phosphocreatine; PDE: phosphodiesthers-; PME: phosphomonoesthers-; ATPt: total adenosine triphosphate;
SD: standard deviation; p-value obtained with student’s t-test.
ppm ATP PCr
PME PDE Pi 1,700
1,600 1,500 1,400 1,300 1,200 1,100 1,000 900 800 700 600 500 400 300 200 100 0 -100 -200 -300 -400 -500
14 12 10 8 6 4 2 0 -2 -4 -6 -8 -10 -12 -14 -16 -18 -20 -22 -24
Figure 1. Normal 31P- MRS: PCr (phosphocreatine ), Pi (inorganic phosphate), g-, a-, b-ATP (adenosine triphosphate) representing
In the ipsilateral PIBG, we found reduced Pi (pa
-tients = 0.077 vs. controls = 0.083, p = 0.009) and PCr/g-ATP
(patients = 0.249 vs. controls = 0.286, p = 0.017) as well as in -creased g-ATP (patients = 0.098 vs. controls = 0.093, p = 0.024) in the patients compared to controls (Table 1).
In the contralateral FL, we found reduced Pi in the patients
compared to controls (patients = 0.087 vs. controls = 0.090, p = 0.014) (Table 2).
The PCr, PCr/ATPT, PCr/Pi, PME, PDE and PME/PDE
values in the patients were not significantly different from controls.
No signiicant diferences were found between the pa
-tients and controls in the contralateral PIBG (Table 2) and in
the ipsilateral FL (Table 1) for any of the metabolites or ratios.
DISCUSSION
We found extratemporal energy metabolism abnormality in patients with unilateral MTS.
More extensive metabolic changes involving Pi and PCr/g-ATP in the AIBG and PIBG were identiied. In the FL,
the indings were less prominent; the Pi decrease was the
only metabolic abnormality noted in the contralateral FL, while none of the metabolites or ratios were abnormal in the ipsilateral FL.
31P –MRS relects ive primary resonance groups related
to the energy metabolism and membrane turnover. PCr, Pi
and ATP (encompassing g-, a- and b-ATP) are related to the
energetic pool. PCr acts as an energy reservoir. Upon energy demand, PCr donates a phosphate group to adenoside di-phosphate (ADP), which allows for ATP synthesis. Inversely, in resting states and ATP excess, PCr is produced. ATP is the main energy source for the majority of cellular functions and it is predominately generated by oxidative phosphorylation
Table 2. Comparison of the metabolite proile in the contralateral regions.
Location Metabolites and ratios
Patients Controls
p-value
mean SD mean SD
AIBG Pi 0.082 0.011 0.089 0.007 0.013
PCr 0.194 0.017 0.198 0.014 0.369 g-ATP 0.099 0.013 0.094 0.011 0.101 ATPT 0.298 0.025 0.286 0.018 0.026 PCr/ATPT 0.659 0.105 0.699 0.081 0.096 PCr/g-ATP 1.996 0.376 2.146 0.327 0.095 PCr/Pi 2.409 0.447 2.264 0.235 0.108 PME 0.172 0.016 0.174 0.016 0.434 PDE 0.197 0.021 0.194 0.019 0.506 PME/PDE 0.886 0.163 0.903 0.104 0.184
PIBG Pi 0.082 0.010 0.083 0.008 0.488
PCr 0.195 0.015 0.200 0.012 0.219 g-ATP 0.096 0.013 0.093 0.009 0.300 ATPT 0.296 0.024 0.286 0.019 0.074
PCr/ATPT 0.668 0.100 0.704 0.075 0.103 PCr/g-ATP 2.087 0.403 2.194 0.306 0.240 PCr/Pi 2.424 0.372 2.437 0.303 0.879 PME 0.167 0.014 0.168 0.011 0.601 PDE 0.206 0.019 0.207 0.016 0.877 PME/PDE 0.816 0.126 0.819 0.082 0.910
FL Pi 0.087 0.010 0.093 0.01 0.014
PCr 0.187 0.015 0.195 0.015 0.051 g-ATP 0.103 0.014 0.101 0.011 0.741 ATPT 0.307 0.020 0.303 0.016 0.430 PCr/ATPT 0.613 0.077 0.645 0.069 0.087 PCr/g-ATP 1.869 0.354 1.957 0.303 0.291 PCr/Pi 2.199 0.363 2.139 0.279 0.468 PME 0.174 0.017 0.173 0.012 0.789 PDE 0.185 0.019 0.180 0.016 0.294 PME/PDE 0.958 0.171 0.971 0.099 0.709 AIBG: anterior insula-basal ganglia regions; PIBG: posterior insula-basal ganglia regions; FL: frontal lobes. g-ATP: gamma adenosine triphosphate; Pi: inorganic phosphate; PCr: phosphocreatine; PDE: phosphodiesthers-; PME: phosphomonoesthers-; ATPt: total adenosine triphosphate;
SD: standard deviation; p-value obtained with student’s t-test.
Figure 2. Location of the selected voxels. (A) Anterior insula-basal ganglia (AIBG) regions. (B) Posterior insula-basal ganglia (PIBG) regions (C). Frontal lobes (FL).
in the mitochondria17. he PCr/ATP ratio serves as a ro
-bust bioenergetics measure, relecting the cellular energet
-ic demand and production5. Pi represents a mixture of the
phosphoric acid ions; the concentration of Pi increases upon
high energy demand or cellular damage13.
While PME represents membrane anabolism, PDE
relects membrane catabolism. Two metabolites from
each are detectable in higher resolution spectra: PME is composed of phosphocholine and phosphoethanolamine, while PDE is composed of glycerophosphocholine and
glyc-erophosphoethanolamine. he PME/PDE ratio indicates
the membrane turnover13.
Previous 31P-MRS studies discovered energetic changes in
the mesial portion of the temporal lobe in MTS patients, with
reduced PCr/Pi, PCr/ATP and g-ATP/Pi ratios in the
epilep-togenic mesial temporal region compared to controls and to
the contralateral temporal lobe15. Regarding other
metabo-lites, an increased Pi concentration and reduced PME levels were found ipsilateral to the epileptogenic focus18,19.
In extratemporal locations, Chu et al. using 31P-MRS found
a decreased PCr/g-ATP ratio in the patient’s ipsilateral pari-etal gray matter compared to the same region in controls14.
Pan et al found reduced PCr/ATP ratios in the hippocampi
bilaterally and in the thalamus and striatum ipsilaterally in pa-tients with unilateral medically refractory mesial TLE15.
he decreased PCr/ATP ratio observed in this study re
-lects high energy demand, in line with previous 31P-MRS
studies which investigated MTS14,15.
Interictal Pi decrease and ATP increase detected in extra-temporal sites could be a consequence of frequent seizures and represent a compensatory mechanism to high energetic
consumption during the ictal period. he ictal period is char -acterized by reduced PCr and ATP and increased Pi in animal models and in studies with humans20,21.
It is possible that mitochondrial injury represents the un-derlying basis of the 1H-MRS and 31P-MRS metabolic changes
seen in MTS patients considering that NAA is synthesized only in neuronal mitochondria22 and it is strongly correlated
with oxidative metabolism23 and disturbances in energy
me-tabolism were the main inding in previous 31P-MRS studies.
Mitochondrial oxidative stress and dysfunction appear to represent not only a consequence of seizures but may indeed
be related to epileptogenesis24. Epilepsy frequently occurs in
association with inherited mitochondrial disorders, such as myoclonic epilepsy and mitochondrial encephalomyopathy, lactic acidosis, and stroke-like episodes25, which is additional
evidence that mitochondrial dysfunction has a role in
epilep-sy. Furthermore, mice that are partially deicient in a critical
mitochondrial antioxidant have a decreased seizure thresh-old26. Other evidence for the role of mitochondrial
dysfunc-tion in seizure generadysfunc-tion in humans is the increased preva-lence of epilepsy with aging. Mitochondrial oxidative stress is a well established mechanism of aging and age-related de-generative disease27.
Our study is limited by the size of the MRS voxels with contamination from the surrounding structures, especially considering that the number of phase encoding steps was limited by the time of scanning. Only patients with MTS were studied, thus it is unclear if this abnormality is typical of MTS or can happen in other epilepsies. All the patients in our sample were receiving multiple epilepsy drugs and
were scheduled for surgery due to refractoriness; therefore
no attempt was made to stratify them according to medical therapy. Another limitation is that the absence of seizure was questionnaire based instead of EEG proven in the 48 hours
prior to exam. herefore internal and external validities were
limited by the aforementioned shortcomings.
It is currently unknown whether the control of refractory
epilepsy with medication or after epilepsy surgery will result in normalization of energy metabolism parameters. It is also unclear whether the correction of metabolic abnormalities may contribute to seizure control and improvement of the cognitive and psychiatric symptoms of refractory epilepsy.
Future studies should investigate the correlation between energetic changes and other factors associated with refrac-tory epilepsy, such as seizure severity, epilepsy features and etiologies, cognitive and psychiatric complications and the postoperative outcome.
A better understanding of the energy dysfunction proile
may elucidate the features associated with refractoriness and brain dysfunction associated with chronic epilepsy.
In conclusion, our results indicate extratemporal ener-getic dysfunction in patients with epilepsy associated with unilateral MTS.
References
1. Falconer M, Serafetinides E, Corsellis J. Etiology and pathogenesis of temporal lobe epilepsy. Arch Neurol. 1964;10(3):233-48. doi:10.1001/archneur.1964.00460150003001
2. Engel J, Brown WJ, Kuhl DE, Phelps ME, Mazziotta JC, Crandall PH. Pathological indings underlying focal temporal lobe
hypometabolism in partial epilepsy. Ann Neurol. 1982;12(6):518-28. doi:10.1002/ana.410120604
3. Bouilleret V, Semah F, Chassoux F, Mantzaridez M, Biraben A, Trebossen R et al. Basal ganglia involvement in temporal lobe epilepsy: a functional and morphologic study. Neurology. 2008;70(3):177-84. doi:10.1212/01.wnl.0000297514.47695.48
5. Pan JW, Williamson A, Cavus I, Hetherington HP, Zaveri H, Petroff OAC et al. Neurometabolism in human epilepsy. Epilepsia. 2008;49(Suppl s3):31-41. doi:10.1111/j.1528-1167.2008.01508.x
6. Pillai JJ, Williams HT, Faro S. Functional imaging in temporal lobe epilepsy. Semin Ultrasound CT MR. 2007;28(6):437-50. doi:10.1053/j.sult.2007.09.006
7. Capizzano AA, Vermathen P, Laxer KD, Matson GB, Maudsley AA, Soher BJ et al. Multisection proton MR spectroscopy for mesial temporal lobe epilepsy. AJNR Am J Neuroradiol. 2002;23(8):1359-68.
8. Cendes F, Caramanos Z, Andermann F, Dubeau F, Arnold DL. Proton magnetic resonance spectroscopic imaging and magnetic resonance imaging volumetry in the lateralization of temporal lobe epilepsy: a series of 100 patients. Ann Neurol. 1997;42(5):737-46. doi:10.1002/ana.410420510
9. Connelly A, Jackson GD, Duncan JS, King MD, Gadian DG. Magnetic resonance spectroscopy in temporal lobe epilepsy. Neurology. 1994;44(8):1411-7. doi:10.1212/WNL.44.8.1411
10. Kuzniecky R, Hugg JW, Hetherington H, Butterworth E, Bilir E, Faught E et al. Relative utility of 1H spectroscopic imaging and hippocampal volumetry in the lateralization of mesial temporal lobe epilepsy. Neurology. 1998;51(1):66-71. doi:10.1212/WNL.51.1.66
11. Hetherington HP, Kuzniecky RI, Vives K, Devinsky O, Pacia S, Luciano D et al. A subcortical network of dysfunction in TLE measured by magnetic resonance spectroscopy. Neurology. 2007;69(24):2256-65. doi:10.1212/01.wnl.0000286945.21270.6d
12. Kuzniecky R, Hugg J, Hetherington H, Martin R, Faught E, Morawetz R et al. Predictive value of 1H MRSI for outcome in temporal lobectomy. Neurology. 1999;53(4):694-8.
13. Menuel C, Guillevin R, Costalat R. Perrin M, Sahli-Amor M, Martin- Duverneuil N et al. Phosphorus magnetic resonance spectroscopy: brain pathologies applications. J Neuroradiol. 2010;37(2):73-82. doi:10.1016/j.neurad.2009.07.001
14. Chu WJ, Hetherington HP, Kuzniecky RI, Simor T, Mason GF, Elgavish GA. Lateralization of human temporal lobe epilepsy by 31P NMR spectroscopic imaging at 4.1 T. Neurology. 1998;51(2):472-9. doi:10.1212/WNL.51.2.472
15. Pan JW, Kim JH, Cohen-Gadol A, Pan C, Spencer DD, Hetherington HP. Regional energetic dysfunction in hippocampal epilepsy. Acta Neurol Scand. 2005;111(4):218-24. doi:10.1111/j.1600-0404.2005.00398.x
16. Vanhamme L, Boogaart A, Van Huffel S. Improved method for accurate and eficient quantiication of MRS data with use of prior knowledge. J Magn Reson. 1997;129(1):35-43. doi:10.1006/jmre.1997.1244
17. Erecińska M, Silver IA. ATP and brain function. J Cereb Blood Flow Metab. 1989;9(1):2-19. doi:10.1038/jcbfm.1989.2
18. Hugg JW, Laxer KD, Matson GB, Maudsley AA, Husted CA, Weiner MW. Lateralization of human focal epilepsy by 31P magnetic resonance spectroscopic imaging. Neurology. 1992;42(10):2011-8. doi:10.1212/WNL.42.10.2011
19. Grond J, Gerson JR, Laxer KD, Hugg JW, Matson GB, Weiner MW. Regional distribution of interictal 31P metabolic changes in patients with temporal lobe epilepsy. Epilepsia. 1998;39(5):527-36.
20. Petroff OA, Prichard JW, Behar KL, Alger JR, Shulman RG. In vivo phosphorus nuclear magnetic resonance spectroscopy in status epilepticus. Ann Neurol. 1984;16(2):169-77. doi:10.1002/ana.410160203
21. Younkin DP, Delivoria-Papadopoulos M, Maris J, Donlon E, Clancy R, Chance B. Cerebral metabolic effects of neonatal seizures measured with in vivo 31P NMR spectroscopy. Ann Neurol. 1986;20(4):513-9. doi:10.1002/ana.410200412
22. Patel TB, Clark JB. Synthesis of N-acetyl-L-aspartate by rat brain mitochondria and its involvement in mitochondrial/cytosolic carbon transport. Biochem J. 1979;184(3):539-46. doi:10.1042/bj1840539
23. Heales SJ, Davies SE, Bates TE, Clark JB. Depletion of brain glutathione is accompanied by impaired mitochondrial function and decreased N-acetyl aspartate concentration. Neurochem Res. 1995;20(1):31-8. doi:10.1007/BF00995149
24. Waldbaum S, Patel M. Mitochondria, oxidative stress, and temporal lobe epilepsy. Epilepsy Res. 2010;88(1):23-45. doi:10.1016/j.eplepsyres.2009.09.020
25. Shoffner JM, Lott MT, Lezza AM, Seibel P, Ballinger SW, Wallace DC. Myoclonic epilepsy and ragged-red iber disease (MERRF) is associated with a mitochondrial DNA tRNA(Lys) mutation. Cell. 1990;61(6):931-7. doi:10.1016/0092-8674(90)90059-N
26. Yamamoto H, Tang HW. Preventive effect of melatonin against cyanide-induced seizures and lipid peroxidation in mice. Neurosci Lett. 1996;207(2):89-92. doi:10.1016/0304-3940(96)12493-9