O
ri
gi
na
l
a
rt
ic
le
s
Quality of life and associated morbidities among elderly persons
registered with the Family Health Strategy of Senador Guiomard in
the state of Acre
Thatiana Lameira Maciel Amaral1
Cledir de Araújo Amaral2
Patrícia Rezende do Prado1
Nathália Silva de Lima1
Patrícia Vasconcelos Herculano1
Gina Torres Rego Monteiro3
1 Universidade Federal do Acre, Centro de Ciências da Saúde e do Desporto. Rio Branco, Acre, Brasil.
2 Instituto Federal do Acre. Rio Branco, Acre, Brasil.
3 Fundação Oswaldo Cruz – Escola Nacional de Saúde. Rio de Janeiro, RJ, Brasil.
Correspondence
Thatiana Lameira Maciel Amaral E-mail: [email protected]
Abstract
Objectives:To verify the prevalence of a low quality of life and analyze the morbidities associated with such a condition among elderly persons registered with the Family Health Strategy of the municipality of Senador Guiomard. Method: A cross-sectional study was performed of elderly persons registered with the Family Health Strategy in the urban area of the municipality of Senador Guiomard in the state of Acre. A comparison between men and women regarding morbidities and quality of life was performed using Pearson’s chi-squared test. The associations between the tertiles of quality of life and morbidities were estimated by odds ratio through multivariate logistic regression analysis. Results:
There were differences between men and women in the reporting of hypertension (p=0.015), diabetes (p=0.033), in the psychological domain (p=0.009) and in total quality of life (<0.001). Elderly people classified in the lower tertile of the physical and social domains of quality of life were more likely to suffer from hypertension, cardiovascular disorders and anemia. Those in the lower tertile of the psychological domain were also more likely to suffer from hypertension, cardiovascular disorders and insomnia, as well as anemia. Elderly individuals in the lower overall tertile were more likely to suffer from hypertension, cardiovascular disorders, insomnia and anemia. No statistically significant associations were found for the environmental domain. Conclusion: The total quality of life and the physical, psychological and social domains of quality of life can be considered good indicators of the described morbidities among the elderly. The environmental domain, however, was not a useful indicator.
INTRODUCTION
The aging process is understood to be a natural process involving the progressive reduction of the functional capabilities of individuals, known as senescence. However, if pathological conditions requiring medical care occur, the elderly person is considered to be suffering from senility.1
The onset of old age includes the limitations of a well-lived in body, lacking the vitality, speed of thought, sensorial, motor or cognitive perception of a younger person.² In addition, elderly people may suffer from chronic illness during the aging process, which can have a negative effect on their well-being.1
Among the biological changes of the aging process are atrophy of the skeletal muscles, a reduction in intracellular fluid, the increase and redistribution of fat, decreased serum albumin concentration, reduced basal metabolism rate, changes in the temperature regulation system and decreased cellular immunity, favoring the onset of diseases, if no educational guidance regarding the aging process is provided.3
From the 1960s onwards global age distribution began to change dramatically.4 Life expectancy
in Brazil has increased rapidly in recent decades, according to the Instituto Brasileiro de Geografia e Estatística (“the Brazilian Institute of Geography and Statistics”) (IBGE), increasing from 70.4 years in 2000 to 73.4 years in 2010.5 This increase in life
expectancy occurred in a gradual manner and came about due to improvements in social conditions, basic sanitation, and the use of antibiotics and vaccines that had a positive effect on the prevention and treatment of contagious-infectious diseases.6
As a result, the elderly population increased from 3 million in 1960 to 7 million in 1975 and 14 million in 2002. It is estimated that this number will reach 32 million elderly people in 2020.7 On a regional
basis, the north of the country has the lowest percentage (5.3%) of elderly citizens.8
In terms of the presence of diseases, according to the IBGE, 77.4% of elderly individuals described suffering from chronic diseases. Among those aged 75 years or older, this proportion increased to 80.3%. Almost half (48.9%) of elderly persons suffered from more than one chronic disease. Among the most reported chronic diseases is high blood pressure, which is the most common in all subgroups of the elderly, with a prevalence of around 50%. Musculoskeletal diseases also appear frequently (35.1%) among people aged 60 and older.8
Studies show that the presence of morbidities negatively inf luences the quality of life of individuals.9 Science has always sought to
conceptualize the term "quality of life", and it is no longer considered to have a single meaning.10 The
term quality of life generally includes a potential range of conditions that can affect the perception, feelings and behavior of an individual related to his or her daily functioning, including but not limited to health condition and medical interventions.11
The concept of quality of life is personal, and depends on the needs and preferences of each individual and what is important to him or her, meaning that socioeconomic level is not always synonymous with quality of life, which is a highly subjective topic.12
Good quality of life in old age should be evaluated by many aspects. In other words a satisfactory old age is not based on the biological, psychological or social individual, but results from the interaction between people undergoing a process of change, who live in a society, and their intra- and extra-individual and community relations.13
In 2006, the Política Nacional de Saúde da Pessoa Idosa (“National Health Policy for the Elderly”) (PNSPI) was established under Ordinance GM nº 2.528/2006, defining the health care that this population is to receive as an entry point to the Primary Care/Family Health Strategy. The purpose of this government initiative was to offer the elderly and their social support network more humanized care through guidance, monitoring and home support.14
The health sector faces significant challenges if it is to meet these very specific demands which will require costly, technology advanced interventions.15
There are currently several studies in Brazil that have approached the theme of "elderly", seeking to define the health conditions and morbidities that can lead to disabilities and dependence.
Therefore the present study aimed to determine the prevalence of low quality of life and analyze the morbidities associated with this condition among elderly individuals enrolled in the Family Health Strategy of the municipality of Senador Guiomard, Acre.
METHODOLOGY
A cross-sectional study with a probabilistic sample of elderly patients attended by the Family Health Strategy for the municipality of Senador Guiomard, Acre, was performed. The sample was selected assuming a sampling error of 5% and a 95% confidence level, with an expected prevalence of chronic diseases of 50%, leading to a sample of 235 subjects. With the addition of a further 15% for possible losses or refusals, this resulted in a total required sample of 271 subjects. In 2010, the Family Health Strategy of Senador Guiomard covered 100% of the population of the urban zone of the municipality.
The sample was selected through the random drawing of the registration numbers of the elderly individuals (Form A) obtained from the Secretaria
Municipal de Saúde e Meio Ambiente (“Municipal Health and Environment Department”) of the four existing Family Health Units in the town.
Disabled elderly persons or those with cognitive impairment that made answering the interview questions impossible were excluded. This resulted in seven losses or refusals, representing 2.9% of the sample. The final sample consisted of 264 elderly men and women aged between 60 and 102 years.
Data collection was carried out between August and October 2010 by trained interviewers, and about 10% of interviews were redone by the study coordination team to ensure the control of the information obtained and correct any discrepancies between evaluators. No difference was observed between the evaluators.
To obtain the data structured interviews were conducted via a form containing identification, demographic, socioeconomic and health status data, as well as scales for economic classification16
and the Quality of Life – WHOQOL-Bref.17
The presence of morbidity was assessed as a dependent variable, and was obtained from the self-reporting by the elderly of the diagnosis of a health care professional of the presence of any of these comorbidities: hypertension, diabetes, cardiovascular disorder (stroke and brain or heart condition), musculoskeletal disorders (problems in the spine, rheumatism, arthritis/osteoarthritis and osteoporosis), insomnia, cataracts, anemia, gastrointestinal and urinary disorders.
The independent variable quality of life was measured by the WHOQOL-Bref (The World Health Organization Quality of Life Assessment)17 instrument,
is composed of the questions which produced the best psychometric results in terms of overall score and the physical, psychological, social and environmental domains, with satisfactory levels of internal consistency, discriminant validity, criterion validity, concurrent validity and test-retest reliability being identified.17 The scores of the
domains of quality of life were analyzed in tertiles, with the lowest tertile representing the lowest scores of quality of life and the highest tertile the highest scores, and hence a greater chance of a good quality of life.
Gender, age, education, and marital and economic status were also investigated. Age was categorized into "60-69 years", "70 to 79 years" and "80 and over", while marital status was described as "with partner" or "without partner". Schooling was categorized as "Illiterate/3rd primary school
grade" and "4th primary school grade or higher”.
Economic classification was obtained through the Critério Brasil de Classificação Econômica (“Brazil Economic Classsification Criteria”)17
considering the purchasing power of people in the following socioeconomic classes: A1, A2, B1, B2, C1, C2, D and E. This test awards points based on domestic characteristics and calculates the sum of these points, with each class corresponding to a numerical range. It was decided to divide this study into two classes "B/C" and "D/E", or in other words, the values of these two classifications were added together to create a category that includes those from both groups. It is noteworthy that no patient was categorized as Class A.
Data was double entered to avoid typographical errors and validated using the Epi Info 6.04 software package (Centers for Disease Control and Prevention, Atlanta, USA). In descriptive analysis, the absolute and relative frequencies of all the variables analyzed by gender were verified, with the differences in the frequencies among the
elderly of the reported morbidities and quality of life being calculated by the Pearson chi-squared test (p<0.05). Means were established with their respective standard deviations for the quality of life domains, and the mean differences between individuals with and without morbidity were tested with the Student’s t-test for independent samples (p<0.05).
Unpaired multivariate logistic regression models estimated the strength of association in terms of Odds Ratio (OR), with respective confidence intervals of 95% (95%), between the dependent variable self-reported morbidity and the domains of quality of life in tertiles, using the upper tertile of each domain as a reference. Bivariate analysis was performed initially to evaluate the association between each self-reported morbidity and the quality of life domains. Associations with p <0.20 were included in the multivariate model. The model was adjusted for age, gender, education, and economic and marital status. Associations with p values equal to or below 0.05 were considered statistically significant. Data was analyzed using the SPSS (Statistical Package for the Social Sciences)
software package, version 17.0.
The present study was approved by the Ethics Research Committee of the Universidade Federal do Acre in 2010 under protocol number Nº 23107.021442/2010-68. All the participants signed a Free and Informed Consent Form.
RESULTS
The lowest quality of life scores were obtained in the environmental and psychological domains, with respective means of 50.4(±7.97) and 63.8(±10.56). The highest score was obtained in the overall quality of life domain, with a mean score of 63.5(±15.00).
There was a statistically significant difference between the genders in the psychological and overall quality of life domains, with the majority of men obtaining a better score in the higher quality of life tertile (Table 2).
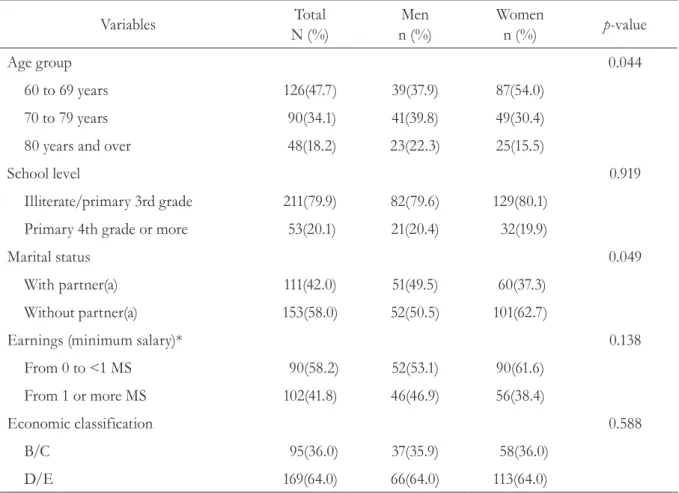
Table 1. Socioeconomic characteristics and quality of life. Senador Guiomard, AC, 2010.
Variables Total
N (%)
Men n (%)
Women
n (%) p-value
Age group 0.044
60 to 69 years 126(47.7) 39(37.9) 87(54.0)
70 to 79 years 90(34.1) 41(39.8) 49(30.4)
80 years and over 48(18.2) 23(22.3) 25(15.5)
School level 0.919
Illiterate/primary 3rd grade 211(79.9) 82(79.6) 129(80.1)
Primary 4th grade or more 53(20.1) 21(20.4) 32(19.9)
Marital status 0.049
With partner(a) 111(42.0) 51(49.5) 60(37.3)
Without partner(a) 153(58.0) 52(50.5) 101(62.7)
Earnings (minimum salary)* 0.138
From 0 to <1 MS 90(58.2) 52(53.1) 90(61.6)
From 1 or more MS 102(41.8) 46(46.9) 56(38.4)
Economic classification 0.588
B/C 95(36.0) 37(35.9) 58(36.0)
D/E 169(64.0) 66(64.0) 113(64.0)
The most frequent self-reported diseases were musculoskeletal disorders (73.1%), hypertension (63.4%), insomnia (46.8%) and cardiovascular disorders (42.0%) (Table 3). There was a significant
difference between men and women in the prevalence of diabetes and hypertension, with a higher prevalence among women (table 3). Table 2. Quality of life scores. Senador Guiomard, AC, 2010.
Quality of life domains (QL) Total
N (%)
Men n (%)
Women
n (%) p-value
Physical 0.145
Upper tertile 108(40.9) 48(46.6) 60(37.3)
Intermediate Tertile 79(29.9) 24(23.3) 55(34.2)
Lower Tertile 77(29.2) 31(30.1) 46(28.6)
Psychological 0.009
Upper tertile 130(49.2) 56(54.4) 74(46.0)
Intermediate Tertile 62(23.5) 14(13.6) 48(29.8)
Lower Tertile 72(27.3) 33(32.0) 39(24.2)
Social 0.265
Upper tertile 138(52.3) 48(46.6) 90(55.9)
Intermediate Tertile 69(26.1) 32(31.1) 37(23.0)
Lower Tertile 57(21.6) 23(22.3) 34(21.1)
Environmental 0.798
Upper tertile 112(42.4) 44(42.7) 68(42.2)
Intermediate Tertile 85(32.2) 31(30.1) 54(33.5)
Lower Tertile 67(25.4) 28(27.2) 39(24.2)
Overall <0.001
Upper tertile 131(49.6) 56(54.4) 75(46.6)
Intermediate Tertile 93(35.2) 23(22.3) 70(43.5)
Table 3. Self-reported morbidities. Senador Guiomard, AC, 2010.
Variables Total
N (%)
Men n (%)
Women
n (%) p-value
Hypertension* 0.015
No 96(36.6) 47(45.6) 49(30.8)
Yes 166(63.4) 56(54.4) 110(69.2)
Diabetes* 0.033
No 218(83.2) 92(89.3) 126(79.2)
Yes 44(16.8) 11(10.7) 33(20.8)
Cardiovascular disorder 0.555
No 153(58.0) 62(60.2) 91(56.5)
Yes 111(42.0) 41(39.8) 70(43.5)
Insomnia* 0.190
No 140(53.2) 60(58.3) 80(50.0)
Yes 123(46.8) 43(41.7) 80(50.0)
Musculoskeletal disorders * 0.132
No 71(26.9) 33(32.0) 38(23.6)
Yes 193(73.1) 70(68.0) 123(76.4)
Intestinal/urinary Incontinence
0.101
No 223(84.8) 92(89.3) 131(81.9)
Yes 40(15.2) 11(10.7) 29(18.1)
Cataracts* 0.421
No 162(62.1) 59(59.0) 103(64.0)
Yes 99(37.9) 41(41.0) 58(36.0)
Asthma/Bronchitis * 0.729
No 237(90.1) 92(89.3) 145(90.6)
Yes 26(9.9) 11(10.7) 15(9.4)
Anemia* 0.801
No 226(86.6) 89(87.3) 137(86.2)
Yes 35(13.4) 13(12.7) 22(13.8)
When assessing the presence of self-reported morbidities and the domains of quality of life, with the highest tertile taken as a reference, it was observed that elderly people who reported hypertension, cardiovascular disorders and anemia had a greater chance of belonging to the
lowest tertile of the quality of life domains, other than the environmental domain, for which there was no statistically significant association with morbidity. Self-reported insomnia also increased the chance of an individual belonging to the lowest tertile of the psychological and overall domains of quality of life (table 4).
Table 4. Association of quality of life tertiles with self-reported morbidities. Senador Guiomard, AC, 2010.
Quality of life domains (QL)
Hypertension Cardiovascular
Disturbance
Insomnia Anemia
OR (CI95%)* OR (CI95%)* OR (CI95%)* OR (CI95%)*
QL Physical Domain**
Intermediate Tertile 1.42(0.75;2.68) 2.01(1.07;3.79) 1.35(0.73;2.51) 2.11(0.77;5.80)
Lower Tertile 2.26(1.10;4.65) 2.53(1.26;5.10) 1.93(0.98;3.82) 3.64(1.31;10.17)
p Tendency 0.027 0.008 0.057 0.013
QL Psychological Domain**
Intermediate Tertile 1.12(0.59;2.16) 1.35(0.71;2.57) 1.31(0.70;2.46) 2.13(0.76;5.93)
Lower Tertile 3.59(1.75;7.35) 2.22(1.19;4.13) 1.86(1.01;3.44) 4.00(1.62;9.88)
p Tendency 0.001 0.013 0.046 0.003
QL Social Domain**
Intermediate Tertile 2.00(1.05;3.80) 1.79(0.98;3.27) 1.17(0.65;2.11) 2.40(0.99;5.84)
Lower Tertile 2.77(1.34;5.75) 2.22(1.16;4.26) 1.02(0.54;1.93) 2.55(1.01;6.43)
p Tendency 0.003 0.010 0.862 0.032
QL Environmental Domain**
Intermediate Tertile 0.89(0.49;1.62) 1.70(0.95;3.04) 0.70(0.39;1.25) 2.12(0.87;5.14)
Lower Tertile 1.56(0.79;3.10) 1.70(0.90;3.21) 1.55(0.82;2.90) 2.36(0.91;6.17)
p Tendency 0.277 0.077 0.290 0.066
QL Overall**
Intermediate Tertile 2.23(1.24;4.03) 1.80(1.02;3.18) 1.47(0.85;2.56) 2.66(1.07;6.58)
Lower Tertile 6.56(2.46;17.46) 6.34(2.81;14.32) 2.77(1.29;5.93) 5.29(1.89;14.79)
p Tendency <0.001 <0.001 0.008 0.001
DISCUSSION
The results of the present study found that the presence of comorbidities is a reality during the aging process and is associated with low scores for all the domains of quality of life other than the environmental domain. The growth in the elderly population in recent years should be a concern for Family Health Strategies across the country.18
In the state of Acre, elderly persons represented 4.3% of the population and in Senador Guiomard this group represented 7.9% of the population.9 A total of 650,000 people are
newly classified as elderly every year in Brazil, the majority of whom suffer from chronic diseases and a number of whom have functional limitations.19
According to the Pesquisa Nacional por Amostra de Domicílios (“National Household Sampling Survey”) (PNAD), about 70.0% of elderly participants reported having at least one chronic disease.20 Hypertension and arthritis are
the most frequently reported chronic diseases.21 In
the present study high blood pressure was the most frequently reported condition, which corroborates with national data that indicated a prevalence of 45.4% of this disease in the population.22 Other
studies also reported cardiovascular system diseases (angina, heart failure, vascular diseases, cardiac arrhythmia, stroke and thrombosis) and dyslipidemias, all of which are most commonly associated with hypertension, followed by diabetes and musculoskeletal diseases.23,24
The occurrence of morbidities significantly interferes in various domains of the quality of life of older people. To achieve well-being in old age a balance between all aspects of quality of life is required.25 In terms of the perception of quality
of life of the elderly persons in the present study, it was observed that women reported a poorer quality of life. According to Pino,26 subjective
quality of life is perceived more positively by older men than older women, which can be explained by negative feelings regarding the onset of the aging
process, which is associated with physical changes, the emergence of disease and the loss of a partner among women. Although women have higher survival rates than men, they experience higher rates of functional limitation and morbidity,27 a
relevant factor that was corroborated in the present study, as women obtained lower quality of life scores for the majority of the morbidities examined.
Other studies have also shown that women live longer, which is a worldwide phenomenon. This finding is particularly noticeable in Brazil, where women live an average of eight years more than men.28 This may be related to the specific
behavior of each gender, as women are more likely to seek treatment from the health service due to life experiences such as prenatal care, family planning and routine consultations at health care units, which facilitates the detection of diseases in their initial stages.29,30 On the other hand, men,
despite being more exposed to labor and traffic accidents throughout life and being more likely to use alcohol, drugs or smoke,31 do not seek health
care as often.32
By linking the presence of comorbidities with a poorer quality of life it was found that there was an association between low quality of life scores and anemia, a fact that can be explained by the low supply of oxygen in the cells which results in a reduction of the metabolism of the body. Fatigue, which is one of the main symptoms of this condition, may reduce the quality of life of the elderly and function as a further stressor, precipitating or aggravating negative perceptions regarding health.33
Sleep disorders seem to increase with age, with insomnia being the most prevalent. Studies have shown the association between diseases and the occurrence of insomnia, with emphasis on those related to psychological issues such as depression, anxiety and dementia.35-37 Sleep deprivation results
in lower quality of life and increased morbidity and mortality predictors among the elderly.38
One limitation of the present study was the use of self-reporting of morbidities, which may overestimate data as it depicts only what the person presents in terms of symptoms.39 However, the
use of self-reporting has become an important and valuable tool 0in epidemiological studies, with high specificity and sensitivity, due to the technical difficulties and high costs of populational studies.40-42 It should also be highlighted that
the cross-sectional design does not allow causal inference of the observed associations to be made, and must be treated with caution
The positive points of the study were the significant sample of elderly individuals treated by the Family Health Strategy of Senador Guiomard, Acre, and the tackling of an important theme, considering the context of populational aging
and the fact that the influence of self-reported morbidities on the quality of life of elderly people had not yet been studied in the area.
CONCLUSION
Most elderly persons attended by the Family Health Strategy of Senador Guiomard, Acre reported having at least one chronic disease, with hypertension, diabetes and musculoskeletal diseases being most prevalent. The elderly persons classified in the lower tertile of the physical and social quality of life domains were more likely to suffer from high blood pressure, cardiovascular disorders and anemia. Those belonging to the lowest tertile of the psychological and overall domains suffered from the same conditions, as well as insomnia.
It is noteworthy that the perception of quality of life seems to be largely determined by various external and internal factors, such as health and other financial and social conditions. The importance of providing holistic care for elderly persons living in the community and receiving care in health centers should therefore be emphasized.
REFERENCES
1. Brasil. Ministério da Saúde. Envelhecimento e saúde da pessoa idosa. Brasília, DF: Ministério da Saúde; 2007.
2. Skinner B, Valghan ME. Enjoy old age: a program of self: management. New York: Norton: Summus; 1983.
3. Duarte Y, Diogo M. Atendimento domiciliar: um enfoque gerontológico. São Paulo: Atheneu; 2000.
4. Carvalho JAM, Garcia RA. O Envelhecimento da população brasileira: um enfoque demográfico. Cad Saúde Pública 2003;19(3):725-33.
5. Instituto Brasileiro de Geografia e Estatística. Brasil: tábua completa de mortalidade 2010. Rio de Janeiro: IBGE; 2011.
6. Nasri F. O envelhecimento populacional no Brasil. Einstein 2008;6(Supl 1):4-6.
7. Lima-costa MF, Veras RP. Saúde pública e envelhecimento [editorial]. Cad Saúde Pública 2003;19(3): 700-1.
8. Instituto Brasileiro de Geografia e Estatística. Síntese de indicadores sociais: uma análise das condições de vida da população brasileira. Rio de Janeiro: IBGE; 2010.
9. Belvis AG, Avolio M, Sicuro L, Rosano A, Latini E, Damiani G, et al. Social relationships and HRQL: a cross-sectional survey among older italian adults. BMC Public Health 2008;8:1-10.
10. Gill TM, Feinsten AR. A critical appraisal of the quality of quality-of-life measurements. JAMA 1994;272(8):619-26.
11. Bullinger D. Locomotor disability in very elderly people. Br Med J 1993;301(6745):216-20.
12. Moraes NAS, Witter GP. Velhice: qualidade de vida intrínseca e extrínseca. Bol Psicol 2007;57(127):215-38.
14. Brasil. Portaria n. 2.528, de 19 de outubro de 2006. Dispõe sobre a aprovação da Política Nacional de Saúde da Pessoa Idosa. Brasília, DF: Ministério da Saúde; 2006.
15. Quintella LCM. Qualidade de vida e estado nutricional de idosos: um estudo descritivo sobre frequentadores do centro de práticas esportivas da Universidade de São Paulo [dissertação]. São Paulo: Universidade de São Paulo; 2006.
16. Associação Brasileira de Empresas de Pesquisa. Critério de classificação econômica Brasil: dados com base no levantamento sócio econômico 2006 e 2007 [Internet]. São Paulo: ABEP; 2009 [acesso em 05 jun. 2014]. Disponível em: http://www.abep.org/ codigosguias/CCEB2008-Base2006e2007.pdf
17. Fleck MPA. Aplicação da versão em português do instrumento abreviado de avaliação de qualidade de vida “WHOQOL-Bref”. Rev Saúde Pública 2000;34(2):178-83.
18. Brasil. Portaria nº 648, de 28 de março de 2006. Dispõe sobre a aprovação da Política de Atenção Básica, estabelecendo diretrizes e normas para a organização da Atenção Básica para a Estratégia de Saúde da Família (PSF) e o Programa de Agentes Comunitários de Saúde (PACS). Brasília, DF: Diário Oficial da União; 28 mar. 2006.
19. Veras RP. Envelhecimento populacional
contemporâneo: demandas, desafios e inovações. Rev Saúde Pública 2009;43(3):548-54.
20. Instituto Brasileiro de Geografia e Estatística. Pesquisa de Amostra por Domicílio - PNAD 2007 [Internet]. Rio de Janeiro: IBGE; 2007 [acesso em 20 ago. 2014]. Disponível em: www.ibge.gov.br/ home/estatistica/populacao/trabalhoerendimento/ pnad2007/graficos_pdf.pdf
21. Lima-costa MF, Barreto S, Giatti L, Uchoâ E. Desigualdade social e saúde entre idosos brasileiros: um estudo baseado na Pesquisa Nacional por Amostra de Domicílios. Cad Saúde Pública 2003;19(3):745-57.
22. Instituto Brasileiro de Geografia e Estatística. Informações sobre municípios brasileiros 2006 [Internet]. Rio de Janeiro: IBGE; 2006 [acesso 20 ago. 2014]. Disponível em: http://www.ibge.com.br
23. Pereira RJ, Cotta RMM, Franceschini SCC, Ribeiro RCL, Tinoco ALA, Rosado LEFPL, et al. Analise do perfil sociossanitário de idosos: a importância do Programa de Saúde da Família. Rev Méd Minas Gerais 2010;20(1):5-15.
24. Garcia ESS, Saintrain MVL. Perfil epidemiológico de uma população idosa atendida pelo programa saúde da família. Rev Enferm UERJ 2009;17(1):18-23.
25. Campolina A, Dini P, Ciconelli R. Impacto da doença crônica na qualidade de vida de idosos da comunidade em São Paulo. Ciênc Saúde Coletiva 2011;16(6):2919-25.
26. Pino ACS. Calidad de vida en la atención al mayor. Rev Multidiscip Gerontol 2003;13(3):188-92.
27. Azevedo ALS, Silva RA, Tomasi E, Quevedo LA. Doenças crônicas e qualidade de vida na atenção primária à saúde. Cad Saúde Pública 2013; 29(9):1774-82.
28. Instituto Brasileiro de Geografia e Estatística. Perfil dos idosos responsáveis pelos domicílios no Brasil 2000. Rio de Janeiro: IBGE; 2002.
29. Mrus JM, Williams PL, Tsevat J, Cohn SE, Wu AW . Gender differences in health related quality of life in patients with HIV/AIDS. Qual Life Res 2005;14(2):479-91.
30. Teh CF, Kilbourne AM, McCarthy JF, Welsh D, Blow FC. Gender differences in health related quality of life for veterans with serious mental illness. Psychiatr Ser 2008;59(6):663-9.
31. Chaimowicz F. Epidemiologia e o envelhecimento populacional no Brasil. In: Freitas EV, Py L, editoras. Tratado de geriatria e gerontologia. 2. ed. Rio de Janeiro: Guanabara Koogan; 2006.
32. Gomes R, Moreira MCN, Nascimento EF, Rebello LEFS, Couto MT, Schraiber LB. Os homens não vêm!: Ausência e/ou invisibilidade masculina na atenção primária. Ciênc Saúde Coletiva 2011;16(suppl.1):983-92.
33. Furlanetto LM, Brasil MAA. Diagnosticando e tratando a depressão no paciente com doença clínica. J Bras Psiquiatr 2006;55(1):8-19.
34. Christmann M, Da costa CC, Moussalle LD. Avaliação da qualidade de vida de pacientes cardiopatas internados em um hospital público. Rev AMRIGS 2011;55(3):239-43.
35. Benka RM. Diagnosis and treatment of chronic insomnia: a review. Psychiatr Ser 2005;56(3):332-43.
36. Kamel NS, Gammack JK. Insomnia in the elderly: cause, approach, and treatment. Am J Med 2006;119(6):463-9.
37. Schneider DL. Insomnia: safe and effective therapy for sleep problems in the older patient. Geriatrics 2002;57(5):24-35.
Received: November 12, 2014 Revised: July 16, 2015 Accepted: August 11, 2015
39. Chrestani MA, Santos IS, Matijasevich AM. Self-reported hypertension: validation in a representative cross-sectional survey. Cad Saúde Pública
2009;25(11):2395-406.
40. Brasil. Vigitel Brasil 2008: Vigilância de fatores de risco e proteção para doenças crônicas por inquérito telefônico. Brasília: Ministério da Saúde; 2009.
41. Siqueira FV, Facchini LA, Hallal PC. The burden of fractures in Brazil: a population- based study. Bone 2005;37(2):261-6.