Factors associated with physical
activity in Goiania’s adult
population: surveillance through
telephone interviews
Iana Cândido CUNHA
1Maria do Rosário Gondim PEIXOTO
2Paulo César Brandão Veiga JARDIM
3Veruska Prado ALEXANDRE
41 Superior School of Physical Education and Physical Therapy of Universidade
Estadual de Goiás.
2 School of Nutrition of Universidade Federal de Goiás.
3 School of Medicine of Universidade Federal de Goiás.
4 Dietician of the State Health Secretary of Goiás. Master’s degree student of the
graduate program on Human Nutrition - UnB.
League of Hypertension of the Universidade Federal de GoiásFirst Avenue s/n Setor Leste Univer-sitário, CEP 74065-080, Goiânia-GO
Funding agency: National Research Council (CNPq. Edital CT – Health/ MCT/ MS/ CNPq nº 30/2004 – Food and nutrition).
Mainling address: Iana Cândido Cunha. Rua Santa Gertrudes, 304 Setor Coimbra, CEP: 74535-420 Goiânia-GO. email: ianacandido@yahoo.com.br
Abstract
Introduction: Practicing regular, moderate
to vigorous physical activities has an inverse relation to morbidity-mortality caused by cardiovascular diseases and obesity. It is essential to identify the determinants of this practice in order to propose strategies for populations to adopt a physically ac-tive lifestyle. Objective: To determine the factors associated with practicing physical activity and sedentary lifestyle in the adult population of Goiania. Methods: Multi-center, cross-sectional study, carried out in Goiania with a probabilistic sample of the adult population with landline phones. 2,002 interviews were conducted through phone calls, setting a success rate of 73.1%. The database was built, and statistical analyses were carried out with the support of STATA software, version 8.0. Results: A se-dentary lifestyle was more prevalent among women (55.5%) than among men (42.0%). The prevalence of hypertension was lower in individuals practicing physical activity (p=0.0002). Regarding leisure-time physical activity, women were more inactive (79.3%) than men (66.9%). There was an inverse relationship between a sedentary lifestyle and the educational background for both genders. Conclusion: Due to this snapshot, showing a high frequency of sedentary lifestyle in the population, we suggest the implementation of primary prevention strategies to improve the risk profile for non-communicable chronic diseases.
Keywords: Physical activity. Sedentary
Introduction
The number of non-communicable chronic diseases (NCCDs) went through three-fold increase between the decades of 30 and 901, according to historical mortality
data of Brazilian capitals, thus reflecting the change in the health profile of the Brazilian population.
Prospective cross-sectional epidemiolo-gical studies have shown a strong associa-tion between the main NCCDs (cardiovas-cular disease, diabetes and certain types of cancer) and a number of risk factors such as smoking, excessive alcohol consumption, overweight, hypertension, hypercholes-terolemia, low consumption of fruits and vegetables, and a sedentary lifestyle2.
According to the World Health Organiza-tion (WHO), the determinants to identify an individual as sedentary or physically inacti-ve are: occupation, commuting, household chores, and leisure3.
Some authors consider physical activity as any body movement produced by skeletal muscles that results in energy expenditure; and leisure time inactivity as the lack of physical activity at moments of leisure4.
Epidemiological studies show that there is an inverse relationship between the level of daily physical activity and morbimor-tality due to cardiovascular disease and diabetes type II, regardless of the degree of adiposity5.
Risk factors for NCCDs are not adequa-tely monitored in Brazil6, despite its
impor-tance in defining the epidemiological profile of the population. According to the Survey of Living Standards (SLS), a household survey conducted in adults in 1996/1997 to identify patterns of physical activity in the Northeast and Southeast regions of Brazil, only 13% of the population reported practice of leisure-time physical activity. Among practitioners of physical activity, 18.2% were men and 8.2% women7.
Possible reasons for the low levels of physical activity of western populations, including developing countries, are chan-ges in living habits, work, and purchase of
durable consumer goods, such as TV sets and computers, common products in the age of information technology. They lead people to spend many hours a day sitting and relatively inactive8, 9.
Given the high rates of inactivity, it is essential to identify the determinants of physical activity, to then propose programs to foster its practice as well as strategies to encourage the population to adopt a physically active lifestyle10. In order to
en-courage the public to maintain an active lifestyle throughout life, for the control of NCCDs, the World Health Organization (WHO) has developed a Global Strategy (WHO/GS). It recommends the practice of moderate-intensity physical activities for at least 30 minutes on most days, which can be distributed along the day, including household chores, dance, and recreational activities11, 12.
The incorporation of physical activity as habit contributes effectively to control body weight and can also alleviate the emotional stress and other psychosocial factors related to obesity13.
The practice of regular physical activity reduces the risk of cardiovascular diseases, some types of cancers, and helps to control blood pressure and diabetes type II, by promoting an increase in insulin turnover, enhancing liver absorption, improving the sensitivity of peripheral receptors, and redu-cing complications related to comorbidities; moreover, the practice of physical activity, associated to a healthy diet, improves the lipid profile in the long term13, 14.
This study aimed to determine the fac-tors associated with physical activity and inactivity in the adult population of the city of Goiânia through telephone interviews.
Materials and Methods
for monitoring NCCDs risk factors, called SIMTEL, which includes the application of periodic surveys.
The project was reviewed and approved by the Research Ethics Committee of the School of Public Health of the University of São Paulo in accordance with the requi-rements of resolution CNS196/96. As they were telephone interviews, the written informed consent was replaced by duly recorded verbal consent obtained by tele-phone contact.
The NCCD risk factor monitoring system was first used in the municipality of São Paulo in 2003; and in 2005, it was again held in this city and expanded to other Brazilian capitals (Belém, Florianópolis, Goiânia and Salvador). The results presented in this pa-per refer to the city of Goiânia, in 2005.
In 2006, the Ministry of Health, through the Department of Health Surveillance and the Department of Strategic and Partici-pative Management, deployed the system VIGITEL – Telephone-Based Surveillance of Chronic Disease Risk Factors and Protection. This system aims at the continuous moni-toring of the distribution and frequency of chronic diseases risk factors and protection in all the capitals of the 26 Brazilian states and the federal district.
Further details on the methodological procedures employed both in the sampling process and in SIMTEL operation have been described in a previous publication15.
Interviewers had to make the telephone calls to the lines drawn; confirm they were active residential lines; explain to respon-dents the purpose of the monitoring system; ask their consent to participate in the study; list in ascending order the ages of the adults living in that home; randomly choose from that list the adult to be interviewed; and write down the best days and times for the interview.
The stratified and systematic draw of phone lines, the selection of residents (one resident at least 18 years old for each tele-phone line drawn), and interviews occurred in the period between May and December 2005. 2002 interviews were conducted, thus providing estimates with 95% confidence
interval (95%CI) and maximum error of two percentage points of the prevalence for any risk factor for the NCCDs studied.
Each phone number that was drawn received up to 10 calls at various days and ti-mes. To that end, we used a microcomputer, whose software, developed for the research, drew the interviewee and recorded ques-tions asked. Interviews lasted on average 8 minutes and included the reading of short and simple questions; recording of answers; skipping non-applicable questions, depen-ding on answers; recordepen-ding interviews for subsequent quality control; and the auto-matic creation of a database.
The questions of the questionnaire re-ferred to socio-demographic characteristics, patterns of diet, physical activity, smoking, consumption of alcoholic beverages, wei-ght, heiwei-ght, self-assessment of health status, and report of medical diagnosis of non-communicable chronic diseases (diabetes, hypertension and dyslipidemias).
The questionnaire is available at the we-bsite: www.saude.gov.br/svs (questionário VIGITEL).
The following variables were used in this study: socio-demographic (age, sex, mari-tal status, and full school years), physical activity, weight, height and self-reported diagnosis of NCCDs.
With regard to physical activity, we col-lected information on the type of exercise practiced; frequency or lack of leisure-time physical activity (active and inactive leisure time); and the general behavior in relation to exercise (sedentary lifestyle). To define the variable “inactivity”, all of the following categories had to be present: inactive leisure time (no leisure-time physical activity); inactive occupation (self-reported mild or very mild effort during work); inactive at household (no heavy domestic activity - less than 3 days per week lasting less than 3 hours); and inactive in commuting (com-mutes by car, bicycle, bus, or spends less than 10 minutes walking or cycling).
Following WHO’s11 international
30 minutes of daily physical activity for mild or moderate intensity on five or more days of the week, or the practice of at least 20 minutes of daily physical activity of vigo-rous intensity on three or more days of the week. Conventional walking, walking on a treadmill, bodybuilding, water aerobics, general gymnastics, swimming, martial arts, cycling, and volleyball were classified as mild or moderate intensity exercise. Running, running on a treadmill, aerobics, soccer, basketball, and tennis were classified as vigorous intensity exercise16.
One way to assess the intensity of physi-cal activity is through the amount of energy spent, expressed as a multiple of a Metabolic Unit (MET). The Compendium of Physical Activities presents a list of activities and relates them to their calorie expenditure and, consequently, the level of intensity of each activity16.
We investigated previous medical diag-noses of hypertension, diabetes mellitus, and dyslipidemia, as reported by partici-pants in answering a yes/no question.
The anthropometric measures (reported weight and height) were used for determi-ning the body mass index (BMI), calculated as the ratio of weight (kg) by the square of height (m). For the classification of the nutri-tional status, we used the WHO’s recommen-dations17: BMI < 18.5 Kg/m2 (underweight),
18.5 to 24.9 kg/m2 (normal), 25 to 29.9 Kg/m2
(overweight), and BMI ≥ 30Kg/m2 (obese).
The overweight category represents the sum of overweight and obese individuals, with the cutoff point at BMI ≥ 25 kg/m2.
The construction of the database and statistical analyses were performed by the application Statistical Software for Profes-sionals (STATA)18, version 8.0, using the
functions “svy”, considering the complex nature of the sample. Statistical analyses of the association between risk indicators and socio-demographic characteristics with the practice of physical activity or inactivity were performed using the chi-square sta-tistical test of distribution, weighted by an adjustment factor designed to “represent” the adult population.
Results
3145 phone lines were drawn, and 2738 (87.1%) were considered eligible. The main causes of ineligibility were: line permanen-tly without answer, or no answer after ten calls (10.1%); out of service or nonexistent line (2.8%). 2002 interviews were conducted, with a success rate of 73.1%. The main cause that prevented interviews was refusal to participate (6.8%).
In considering the factors that in-fluenced the practice of physical activity, we noted that women are more active in household chores; on the other hand, as to leisure-time physical activity, men had a significantly more active lifestyle (33.1%) than women (20.7%) (Table 1).
In analyzing the frequency of the mo-dalities of physical activity practiced by the population studied, we found gender diffe-rences. Among those who practiced some form of sport, 30.9% of the men and 60.6% of the women practiced walking, respecti-vely; the most frequent sports modality for men was football (30.7%) and bodybuilding for women (7.4%) (this information is not presented in the tables).
With regard to the self-reported physical intensity of occupational activity, only 21.5% of men and 11.5% of women reported that their work was heavy or very heavy. When considering walking or cycling to commute to the workplace, only 8.5% of individu-als of both sexes reported that habit. The prevalence of inactivity was higher among women (55.5%) than among men (42.0%) (Table 1).
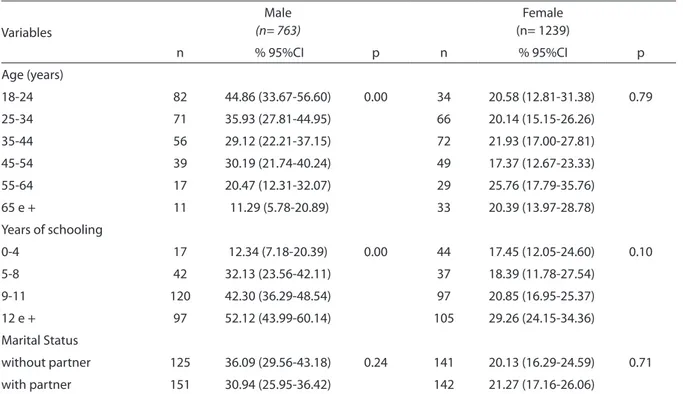
After examining the distribution of the practice of leisure-time physical activity, according socio-demographic variables and gender, we noted that younger men with higher education practice leisure-time physical activity more often. For women, age, education and marital status did not influence the practice of leisure-time phy-sical activity (Table 2).
Table 1 - Prevalence of physical activity and inactivity in the adult population according to adjustment. Goiânia, 2005
Frequency (%)** (n = 2002)
Male % IC (95%)
Female % IC (95%)
Leisure Time Physical Activity
Active
33.12 (29.07-37.43)
20.72 (17.84-23.93)Inactive
66.88 (62.57-70.92)
79.28 (76.07-82.16)Occupational Physical Activity
Active
21.54 (17.460-26.28)
11.46 (9.31-14.02)Inactive
78.46 (73.72-82.54)
88.54 (85.98-90.69)Active 8.41 (6.14-11.41) 8.66 (6.66-11.18)
Inactive 91.59 (88.59-93.86) 91.34 (88.82-93.34)
Household Physical Activity
Active 0.24 (0.04-0.84) 4.57 (3.17-6.53)
Inactive 99.76 (99.16-99.93) 95.43 (93.47-96.83)
Sedentary
141.96 (37.36-46.71)
55.48 (51.47-59.42)
** Adjusted to “represent” the total adult population of the municipality 1 Inactive in leisure, occupational, cleaning and transport
Table 2 - Frequency of leisure-time physical activity, according sociodemographic variables and gender, in the adult population of Goiania, 2005
Variables
Male
(n= 763)
Female (n= 1239)
n % 95%CI p n % 95%CI p
Age (years)
18-24 82 44.86 (33.67-56.60) 0.00 34 20.58 (12.81-31.38) 0.79
25-34 71 35.93 (27.81-44.95) 66 20.14 (15.15-26.26)
35-44 56 29.12 (22.21-37.15) 72 21.93 (17.00-27.81)
45-54 39 30.19 (21.74-40.24) 49 17.37 (12.67-23.33)
55-64 17 20.47 (12.31-32.07) 29 25.76 (17.79-35.76)
65 e + 11 11.29 (5.78-20.89) 33 20.39 (13.97-28.78)
Years of schooling
0-4 17 12.34 (7.18-20.39) 0.00 44 17.45 (12.05-24.60) 0.10
5-8 42 32.13 (23.56-42.11) 37 18.39 (11.78-27.54)
9-11 120 42.30 (36.29-48.54) 97 20.85 (16.95-25.37)
12 e + 97 52.12 (43.99-60.14) 105 29.26 (24.15-34.36)
Marital Status
without partner 125 36.09 (29.56-43.18) 0.24 141 20.13 (16.29-24.59) 0.71
with partner 151 30.94 (25.95-36.42) 142 21.27 (17.16-26.06)
was a statistically significant association between inactivity and schooling in both sexes, in that those who have less education were more sedentary. With regard to mari-tal status, women without partners were more inactive than those with a partner. Regarding age, no significant differences were found.
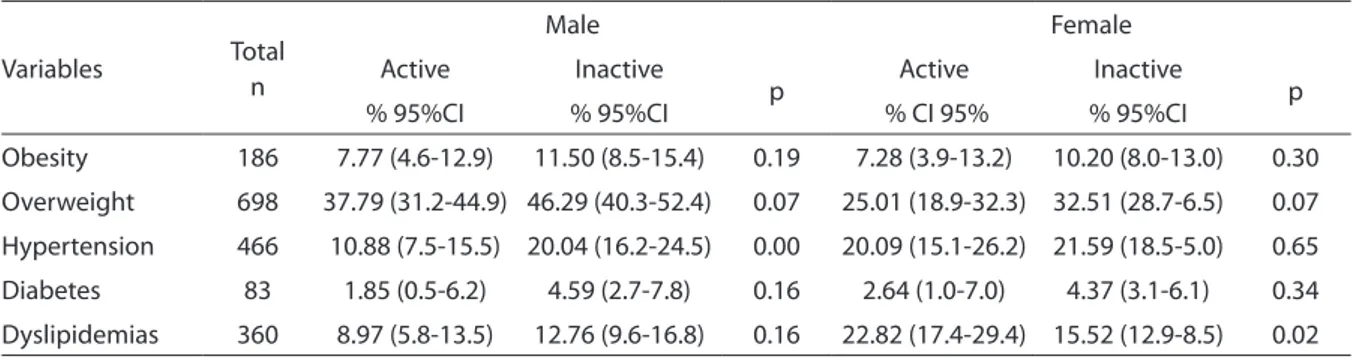
In examining the association between NCCDs and leisure-time physical activity (Table 4), only in males hypertension sho-wed a significant inverse association with this practice (p = 0.00); for women there was a positive association between this practice and dyslipidemia (p = 0.02).
Table 3 - Frequency of inactivity second socio-demographic variables and gender, in the adult population of Goiania, 2005
Variables
Male
(n= 763)
Female
(n= 1239)n
95%CI
p
n
95%CI
p
Age (years)
18-24
92
67.56 (56.83-76.71)
0.16
99
56.91 (44.56-68.46)
0.0525-34
116
74.50 (65.44-81.85)
124
45.24 (38.06-52.62)
35-44
122
78.87 (71.36-84.83)
120
44.25 (37.36-51.37)
45-54
89
63.75 (53.66-72.76)
95
48.06 (40.35-55.87)
55-64
61
73.91 (62.48-82.82)
65
53.97 (43.88-63.75)
65 +
44
76.88 (63.61-86-35)
83
65.02 (55.47-73.51)
Years of schooling
0-4
98
81.66 (72.23-88.41)
0.00
138
58.87 (48.76 -68.29)
0.045-8
120
80.24 (70.95-87.10)
90
42.16 (33.65-51.17)
9-11
200
65.69 (59.49-71.40)
211
49.04 (43.94-54.16)
12 e +
106
56.08 (47.87-63.97)
147
51.05 (44.87-57.20)
Marital Status
without partner
193
68.46 (61.59-74.61)
0.10
334
54.97 (49.75-60.07)
0.03with partner
331
75.20 (70.00-79.75)
252
45.80 (39.39-52.35)
p ≤ 0.05 according to x2 test
Table 4 - Association between leisure-time physical activity and NCCDs, according to gender, in the adult population of Goiania, 2005
Variables Total
n
Male Female
Active Inactive
p Active Inactive p
% 95%CI % 95%CI % CI 95% % 95%CI
Obesity 186 7.77 (4.6-12.9) 11.50 (8.5-15.4) 0.19 7.28 (3.9-13.2) 10.20 (8.0-13.0) 0.30
Overweight 698 37.79 (31.2-44.9) 46.29 (40.3-52.4) 0.07 25.01 (18.9-32.3) 32.51 (28.7-6.5) 0.07
Hypertension 466 10.88 (7.5-15.5) 20.04 (16.2-24.5) 0.00 20.09 (15.1-26.2) 21.59 (18.5-5.0) 0.65
Diabetes 83 1.85 (0.5-6.2) 4.59 (2.7-7.8) 0.16 2.64 (1.0-7.0) 4.37 (3.1-6.1) 0.34
Dyslipidemias 360 8.97 (5.8-13.5) 12.76 (9.6-16.8) 0.16 22.82 (17.4-29.4) 15.52 (12.9-8.5) 0.02
Discussion
SIMTEL was based on the Behavioral Risk Factor Surveillance System (BRFSS), the world’s largest telephone-based surveillan-ce system designed to collect data from a representative sample of 50 U.S. states and three territories. The main purpose of this system is to provide estimates of health-related behaviors for the main causes of morbidity and mortality among American adults, such as obesity, hypertension, dia-betes, also providing estimates on the level of leisure-time physical activity and the proportion of inactive adults19.
The system for tracking telephone calls, provides information that can be easily obtained for a representative sample with low operating cost, convenience and ap-plicability; moreover, this type of method does not interfere in the physical activity of the interviewee19.
However, this monitoring system has certain limitations such as: accuracy of self-reported information: respondent aware-ness of relevant information; recall capacity and reliability; respondents’ tendency to omit, underestimate or overestimate some behaviors.
As this was a cross-sectional study fo-cused on a specific population of adults, with landline telephones in Goiânia, the generalization of results for the overall po-pulation is limited.
Despite the limitations pointed out, this telephone-based monitoring system has proven to be sensitive to capture the evolu-tion of diseases and NCCD risk behaviors in the American population. In 2001, 54.6% of adult Americans were estimated to not be physically active, indicating that most of these individuals were not engaged in the practice of physical exercise. This informa-tion was useful to identify and characterize the population at risk and to shape and evaluate health prevention and promotion programs in the American states19.
It is difficult to assess the measurement of physical activity because of the lack of tools for such; for this reason, most of
the population-based surveys focuses on leisure-time physical activity, because it is difficult to obtain information related to occupation, household chores, and commu-ting20. Therefore, assessment of leisure-time
physical activity is one of the most impor-tant in the field of public health, considering that the practice of regular physical activity is a protective factor for various NCCDs and the risk factors of such diseases21.
Looking at the adult population of Goiâ-nia, in terms of the frequency of leisure-time physical activity, figures were considered high. However, there was a gap between sexes: women were more inactive (79.3%) than men (66.9 %). Similarly to the data of a survey conducted in Rio de Janeiro, the frequency of leisure-time physical inactivity varied between genders, with 77.8% to 58.9% for women and men, respectively. Likewise, in Pelotas, figures were 89.4% and 69.1% for women and men, respectively, during leisure-time22, 23. In the Household Survey on
Reported Morbidity and Risk Behaviors for Noncommunicable Diseases, women also were less sufficiently active (34-58%) than men (23-36%), except for Belém24
The evaluation of occupational physical activity and commuting has been included in some epidemiological studies. With re-gard to occupational activity, in Goiania, 21.5% of men and 11.5% of women reported that their jobs were heavy or too heavy; and 8.4% of men and 8.7% of women reported they walk or cycle to work. In a study con-ducted in Rio de Janeiro, the percentage of heavy occupational physical activity (3.6% men and 0.3% women) was well below that found by the authors of this study; and as to commuting, 9.6% of men and 7.0% of women reported that they walk or cycle to work22.
According to the level of inactivity found in this study, 49.2% of respondents were sedentary. In another study in Goiânia, this prevalence was even higher, 62.3% 25.
As in other national studies on this topic, the level of education and age were deter-mining factors for the practice of physical activity. Regarding the findings of this study, males had a positive relationship between education and leisure-time physical activity, while the prevalence of physical activity was higher among the younger, similarly to other Brazilian cities22, 23.
According to the results of previous studies, this survey found an association between some socio-demographic varia-bles and sedentary lifestyle. In relation to marital status, we only found an association for women: those without partners were more inactive. Conversely, a study conduc-ted in Europe found a positive association between leisure time inactivity and being married27.
The data found in our study showed a trend of association between lower
fre-quency physical activity and the presence of NCCDs. However, only the data for hyper-tensive males was significant (p = 0.0002). The interpretation of the relationship of NCCDs and leisure-time physical activity must be made with caution, because this is a cross-sectional study and cannot exclude the possibility of reverse causality28.
Goiânia’s SIMTEL proved to be efficient, with good reliability, and its convenience may support health prevention and pro-motion measures and also contribute to the implementation of the WHO/GS recom-mendations for the tracking and surveillan-ce of NCCDs, identifying ways to redusurveillan-ce the morbimortality associated to risk factors. Therefore, it is important to implement policies and actions at the regional and community levels targeted at the practice of regular physical activity11.
References
1. Barreto ML, Carmo EL. Tendências recentes das doenças crônicas no Brasil. In: Lessa I. (org.) O adulto brasileiro e as doenças da modernidade: epidemiologia das doenças crônicas não-transmissíveis. Rio de Janeiro: Hucitec/ Abrasco; 1998. p. 15-27.
2. World Health Organization. Diet, nutrition and prevention of chronic diseases. Report of the joint WHO/ FAO expert consultation, Geneva, 2003. (WHO).
3. World Health Organization. The world health report 2002: reducing risks, promoting healthy life. Geneva; 2002. (WHO).
4. Caspersen CJ, Powell KE, Christenson GM. Physical activity, exercise and physical fitness: definitions and distinctions for health – related research. Public Health Rep 1985; 100 (2): 172-9.
5. Rique ABR, Soares EA, Meirelles CM. Nutrição e exercício na prevenção e controle das doenças cardiovasculares. Rev Bras Med Esporte 2002; 8 (6): 244-54.
6. Monteiro CA, Conde WL, Popkin BM. Is obesity replacing or adding to under-nutrition? Evidence from different social classes in Brazil. Public Health Nutr 2002; 5 (1A): 104-12.
7. Monteiro CA, Wolney LC, Matsudo SM, Matsudo VR, Bonsenor IM, Lotufo PA. A descriptive epidemiology of leisure-time physical activity in Brazil, 1996/97. Rev Panam Salud Publica 2003; 14 (4): 246-54.
8. Popkin BM. The nutrition transition and obesity in the developing world. J Nutr 2001; 131: 871-3S.
9. Mendonça CP, Anjos LA. Aspectos das práticas alimentares e da atividade física como determinantes do crescimento do sobrepeso/obesidade no Brasil. Cad Saúde Pública 2004; 20 (3): 698-709.
10. Pitanga FJG. Epidemiologia, atividade física e saúde. Rev Bras Ciên Mov 2002; 10: 49-54.
11. World Health Organization. Global strategy on diet, physical activity and health. Geneva: WHO, 2004. [Fifty-Seventh World Assembly, WHA57. 17 ].
12. Beraldo FC, Vaz IMV, Naves MMV. Nutrição, atividade física e obesidade em adultos: aspectos atuais e recomendações para prevenção e tratamento. Rev Med Minas Gerais 2004; 14 (1): 57-62.
13. Lahti-Koski M, Pitinem P, Heliovaara M, Vartiainen E. Associations of body mass index and obesity with physical activity, food choices, alcohol intake, and smoking in the 1982-1997. Am J Clin Nutr 2002; 75: 809-17.
15. Monteiro CA, Moura EC. De, Jaime PC, Lucca A, Florindo AA, Figueiredo ICR, Bernal R, Silva NN. Monitoramento de fatores de risco para doenças crônicas por meio de entrevistas telefônicas: métodos e resultados no município de São Paulo. Rev Saúde Pública 2005; 39 (1): 47-57.
16. Ainsworth BE, Haskell, WL, Whitt MC, Irwin ML, Swartz AM, Strath SJ, o’Brien WL, Bassett Jr DR, Schmitz KH, Emplaincourt PO, Jacobs Jr DR, Leon AS. Compendium of physical activities: an update of activity codes and MET intensities. Med Sci Sports Exerc 2000; 32: S498-504.
17. World Health Organization. Physical status: the use and interpretation of anthropometry. WHO Technical report series 854. Geneva: WHO, 1995.
18. Stata Corporation. Stata Statistical Software: release 8.0. College Station, TX: Stata Corporation, 2003.
19. Centers for Disease Control and Prevention. BRFSS in action: a state-by-state listing of how data are used. Nation Center for Chronic Disease Prevention and Health Promotion. [Available at http://www.cdc.gov/ nccdphp/dataused.htm]; 2003. Accessed on July 23, 2006.
20. Caspersen CJ, Mathew MZ. Physical activity and cardiovascular health. In: The Prevalence of Physical Inactivity in the United States. Champaign: Human Kinetics Books; 1997. p. 32-39.
21. Florindo AA. Latorre MRDO, Jaime, PC, Tanaka T, Zerbini CAF. Metodologia para a avaliação da atividade física habitual em homens com 50 anos ou mais. Rev Saúde Pública 2004; 38 (2): 307-14.
22. Gomes VB, Siqueira KS, Sichieri R. Atividade física em uma amostra probabilística da população do município do Rio de Janeiro. Cad Saúde Pública 2001; 17 (4): 969-76.
23. Dias-da-Costa JS, Hallal PC, Wells JCK, Daltoé T, Fuchs SC, Menezes AMB, Olinto MTA. Epidemiology of leisure-time physical activity: a population-based study in southern Brazil. Cad Saúde Pública 2005; 21 (1): 275-82.
24. Ministério da Saúde. Instituto Nacional do Câncer. Inquérito Domiciliar sobre Comportamentos de Risco e Morbidade Referida de Doenças e Agravos não Transmissíveis (INCA). Brasil, 15 capitais e Distrito Federal 2002/2003. Available at http//www.saude/ alimentacaoenutricao/documentos. [Accessed on June 15, 2006.]
25. Jardim, PCBV, Gondim, MRPG, Monego, ET, Humberto, GM, Priscila, VOV, Weimar, KSBS et al. Hipertensão arterial e alguns fatores de risco em uma capital brasileira. Arq Bras Cardiol 2007; 88 (4): 452-7.
26. Duncan, BB, Schmidt, MI, Polanczyk, CA, Homrich, CS, Rosa, RS, Achutti, AC. Fatores de risco para doenças não transmissíveis em área metropolitana na região sul do Brasil. Prevalência e simultaneidade. Rev Saúde Pública
1993; 27 (1): 43-8.
27. Martinez-Gonzalez MA, Varo JJ, Santos JI, De Irala J, Gibney M, Kearney J. Prevalence of physical activity during leisure time in the Europe Union. Med Sci Sports Exerc 2001; 33: 1142-6.