SUMMARY
Objective: To analyze physical activity in diferent domains (work, transportation, housework and leisure) as a predictor of the absence of frailty. Methods: An epidemio-logical cross-sectional study with a random sample of 622 individuals aged ≥ 60 years was carried out in Uberaba, MG, Brazil. Receiver operating characteristic (ROC) curves were generated and compared with physical activity in diferent domains and the absence of frailty. Cutofs points of physical activity (minutes/week) were established to predict the absence of frailty. A conidence interval of 95% was established in order to ind the largest areas under the ROC curves for work, transportation, household and leisure. he total physical activity and its domains were assessed by the international physical activ-ity questionnaire. he index of frailty (unintentional weight loss, functional limitation to chair rise, handgrip strength, physical activity and exhaustion) was based on the study by Fried; the participants were dichotomously classiied as not frail and frail. Results: he prevalence of frailty was 19.7% (men) and 20% (women). Physical activity of moderate or vigorous intensity accumulated in diferent domains for 145 minutes/week for women and 140 minutes/week for men or 85 minutes/week for women and 112.5 minutes/week for men for activities in the leisure domain showed the best cutof to predict the absence of frailty. Conclusion: he practice of physical activity, especially in leisure time or ac-cumulated in diferent domains, contributes to the prevention of frailty in the elderly.
Keywords: Motor activity; frail elderly; aging.
©2012 Elsevier Editora Ltda. All rights reserved.
Study conducted at Universidade de Brasília (UnB), Postgraduate Program in Health Sciences, Brasília, DF, Brazil
Submitted on: 10/11/2011
Approved on: 02/10/2012
Financial Support: Fundação de Amparo à Pesquisa do Estado de Minas Gerais FAPEMIG Process #: APQ-03000-10, Brazil
Correspondence to: Sheilla Tribess Universidade Federal
do Triângulo Mineiro Instituto de Ciências da Saúde Av. Getúlio Guaritá, 199, Centro Educacional, 3° andar, sala 313
Uberaba – MG, Brazil CEP: 38025-440 Phone: (34) 3318-5973 [email protected]
Conflict of interest: None.
Physical activity as a predictor of absence of frailty in the elderly
SHEILLA TRIBESS1, JAIR SINDRA VIRTUOSO JÚNIOR2, RICARDO JACÓDE OLIVEIRA3
1 PhD in Health Sciences, Adjunct Professor, Universidade Federal do Triângulo Mineiro (UFTM), Uberaba, MG, Brazil 2 PhD in Health Sciences, Adjunct Professor, UFTM, Uberaba, MG, Brazil
INTRODUCTION
Population aging is a worldwide phenomenon with conse-quences on several aspects of society. Among the concerns created by the increase in life expectancy, quality of life ap-pears as one of the most important, since there is a consid-erable increase in continuous use of drugs in old age due to the high prevalence of chronic degenerative diseases.
he pathological processes themselves generate dam-age and inconvenience to the elderly; however, the great-est loss occurs in functional limitations and in the in-ability to perform the social tasks of daily life. his set of aspects that involves a sequence of aging processes is called “biological frailty syndrome”, herein called frailty.
In spite of the lack of a concise deinition of what char-acterizes the state of frailty, there are common features that indicate that this concept is broad and dynamic, involving both physiological and psychosocial aspects1-4. Frailty in
the elderly individual is related to a greater predisposi-tion to morbidities, falls, hospitalizapredisposi-tions, institupredisposi-tional- institutional-izations and mortality5-8, as there is a decreased resistance
to stressors and lower energy reserves, in which a cycle of exacerbation of mutual decline in multiple systems results in energy deicit, sarcopenia, decreased muscle strength and strain tolerance1,7.
Regular physical activity has been shown to be protec-tive against several components of frailty in older men and women9, including sarcopenia, functional impairment,
cognitive performance and depression10. Even though the
level of physical activity is commonly indicated as part of the components of frailty, it is essential to establish cutof points for diferent domains of physical activity in min-utes per week to enhance the prediction of frailty in the elderly.
Physical activity is a human behavior characterized by any body movement of skeletal muscles resulting in energy expenditure11, which can be assessed in the
fol-lowing domains: occupational, transportation, house-work and leisure.
he human aging process leads to a decrease in physical activity practices and studies have reported that women present the biggest decline, when compared with
men12,13. Moreover, the housework domain seems to have
an important role in the distribution of time devoted to the practice of physical activity by women12,14. Regardless of
the domain, increasing the level of physical activity is im-portant for the health of the individual14; however, in the
leisure domain the beneits seem to be higher due to the ludic characteristic, the higher potential for communi-ty involvement and the maintenance of an active lifescommuni-tyle. hus, the objective of this study was to analyze the predictive power and identify the cutofs of physical ac-tivity in their diferent domains for the absence of frailty in elderly individuals of both genders.
METHODS SUBJECTS
his study is part of the Population Study of Physical Ac-tivity and Aging (Estudo Populacional de Atividade Física e Envelhecimento – EPAFE), with a cross-sectional design which evaluated a population of 10,683 individuals aged 60 years or more, of both genders, living in the city of Uberaba, Minas Gerais, located in the Southeast Region of Brazil, in the period from May to August 2010.
he characterization of the elderly was age 60 years or more, proposed by the United Nations15 for developing
countries. hus, the sample consisted of individuals aged 60 to 96 years of age, selected randomly using the Epi Info 7 sotware; the selection was home-based and representa-tive of the urban area proportional to the district, the fam-ily health team and gender.
When determining the sample size, the procedures pro-posed by Luiz and Magnanini16 for inite populations were
used. In this calculation a signiicance level of 5% (corre-sponding to a conidence interval of 95%, z [a]/2 = 1.96) and tolerable sampling error of 3% were adopted, result-ing in a required sample of 490 subjects to estimate the prevalence of frailty in 14%. his irst estimate of sample size was increased by 20% in order to explore the adjusted associations between frailty and the domains of physical activity, in addition to a 10% increase to compensate for any loss, resulting in a minimum total sample of 647 el-derly individuals.
Among the selected elderly, nine no longer lived at the provided address, four refused to participate in the study, two had died, two died during the course of the research and eight questionnaires had incomplete information and were excluded from the study. hus, the inal study sample consisted of 622 elderly (218 men and 406 women) aged > 60 years.
COLLECTEDDATA
For the evaluation a multidimensional interview, applied individually, which consisted of sociodemographic, physi-cal and mental health, physiphysi-cal activity level and the index of frailty aspects, was created. he sociodemographic data were age, education (years of schooling), marital status (single, married/living with partner, widowed, divorced/ separated), current occupation (retired/pensioner, home-maker, paid work), living arrangements (lives alone, lives alone with spouse, lives with spouse/children, lives with spouse/children/grandchildren) and family income (ex-pressed in number of minimum wages).
he physical and mental health aspect refers to the presence of self-reported diseases and cognitive impair-ment assessed by the mini-impair-mental state examination, orig-inally developed by Folstein et al.17 and validated for the
PHYSICALACTIVITY
he level of usual physical activity was obtained using the long version of the International Physical Activity Questionnaire (IPAQ)19, adapted for the elderly20, which
provides examples of activities that are common for the elderly and ill-in ields of information to record the time, considering the hours and minutes usually used for ev-ery day in the week, instead of only indicating the weekly frequency and total time spent to perform these physical activities.
he IPAQ has questions related to physical activities in a typical week of moderate and intense activity, lasting for at least 10 continuous minutes, divided into four do-mains of physical activity: work, transportation, house-work and leisure/recreation, as well as sitting time, which was not used in this study.
FRAILTY
Frailty was measured according to the modiied ver-sion of Fried et al.1, being identiied by the presence of
three or more of the ive assessed components: decreased handgrip strength in the dominant hand, measured by a dynamometer, adjusted for gender and body mass index (BMI); unintentional weight loss > 5% of body weight in the previous year; reports of “exhaustion” evaluated by the question “Do you feel full of energy?” of the geriat-ric depression scale (GDS-15) by Sheik and Yesavage21,
validated for the Brazilian population by Almeida and Almeida22; functional limitation at the chair rise,
evalu-ated by the elderly individual’s incapacity to rise ive con-secutive times from the chair without using the arms; and low level of physical activity (< 150 min/week of physical activity).
DATAANALYSIS
he characterization of the variables was shown as means, standard deviations, minimum and maximum values and frequencies. To compare the distribution of variables according to gender, Student’s t-test for inde-pendent samples (continuous data) and the chi-square test (categorical data) were used.
he predictive power and the cutofs of diferent pat-terns and domains of physical activity for the absence of frailty were identiied by receiver operating characteristic (ROC) curves, frequently used to determine cutofs for diagnostic or triage tests23.
Initially, the total area under the ROC curve was identiied among the physical activity patterns in their diferent domains (work, transportation, housework, lei-sure) and total physical activity (the four domains ana-lyzed together) for the absence of frailty. he larger the area under the ROC curve, the greater the discrimina-tory power of physical activity for the absence of frailty.
A conidence interval (CI) of 95% was adopted to deter-mine whether the predictive capacity of physical activity patterns in their diferent domains was not due to chance, and its lower limit should not be < 0.5024.
Subsequently, the sensitivity and speciicity were cal-culated and cutof points for the physical activity pat-terns in their diferent domains (work, transportation, housework and leisure) and total physical activity for the absence of frailty. he values identiied through ROC curves consist in the cutof points that should promote a more appropriate balance between sensitivity and speci-icity for physical activity as the discriminator for the ab-sence of frailty. Data were analyzed using the statistical program MedCal, release 11.4.4.
his study followed the ethical principles of the Dec-laration of Helsinki and Resolution #196/96 of the Na-tional Health Council. Research protocols were evaluated and approved by the local Research Ethics Committee (Protocol #. 1521/2009). Study participants signed an in-formed consent.
RESULTS
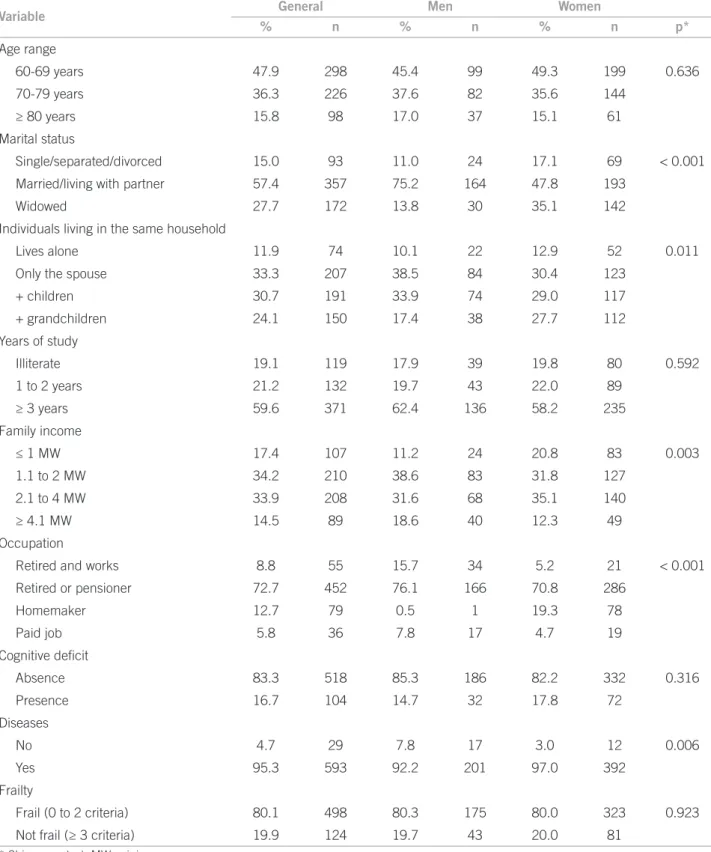
Six hundred twenty-two individuals (65% females and 35% males), aged 60-96 years with a mean age of 71.08 years (SD = 7.77) were studied. he majority of the el-derly individuals were married or lived with a partner (57.4%); lived in multigenerational households (54.9%), speciically bigenerational (30.7%, grandparents and grandchildren); had low educational level, since 40.3% had a maximum of two years of schooling and 19.1% were illiterate; 72.7% were retired or pensioners and had low monthly income, of which 51.6% received up to two minimum wages (R$ 1,020.00) (Table 1).
Mild to moderate cognitive impairment was detect-ed in 16.7% (n = 104) of the elderly, present in 14.7% of the men and 17.8% of the women interviewed; although the rate of cognitive decline was higher for women, the difference was not significant. As for frailty, it was found that 19.9% of the individuals were frail and 80.1% were not frail, with a similar frequency between genders (Table 1).
Variable General Men Women
% n % n % n p*
Age range
60-69 years 47.9 298 45.4 99 49.3 199 0.636
70-79 years 36.3 226 37.6 82 35.6 144
≥ 80 years 15.8 98 17.0 37 15.1 61
Marital status
Single/separated/divorced 15.0 93 11.0 24 17.1 69 < 0.001 Married/living with partner 57.4 357 75.2 164 47.8 193
Widowed 27.7 172 13.8 30 35.1 142
Individuals living in the same household
Lives alone 11.9 74 10.1 22 12.9 52 0.011
Only the spouse 33.3 207 38.5 84 30.4 123
+ children 30.7 191 33.9 74 29.0 117
+ grandchildren 24.1 150 17.4 38 27.7 112
Years of study
Illiterate 19.1 119 17.9 39 19.8 80 0.592
1 to 2 years 21.2 132 19.7 43 22.0 89
≥ 3 years 59.6 371 62.4 136 58.2 235
Family income
≤ 1 MW 17.4 107 11.2 24 20.8 83 0.003
1.1 to 2 MW 34.2 210 38.6 83 31.8 127
2.1 to 4 MW 33.9 208 31.6 68 35.1 140
≥ 4.1 MW 14.5 89 18.6 40 12.3 49
Occupation
Retired and works 8.8 55 15.7 34 5.2 21 < 0.001 Retired or pensioner 72.7 452 76.1 166 70.8 286
Homemaker 12.7 79 0.5 1 19.3 78
Paid job 5.8 36 7.8 17 4.7 19
Cognitive deicit
Absence 83.3 518 85.3 186 82.2 332 0.316
Presence 16.7 104 14.7 32 17.8 72
Diseases
No 4.7 29 7.8 17 3.0 12 0.006
Yes 95.3 593 92.2 201 97.0 392
Frailty
Frail (0 to 2 criteria) 80.1 498 80.3 175 80.0 323 0.923
Not frail (≥ 3 criteria) 19.9 124 19.7 43 20.0 81
* Chi-square test; MW, minimum wages.
Table 1 – Characteristics of the elderly – Uberaba, MG, Brazil
compared with men (172.7 min/week, SD = 166.8 ver-sus 54.3 min/week, SD = 90.4). Table 2 shows the areas under the ROC curves with their respective conidence intervals for physical activity in the diferent domains as predictors of the absence of frailty. ROC curves were constructed for males and females.
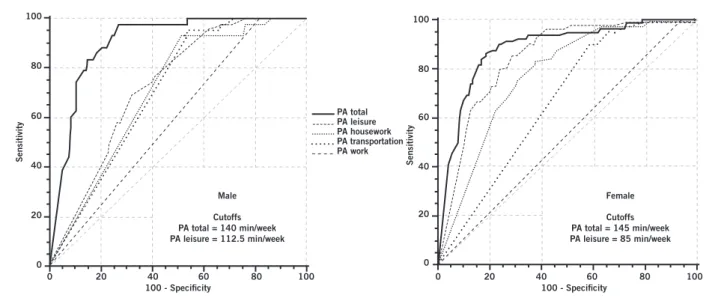
Figure 1 – Cutoffs with respective sensitivities and specificities of total physical activity and the domain of leisure physical activity as predictors of frailty in male and female elderly individuals – Uberaba, MG, Brazil. PA, physical activity.
Domains Total Men Women
PA leisure 0.68 (0.65-0.72) 0.72 (0.65-0.76) 0.67 (0.62-0.71)
PA work 0.55 (0.51-0.59) 0.59 (0.52-0.66) 0.53 (0.48-0.58) PA transportation 0.75 (0.72-0.79) 0.72 (0.66-0.78) 0.78 (0.73-0.82)
PA housework 0.78 (0.75-0.81) 0.71 (0.64-0.77) 0.84 (0.80-0.88) Total PA 0.89 (0.86-0.91) 0.90 (0.86-0.94) 0.86 (0.85-0.92)
PA, physical activity; ROC, receiver operating characteristic.
Table 2 – Area under the ROC curve and 95% confidence interval between the domains of physical activity as predictors of absence of frailty in elderly individuals – Uberaba, MG, Brazil
0 0 20 40 60 80 100
20 40 60 80 100
100 - Specificity 100 - Specificity
Male
Cutoffs PA total = 140 min/week PA leisure = 112.5 min/week
Female
Cutoffs PA total = 145 min/week PA leisure = 85 min/week
Sensitivity
0 20 40 60 80 100
0 20 40 60 PA total
PA housework PA transportation PA work PA leisure
80 100
Sensitivity
he cutof points, with their respective sensitivities and speciicities of total physical activity (work, transportation, housework and leisure activities) and of the leisure/recre-ation domain as predictors of the absence of frailty for el-derly males and females can be seen in Figure 1.
For elderly women, the cutof point determined for to-tal physical activity was 145 min/week (sensitivity of 0.844 and speciicity of 0.814), and for the leisure activity do-main it was 85 min/week (sensitivity of 0.951 and speciic-ity of 0.316).
As for elderly men, the cutof points of moderate to vigorous intensity physical activities for the leisure do-main was 112.5 min/week (sensitivity of 0.977 and speci-icity of 0.320) and for total physical activities, the equiv-alent of 140 min/week (sensitivity of 0.977 and speciicity of 0.731).
DISCUSSION
Although frailty represents a construct that is hard to un-derstand, it is a key marker for the diagnosis of human health, especially for the elderly, regardless of the consid-ered features. he diagnosis of frailty allows the medical
practitioner to anticipate the decline in social function that is related to the processes of functional incapacity and iso-lation of the elderly at home. Also, the evaluation of the physical activity level provides additional information on health problems, regarding both functional limitations and functional incapacity14,25,26.
here is a consensus in the literature regarding the role of physical activity in preventing and even treating
frail-ty9,27,28 but few studies have attempted to identify the
pre-dictive power of physical activities in their several domains as a discriminator of the absence of the frailty.
In the present study, the physical activity domains (work, transportation, housework and leisure) showed to be potential predictors for frailty. he increase in time spent on physical activities in any domain results in a greater protection of the body from the onset of incapaci-tating processes and, consequently, frailty. However, more emphasis was given to leisure activities, due to the fact that this domain is commonly highlighted in the literature9,29-31.
he establishment of cutof points (minutes per week) for physical activity through the ROC curves allow for the indication of values for which there is higher optimization of sensitivity as a function of speciicity to discriminate the absence of frailty in the elderly. For physical activities of leisure, a period of 85 min/week was the cutof point to predict frailty in women, which is lower than that found for men in the same domain (112.5 min/week). he cul-tural aspects of gender in the country can be a possible explanation for the diferences.
In general, when men retire from their work activities, they appear to sufer more severe functional impairment due to the rapid decline in physical activities regardless of the analyzed domain; thus, there is a greater dependence on physical activities during leisure12. On the other hand,
for elderly women the change in their routine with ad-vancing age is less striking due to the intense volume of the physical activities in the household, which cause less dependence for leisure activities, within the range of rec-ommended physical activity12,14.
he areas of the curves for the diferent physical activi-ty domains showed a more elevated area in the housework domain for women when compared to men and the mean time spent on such activities by women is more than three times that spent by men.
he greater exposure of women to domestic activities is positive due to increased energy expenditure; on the other hand, these women still belong to a generation with transportation restrictions in areas related to leisure and work, as they are still bound to the household responsibil-ities32, in addition to losses in communication and social
function due to the tendency of isolation from family with the possible departure of children to live with their spous-es and the death of friends of the same age range25,33. he
prevalence of frailty was similar between the genders, de-spite the greater longevity of women together with greater exposure to functional risk behavior.
When analyzing the total time of physical activity, el-derly women, diferently from what was seen in leisure activities, require more time of physical activity (145 min/ week) than men (140 min/week) to avoid frailty. hese data reinforce the previous comments, which mentioned the higher dependence of men on leisure activities and therefore, the involvement of other domains would be reduced.
Some limitations should be highlighted in the study, such as its cross-sectional nature, which prevents verify-ing the cause and efect association between the variables; the measurements of self-perception may have been inlu-enced by the low educational level of participants and by their motivational aspects. However, the statistical proce-dure used in the study allowed the estimation of the cut-of values cut-of physical activity and the results are close to
the scores recommended by the literature. Moreover, the evaluators of the study were trained in order to minimize motivational interference and even to adjust explanations during the interview to the possible doubts of the respon-dents in the face of variations in levels of schooling.
he amount of physical activity required to preserve the health of individuals is a subject that has been dis-cussed for a few decades in epidemiology, especially by certain studies34-37. hese studies have shown that the
higher the level of physical activity, the lower the chances of developing chronic degenerative diseases, with rela-tively modest levels of physical activity for approximately 150 minutes per week being suicient to provide signii-cant protective efects to several diseases34,35,38.
he beneits of physical activity for health and longev-ity are a consensus among experts in gerontology, con-stantly demonstrated by several scientiic societies and institutions through documents that highlight the im-portance of encouraging the practice of physical activi-ties in public health actions. Similarly, discussions on the subject have been frequent in recent decades, such as the World Assembly on Ageing, the numerous forums held by the World Health Organization (WHO), the United Nations (UN) and societies of gerontology and geriatrics from diferent countries.
he sociodemographic characteristics of the elderly in this study are similar to those reported in surveys in Latin America, a fact that emphasizes the potential gen-eralization of the present results to other populations39.
Although the total time spent in physical activity prac-tices was lower than the score deined for physical activ-ity as one of the indicator criteria for frailty, the values were relatively close to the recommended 150 min/week. However, the major contribution of this study is the pos-sibility of simplifying the estimation of physical activity, given the limitations to estimate the total time spent in physical activities practiced by the elderly; the sole as-sessment of activities in the leisure domain are suicient to predict frailty.
CONCLUSION
he results of this study indicated that physical activity performed during leisure time and total physical activity (work, transportation, housework and leisure) can predict the absence of frailty in the elderly. Regarding the amount necessary to prevent frailty, it is suggested that men should have 140 min/week and women 145 min/week of physi-cal activity of moderate to vigorous intensity, accumulated in the four domains. Similarly for the domain of leisure physical activity, 85 min/week for women and 112.5 min/ week for men would be suicient to predict frailty among the elderly.
REFERENCES
1. Fried LP, Tangen CM, Walston J, Newman AB, Hirsch C, Gottdiener J, et al. Frailty in older adults: evidence for a phenotype. J Gerontol A Biol Sci Med Sci. 2001;56:146-56.
2. Ensrud KE, Ewing SK, Taylor BC, Fink HA, Stone KL, Cauley JA, et al. Frailty and risk of falls, fracture, and mortality in older women: the study of osteopo-rotic fractures. J Gerontol A Biol Sci Med Sci. 2007;62:744-51.
3. Rockwood K, Andrew M, Mitnitski A. A comparison of two approach-es to measuring frailty in elderly people. J Gerontol A Biol Sci Med Sci. 2007;62:738-43.
4. Buchman AS, Wilson RS, Bienias JL, Bennett DA. Change in frailty and risk of death in older persons. Exp Aging Res. 2009;35:61-82.
5. Al Snih S, Graham JE, Ray LA, Samper-Ternent R, Markides KS, Ottenbacher KJ. Frailty and incidence of activities of daily living disability among older Mexican Americans. J Rehabil Med. 2009;41:892-97.
6. Wong CH, Weiss D, Sourial N, Karunananthan S, Quail JM, Wolfson C, et al. Frailty and its association with disability and comorbidity in a community-dwelling sample of seniors in Montreal: a cross-sectional study. Aging Clin Exp Res. 2010;22:54-62.
7. Bauer JM, Sieber CC. Sarcopenia and frailty: a clinician’s controversial point of view. Exp Gerontol. 2008;43:674-8.
8. Chen CY, Wu SC, Chen LJ, Lue BH. he prevalence of subjective frailty and factors associated with frailty in Taiwan. Arch Gerontol Geriatr. 2010;50:43-7. 9. Peterson MJ, Giuliani C, Morey MC, Pieper CF, Evenson KR, Mercer V, et al.
Physical activity as a preventative factor for frailty: the health, aging, and body composition study. J Gerontol A Biol Sci Med Sci. 2009;64:61-8.
10. Landi F, Abbatecola AM, Provinciali M, Corsonello A, Bustacchini S, Mani-grasso L, et al. Moving against frailty: does physical activity matter? Biogeron-tology. 2010;11:537-45.
11. Caspersen CJ, Powell KE, Christenson GM. Physical activity, exercise, and physical itness: deinitions and distinctions for health-related research. Public Health Rep 1985;100:126-31.
12. Benedetti TRB, Borges LJ, Petroski EL, Gonçalves LHT. Atividade física e es-tado de saúde mental de idosos. Rev Saúde Pública. 2008;42:302-7. 13. Najdi A, El Achhab Y, Nejjari C, Norat T, Zidouh A, El Rhazi K. Correlates of
physical activity in Morocco. Prev Med. 2011;52:355-7.
14. Tribess S, Virtuoso Júnior JS, Petroski EL. Fatores associados à inatividade física em mulheres idosas em comunidades de baixa renda. Rev Salud Publica. 2009;11:39-49.
15. Organização das Nações Unidas – ONU. Assembléia Mundial sobre Envelhe-cimento, resolução 39/125. Viena: Organização das Nações Unidas; 1982. 16. Luiz RR, Magnanini MF. A lógica da determinação do tamanho da amostra em
investigações epidemiológicas. Cad Saúde Coletiva. 2000;8:9-28.
17. Folstein MF, Folstein SE, McHugh PR. Mini-mental state: a practical method for grading the cognitive state of patients for the clinician. J Psychiat Res. 1975;12:189-98.
18. Almeida OP. Mini exame do estado mental e o diagnóstico de demência no Brasil. Arq Neuropsiquiatr. 1998;56:605-12.
19. Craig CL, Marshall AL, Sjöström M, Bauman AE, Booth ML, Ainsworth BE, et al. International physical activity questionnaire: 12-country reliability and validity. Med Sci Sports Exerc. 2003;35:1381-95.
20. Benedetti TRB, Mazo GZ, Barros MVG. Aplicação do questionário internacio-nal de atividades físicas (IPAQ) para avaliação do nível de atividades físicas de mulheres idosas: validade concorrente e reprodutibilidade teste-reteste. Rev Bras Ciênc Mov. 2004;12:25-34.
21. Sheik JL, Yesavage JA. Geriatric depression scale (GDS): recent evidence and develpment of shorter version. Clin Gerontol. 1986;32:397-407.
22. Almeida OP, Almeida AS. Coniabilidade da versão brasileira da escala de depressão em geriatria (GDS) versão reduzida. Arq Neuropsiquiatr. 1999;57:421-6.
23. Erdreich LS, Lee ET. Use of relative operating characteristics analysis in epi-demiology: a method for dealing with subjective judgment. Am J Epidemiol. 1981;114:649-62.
24. Schisterman EF, Faraggi D, Reiser B, Trevisan M. Statistical inference for the area under the receiver operating characteristic curve in the presence of ran-dom measurement error. Am J Epidemiol. 2001;154:174-9.
25. Virtuoso Júnior JS, Guerra RO. Fatores associados às limitações funcionais em idosas de baixa renda. Rev Assoc Med Bras. 2008;54:430-5.
26. Costa TB, Neri AL. Medidas de atividade física e fragilidade em idosos: dados do FIBRA Campinas, São Paulo, Brasil. Cad Saúde Pública. 2011;27:1537-50. 27. Faber MJ, Bosscher RJ, Chin A Paw MJ, van Wieringen PC. Efects of exercise
programs on falls and mobility in frail and pre-frail older adults: a multicenter randomized controlled trial. Arch Phys Med Rehabil. 2006;87:885-96. 28. Matsuda PN, Shumway-Cook A, Ciol MA. he efects of a home-based
ex-ercise program on physical function in frail older adults. J Geriatr Phys her. 2010;33:78-84.
29. Salvador EP, Florindo AA, Reis RS, Costa EF. Perception of the environ-ment and leisure-time physical activity in the elderly. Rev Saúde Pública. 2009;43:972-80.
30. Zaitune MP, Barros MB, César CL, Carandina L, Goldbaum M, Alves MC. Factors associated with global and leisure-time physical activity in the el-derly: a health survey in São Paulo (ISA-SP), Brazil. Cad Saúde Pública. 2010;26:1606-18.
31. Lee DC, Sui X, Ortega FB, Kim YS, Church TS, Winett RA, et al. Comparisons of leisure-time physical activity and cardiorespiratory itness as predictors of all-cause mortality in men and women. Br J Sports Med. 2011;45:504-10. 32. Biasoli-Alves ZMM. Continuidades e rupturas no papel da mulher brasileira
no século XX. Psic Teor Pesq. 2000;16:233-9.
33. Gazalle FK, Lima MS, Tavares BF, Hallal PC. Sintomas depressivos e fa-tores associados em população idosa no Sul do Brasil. Rev Saúde Pública. 2004;38:365-71.
34. Blair SN, Kohl HW, Gordon NF, Pafenbarger RS Jr. How much physical activ-ity is good for health? Annu Rev Public Health. 1992; 13:99-126.
35. Pate RR, Pratt M, Blair SN, Haskell WL, Macera CA, Bouchard C, et al. Physi-cal activity and public health: a recommendation from the Centers for Dis-ease Control and Prevention and the American College of Sports Medicine. JAMA.1995;273:402-7.
36. Warburton DE, Katzmarzyk PT, Rhodes RE, Shephard RJ. Evidence-based guidelines for physical activity of adult Canadians. Appl Physiol Nutr Metab.2007;32:17-74.
37. American College of Sports Medicine, Chodzko-Zajko WJ, Proctor DN, Fi-atarone Singh MA, Minson CT, Nigg CR, et al. American College of Sports Medicine position stand. Exercise and physical activity for older adults. Med Sci Sports Exerc.2009;41:510-30.
38. Sins J, Hill K. Physical activity recommendations for older Australians. Austra-las J Ageing.2010;29:81-7.