A Model for the Formation of Niobium Structures by anodization
Ana Carolina Viero Bianchina, Guilherme Reis Maldanera, Luciane Thaís Fuhra, Lilian Vanessa
Rossa Beltramib, Célia de Fraga Malfattib, Ester Schmidt Riederc, Sandra Raquel Kunstd*,
Cláudia Trindade Oliveiraa
Received: May 22, 2016; Revised: March 22, 2017; Accepted: May 10, 2017
The luoride use for anodizing electrolytes has been primarily responsible for the formation of nanoporous oxides at valve metals, except aluminum, since it causes a dissolution process. This study presents the formation of an oxide model according to the following anodizing parameters: 100 V, 12.73 mA/cm², room temperature and the niobium samples anodized in niobium oxalate and oxalic acid electrolytes without and with the addition of HF for 5, 30 and 60 min. The anodized samples were analyzed morphologically by scanning electron microscopy (SEM), energy dispersive spectroscopy (EDS), atomic force microscopy (AFM) and the hydrophobicity of the samples was assessed by the sessile drop method. The presence of luor in the niobium oxalate electrolyte formed oxides with lower a dissolution and a low hydrophobicity compared to the one formed in oxalic acid was attributed to the incorporation of niobium and oxalate ions. Thereby, the model proposed in this paper showed that during anodization the migration of the luoride ion into the oxide occurs at high speed, which results in the formation of microcones, leading to the formation of discrete layers of porous oxide.
Keywords: Niobium, Anodization, Porous oxide, Ammonium niobium oxalate, Oxalic acid
* e-mail: [email protected]
1. Introduction
Niobium belongs to the group of high melting point metals, it has good ductility, it is resistant to corrosion and capable of forming a self-protecting oxide ilm on its surface1. The nanoporous oxide niobium can be used in various applications such as gas sensors, catalysts and catalytic matrices, optical and electrochromic devices2-4, solar cells5,6, lithium batteries7, etc.
Niobium nanostructures have been obtained mainly through the anodizing process, in which it is possible, according to the process parameters, to control the dimensions of the formed oxides. According to Su and Zhou et. al.8 the anodizing process has been applied to many metals, such as aluminum, niobium, magnesium, zirconium, titanium, tantalum, etc. In the anodizing process the metal is connected as the anode and the cathode may be any conductive material that is non-reactive to the electrolyte. Once the external voltage is on, the hydrogen ions are reduced to produce hydrogen gas at the cathode and the metal, and the aluminum case is oxidized releasing Al3+ cations. Some cations are dissolved
in the electrolyte and some form the oxide layer on the metal surface.
In the speciic case of niobium, the oxide ilm grows into bilayer structures, corresponding to an internal NbOx (x≈1) layer, with under1 nm of thickness (typical value of 0.6 nm), regardless of the preparation method, and an external Nb2O5 layer, in which the thickness depends on the time and varies according to the preparation method9,10. This indicates that two types of oxide layers may be produced, depending on the type of electrolyte used: a barrier oxide layer (non-porous) with a uniform thickness and a porous oxide layer containing an oxide ilm which has pores or micro nanoescales11.
The porous anodization in valve metals, except the aluminum, has been conducted primarily with the use of hydroluoric acid (HF), where multiple authors are creating and reporting oxide growth models12,13. According to Kowalski
et al.14, a high electric ield is necessary for the growth of the oxide layer. This growth of the anodic oxide comprises the simultaneous migration of metal cations to the ilm interface and anions of the electrolyte to the ilm interface, forming the ilm in both the metal/ilm interface and in the ilm/electrolyte interface.
However, not all anodization made with luoride-based electrolytes results in perfect nanoporous structures15.
Some researchers report the peeling of oxide layers and the formation of microcones during anodization16-18, which has led a ICET, University Feevale, Novo Hamburgo, RS, Brazil
b LAPEC, Federal University of Rio Grande do Sul - UFRGS, Porto Alegre, RS, Brazil
c ULBRA, Lutheran University of Brazil, Canoas, RS, Brazil
to eforts to elucidate the formation of these nanostructures and microstructures due to the dissolution caused by luoride19. A recent model reports that the luorine present in the electrolyte migrates with a greater speed toward the electrolyte/oxide during anodization in comparison to the oxygen, which causes the dissolution of the oxide and the formation of luoride complexes within the metal. These complexes would be soluble in the presence of water and thereby cause an intense dissolution, consequently forming irregular oxides19,20.
Another model shows the formation of discontinuous layers of oxide due to stress caused during the growth of oxides. In addition to this, a third model shows that the addition of luoride can also result in microcones in the oxides, which are related to the crystallization of the oxide16-18.
Thus, this study proposes a model to explain the formation of nanostructures and microcones, as well as the formation of discontinuous layers of niobium oxide obtained by anodization in organic electrolytes with the addition of HF, with a variation in the anodization time.
2. Experimental Procedures
A plate of pure niobium (99.8%) was used for the anodizing process, which has been provided by Sigma-Aldrich.
2.1. Surface preparation and anodization process
The surface of the niobium samples were prepared before the anodization. They were gradually abraded with 600, 800, 1200, 2400 and 4000 silicon carbide (SiC) sandpaper. After the grinding process the samples were polished with 1 μm diamond paste and alcohol in the polisher, from Pantec, model Polipan-U. The following samples were etched in a 60% nitric acid solution (HNO3) + 40% hydroluoric acid (HF), stirring for 1 min 30 s to clean the samples. After, the samples were washed with deionized water and assembled in the anodizing system, a cell with two electrodes.
The sample was connected as the anode and a platinum cathode was used. The supply voltage used was 300 V - 0.5 A, coupled to a computer with a software for recording data. The exposed area of the sample to be anodized was 0.785 cm², limited by an anodizing container opening and sealing ring. The anodizing was conducted with an application potential of
100 V and a current density of 12.73 mA/cm². The anodizing started in galvanostatic mode until the potential reached 100 V passing the potentiostatic mode and were performed for 5, 30 e 60 minutes for each electrolyte, at room temperature. The electrolytes used for the anodizing process were niobium oxalate, provided by CBMM (Companhia Brasileira de Metalurgia e Mineração) and oxalic acid.
2.2. Calculating the concentration of the electrolytes
The results obtained in the anodizing process were compared considering that both electrolytes present oxalate ions in their composition. The concentration of electrolytes was calculated according to the same amount of oxalate ions.
For this purpose, the method was applied according to the solubility of the salts to be used. As the anodizing process was condicted at room temperature, the calculation of the concentration was done to a temperature of 25°C. At this temperature the solubility of niobium oxalate is approximately 60 g/L.
To calculate the concentration of the electrolyte its molecular weights ought to be considered. The molecular weight of the oxalate íon (C2O4
-2) is 88.02 g/mol, ammonium niobium oxalate (NH4[NbO(C2O4)2(H2O)2].n(H2O); n=1) is 338.95 g/mol and oxalic acid (C2H2O4.2H2O) is 126.02 g/mol. The calculated concentration of niobium oxalate was 0.177 mol.L-1. It is required that both electrolytes have the same amount of oxalate ion; therefore, in order to avoid errors, we chose to use 0.15 mol.L-1 rather than 0.177 mol.L-1. Therefore, the calculated amount of the oxalate ion present in 0.15 mol.L-1 of niobium oxalate was 26.4 g.L-1. This value was used to calculate the concentration of oxalic acid. Thus, the concentration of the electrolyte used was 0.15 mol.L-1 of niobium oxalate 0.30 mol.L-1 of oxalic acid.
In order to obtain porous structures, it HF (hydroluoric acid) was added to the electrolytes. The anodizing process was carried out with lower concentrations of HF (2.24 % v/v), which did not result in the formation of porous structures. Therefore, only the anodizing process that resulted in the formation of pores was performed, which were with additions of 2.24 % v/v of HF for the electrolytes containing the oxalate. Table 1 shows the concentrations, pH and conductivity of the electrolytes used.
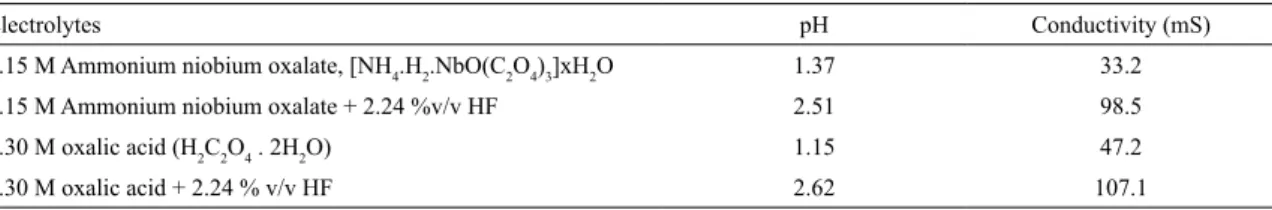
Table 1. Electrolytes used in the anodization of niobium samples.
Electrolytes pH Conductivity (mS)
0.15 M Ammonium niobium oxalate, [NH4.H2.NbO(C2O4)3]xH2O 1.37 33.2
0.15 M Ammonium niobium oxalate + 2.24 %v/v HF 2.51 98.5
0.30 M oxalic acid (H2C2O4 . 2H2O) 1.15 47.2
In order to simplify the presentation of the results, the nomenclature adopted for identifying the samples is shown in Table 2.
2.3. Experimental techniques
2.3.1. Scanning electron microscopy (SEM)
Anodized samples were metallized with gold target for electrical conduction and imaging. After metallization, the samples were analyzed for morphology in top view and for thickness in cross section. For the cross-section analysis, the samples were placed in liquid nitrogen for a few seconds and then immediately broken. A JEOL equipment was used, model JSM-6510LV, located in the Laboratory of Advanced Studies in Materials at the University Feevale. A microprobe was attached o this equipment, which allows the EDS (Energy Dispersive Spectroscopy) test to be conducted.
2.3.2. Atomic Force Microscopy (AFM)
The AFM analysis of the Nb anodised samples were performed in the atomic force microscope SHIMADZU, model SPM 9500J3, available at the Corrosion Research Laboratory (LAPEC) of the Federal University of Rio Grande do Sul (UFRGS). The scan area was 50 µm x 50 µm. The evaluation of the surface roughness was made with the measures of Ra (the Ra parameter is deined as the arithmetic average of the absolute values of the roughness proile ordinates in relation to the mean line in the samples and Rz), measures of Rz (this parameter is the sum of the maximum height of the proile peaks, Zp, with the maximum depth of the proile valleys, Zv). It indicates the average distribution of the vertical surface and may have a high surface deinition.
2.3.3. Wettability
The wettability analysis was performed on an apparatus developed by the Corrosion Research Laboratory (LAPEC) of the Federal University of Rio Grande do Sul (UFRGS). This technique was used to determine the water contact angle of the oxide that was formed, by using the the sessile drop method , in order to check the hydrophilicity of the oxide.
3. Results and Discussion
3.1. Anodization transients
Figure 1 shows the potential transientes versus time (V x T) and the current density x time (i x t) of the niobium samples anodized in 0.15 M niobium oxalate with and without addition of 2.24 % HF and 0.30 M oxalic acid without and with the addition of 2.24% HF for 5, 30 e 60 minutes, respectively. For comparison purposes, the curves are shown up to 300 seconds.
It is noted that all V x T curves exhibit a similar behavior regardless of the anodization time of. In the beginning of the anodization process a linear increase in te hpotential as a function of time is observed, until the potential reaches 100V, which generates a constant (∂V/∂t) called anodization rate21. In this same period, the current density remains constant. After reaching 100V, the potential remains constant and the current density decreases. This decrease of the current density may reach zero, depending on the type of electrolyte.
The curves show a variation in the current density of the samples containing HF, which are not shown in Figure 1 because they were plotted to 300s. Therefore, Table 3 shows the calculation of the mean and standard deviation of the current densities obtained from 200 to 300 s, 1000 to 1800s that it 3000 to 3600. In addition, it shows the anodizing rate
Table 2. Nomenclature for the identiication of the samples according to the conditions of anodization.
Sample Conditions of anodization
ON-5 0,15 M Ammonium niobium oxalate – 5 minutos
ON-30 0,15 M Ammonium niobium oxalate – 30 minutos
ON-60 0,15 M Ammonium niobium oxalate – 60 minutes
ONHF-5 0,15 M Ammonium niobium oxalate + 2,24 % v/v HF – 5 minutes ONHF-30 0,15 M Ammonium niobium oxalate + 2,24 % v/v HF – 30 minutes ONHF-60 0,15 M Ammonium niobium oxalate + 2,24 % v/v HF – 60 minutes
AO-5 0,30 M oxalic acid – 5 minutes
AO-30 0,30 M oxalic acid – 30 minutes
AO-60 0,30 M oxalic acid – 60 minutes
Figure 1. Potential transients and current versus time during anodization: (a) ammonium niobium oxalate, (b) ammonium niobium oxalate
with HF, (c) oxalic acid and (d) oxalic acid with HF.
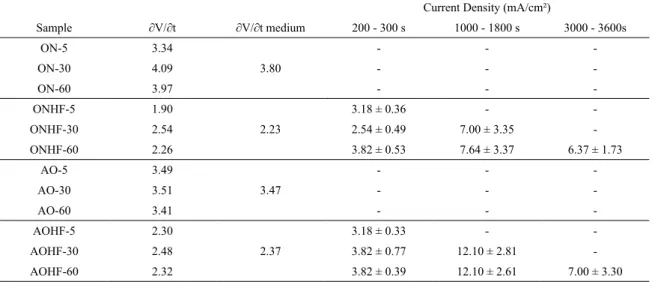
Table 3. Anodization rate (mean and standard deviation) and current density for all conditions of anodization.
Current Density (mA/cm²)
Sample ∂V/∂t ∂V/∂t medium 200 - 300 s 1000 - 1800 s 3000 - 3600s
ON-5 3.34
3.80
- -
-ON-30 4.09 - -
-ON-60 3.97 - -
-ONHF-5 1.90
2.23
3.18 ± 0.36 -
-ONHF-30 2.54 2.54 ± 0.49 7.00 ± 3.35
-ONHF-60 2.26 3.82 ± 0.53 7.64 ± 3.37 6.37 ± 1.73
AO-5 3.49
3.47
- -
-AO-30 3.51 - -
-AO-60 3.41 - -
-AOHF-5 2.30
2.37
3.18 ± 0.33 -
-AOHF-30 2.48 3.82 ± 0.77 12.10 ± 2.81
-AOHF-60 2.32 3.82 ± 0.39 12.10 ± 2.61 7.00 ± 3.30
with the average and the standard deviation for all anodizing conditions. The analysis of the anodization curves of samples anodized in niobium oxalate and oxalic acid without HF according to Table 3, shows that the anodization rate of the two electrolytes are similar. As electrolytes do not have HF in their composition, the anodization rate observed is related to the growth of the barrier oxide ilms. In addition, the
current density in both cases undergoes a sudden drop and acquires a null value by the end of the anodization process. This behavior is characteristic of the formation of barrier ilms, in which the entire current is used for the formation of the ilm7,18,22,23.
(Table 3) also depicts a similar behavior in both electrolytes in relation to the anodization rate. Moreover, the current density increases with the anodization time. This behavior was similar to those reported previously by other authors who performed anodization in H2SO4 and in H3PO4 solutions containing HF4,24. The authors describe the formation of the barrier layer (with decreasing current density) and the subsequent growth of the nanoporous outer layer (with increasing current density and stabilization) 5.
For niobium oxalate electrolyte, the measured current density between 1000 and 1800s was lower, and represented approximately 60% of that obtained with the oxalic acid, indicating that the dissolution process is lower in the electrolyte. This may be related to the incorporation of the niobiuma ion (Figure 2a) compared to the incorporation of the oxalate ion (Figure 2b).
3.2.1. SEM analysis of samples anodized with niobium oxalate and oxalic acid without HF.
Figure 4 shows the micrographs in top view and cross section of the oxides obtained in niobium oxalate for diferent anodization times. It is observed that the samples in top view exhibit less a pronounced morphology with spherical dimples thanthose obtained only the etched sample. This indicates the formation of a very thin oxide on the sample surface, which is the barrier characteristic of oxide formation.
Figure 2. Basic molecular structure of the anion of niobium oxalate
(a) and anion oxalate (b).
The niobium ion presents, besides the oxalate ions, niobium and oxygen in its composition. The incorporation of these elements may promote the formation of an oxide with fewer defects, which could inhibit or decrease the dissolution process.
3.2. Morphological characterization of the
anodised niobium samples
Figure 3 shows the morphology of niobium after the etching process prior to being anodized. A homogeneous surface with dimples can be observed, which was expected due to the surface treatment process with HF.
Figure 3. SEM micrography of the niobium surface after pickling
process.
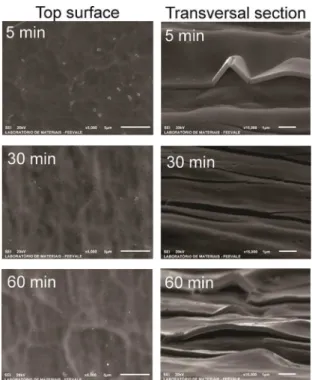
Figure 4. SEM micrography of the the top view and cross section
of the anodized niobium at 0.15 M ammonium niobium oxalate at 5 minutes, 30 minutes and 60 minutes (12.73 mA/cm², 100 V).
According to the micrographs in cross-section, there is a compact oxide without pores, in agreement with the formation of barrier oxide. Its measured value of thickness is 243 nm (±0.026) for the ON-5 sample, 254 nm (±0.019) for the ON-30 sample and 290 nm (±0.017) for the ON-60 sample.
The thickness of the oxides increases with the anodization time. However, this increase is more pronounced during the irst seconds of anodization, whch indicates a rapid formation of the barrier layer. This is in accordance with the potential and the current density observed during anodization. In the irst few seconds of anodization, the potential increases rapidly, and the current is stable, indicating the formation of the oxide barrier.
same is maintained constant, theoretically, the oxide thickness should not increase. Added to this, the fall of the current indicates that the oxide barrier acts as a resistance preventing or hindering the passage of current, and thus hindering the dissolution. As porosity is not observed in the cross sections and as a reduction in the thickness of the oxides does not occur, it can be assumed that there is no dissolution or that dissolution is minimal, depending on the anodization time.
Figure 5 shows the micrographs in top and cross section of the anodized samples of oxalic acid without HF.
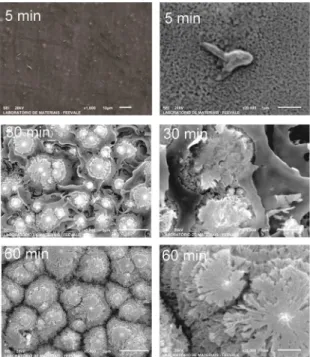
At 5 min into the anodizing process it was observed that despite the morphological features being similar to the etched sample (Figure 6), small pores are formed, which indicates the dissolution process from the addition of HF in the electrolyte. The dissolution becomes more intense with the increase in the anodization time, in which there is the formation of pores at 30 min. As early as 60 min, there is the formation of small cones, with an aspect that resembles microcones.
According to Oikawa et al.15, the development of the
microphones occurs for larger anodizing times, and is associated with a crystallization of the oxide during the anodization process and the preferential chemical dissolution of the amorphous oxides. Each microcone consists of branched niobium oxide nanoibers. Karlinsey et al. 18 also attributes the formation of microphones to the anodization time in electrolytes containing only HF in their composition. In this case, the increase of the anodization time, not only the individual cones increase in size, but there is also an increase of population thereof.
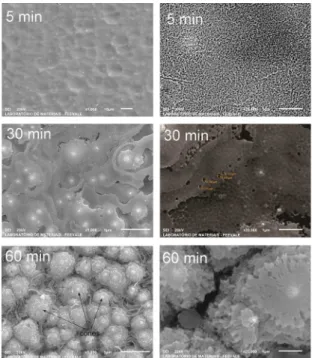
Figure 7 shows the SEM micrographs of the anodized niobium sample in 0.30 M oxalic acid with the addition of 2.24% HF for 5, 30 and 60 min. Within 5 minutes of anodization, it can be observed that the morphology of the oxide is similar to that observed in the sample that has only been etched. This shows that this oxide has a greater thickness than that observed in the ammonium niobium oxalate containing HF. In addition, the porosity observed in a larger increase for the sample anodized for 5 min is
Figure 5. SEM micrography of the top view and the cross section
of the anodized niobium at 0.30 M ammonium niobium oxalate at 5 minutes, 30 minutes and 60 minutes (12.73 mA/cm², 100 V).
A similar behavior was observed in both electrolytes (niobium oxalate and oxalic acid, both without HF) in relation to the morphology. Taaaaaaaaahere is a decrease in the oxide thickness after anodizing for 60 min. This behavior was not expected, since the curves for the rates of anodization and oxide formation (∂V/∂t) for the two electrolytes without HF were similar (Figure 1). In this case, it can be assumed that the oxide formed with oxalic acid presents more defects in its amorphous structure than that formed with niobium oxalate due to the incorporation of niobium ion and oxalate ion.
3.2.2. SEM analysis of samples anodized with niobium oxalate and oxalic acid with HF.
Figure 6 shows the SEM micrographs of the anodized niobium in 0.15 M niobiuma oxalate with the addition of 2.24% HF for 5, 30 and 60 min.
Figure 6. SEM micrography of the anodized niobium at 0.15 M
Figure 7. SEM micrography of the anodized niobium at 0.30 M
oxalic acid with 2.24% HF at 5 minutes, 30 minutes and 60 minutes (12.73 mA/cm², 100 V).
more intense than that observed in the ammonium niobium oxalate HF. The samples anodised for 30 and 60 min showed efects which are similar to the anodised niobiuma oxalate. However, it was observed that the dissolution was more intense with the oxalic acid than the niobiuma oxalate, with the formation of microcones at 30 min. One explanation for this would be the formation of a more defective oxide in oxalic acid than in the ammonium niobium oxalate due to the incorporation of niobium and oxalate ions.
3.2.3. Analysis of the cross section
Figure 8 shows the micrographs of the cross section of the niobium oxide formed in 0.15 M niobium oxalate + 2.24 % v/v HF at 12.73 mA/cm², 100V at 5, 30 and 60 min. Within 5 minutes of anodization pores begin to form the oxide surface. With the increase in the anodization time, the formation of discontinuous layers and microcones on the surface of the oxide occurs. According to the images depicted in Figure 8 the thicknesses of oxides were measured (Table 4). For comparison purposes, the results obtained in previous tables are shown again. Within 5 min of anodization, the porous oxide has a thickness of 375 nm and the barrier oxide of 126 nm, with an average total thickness of 568 nm. The addition of HF seems to increase the total oxide thickness in approximately 233%.
With the increase in the anodization time to 30 minutes, there is an increase in the oxide thickness, 3747 nm, with the formation of discontinuous layers and microcones. This thickness continues to grow, reaching 6594 nm in 60 min.
This behavior is consistent with the increased current density observed at 30 and 60 minutes of anodization, in which there is an increase of the porous layer and a consequent dissolution.
Figure 9 shows the micrographs of the cross section of the niobium oxide formed in 0.30 M oxalic acid + 2.24 % v/v HF at 12.73 mA/cm², 100V at 5 min, 30 min e 60 min. These oxides exhibit similar behavior to those obtained in niobiuma oxalate with the formation of porous oxide layers and staple forming microcones.
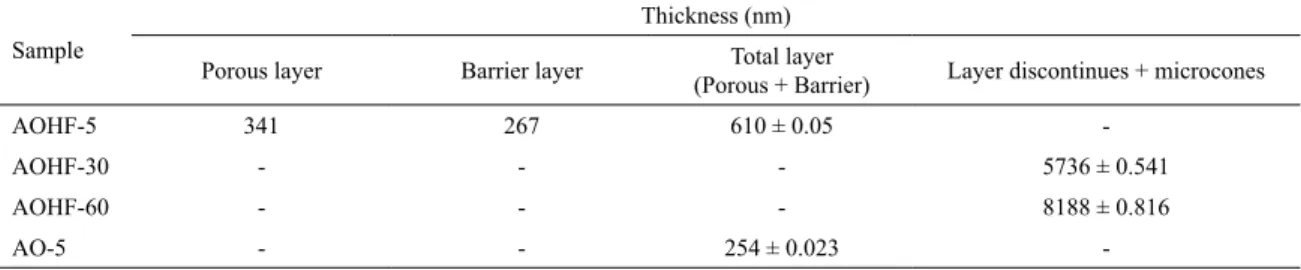
In 5 minutes of anodizing porous and barrier oxides with a total thickness of 610 nm were observed. The thickness increased by 240% with the addition of HF. With the increase of the anodization time, thicknesses were measured to 5736 nm (for 30 min) and 8188 nm (for 60 min), greater than those measured in ammonium niobium oxalate oxalate. This behavior is consistent with the higher current densities, depending on the anodization time, observed for this electrolyte compared to the ammonium niobium oxalate electrolyte. According to the micrographs of Figure 9 the thickness values of the oxides were obtained, as shown in Table 5.
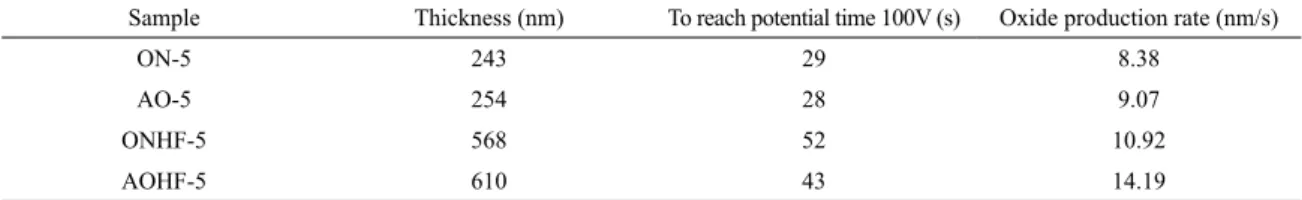
The samples were compared considering the rate of oxide formation, and are shown in Table 6. Since there was an increase in the thickness of the oxides (due to etching and to the formation of microcones) formation rates were calculated only for samples anodized for 5 min, according to the following equation.
Rate of oxide production = thickness/time up to 100V
It is observed that the production of the oxides increases with the addition of HF and it is higher for the oxalic acid. This indicates the oxide formation with a greater number of defects than that formed in the ammonium niobium oxalate, which is in agreement with previous results. On the other hand, if the HF caused only dissolution in the oxide, the formation rate would be lower, which was not observed. According to Karlinsey et al.18, it is possible to perform anodization in electrolytes containing only HF. In this case, the HF causes dissolution, but does not inhibit the oxide formation, or inhibits it very little.
3.3. A Model for the formation of oxides according
to the anodization time for samples anodized
in ammonium niobium oxalate and oxalic acid
with addition of HF
Figure 8. SEM micrography of the cross section of the anodized niobium at 0.15 M ammonium niobium oxalate with 2.24%
HF at 5 minutes, 30 minutes and 60 minutes (12.73 mA/cm², 100 V).
Table 4. Measure of the oxide thickness obtained by anodizing in ammonium niobium oxalate without and with in diferent times.
Sample
Thickness (nm)
Porous layer Barrier layer (Porous + Barrier)Total layer Layer discontinues + microcones
ONHF-5 375 126 568 ± 0.035
-ONHF-30 - - - 3747 ± 0.301
ONHF-60 - - - 6594 ± 0.803
-Figure 9. SEM micrography of the cross section of the anodized niobium at 0.30 M oxalic acid with 2.24% HF at 5 minutes,
30 minutes and 60 minutes (12.73 mA/cm², 100 V).
Table 5. Measure of the oxide thickness obtained by anodizing in oxalic acid without and with in diferent times.
Sample
Thickness (nm)
Porous layer Barrier layer (Porous + Barrier)Total layer Layer discontinues + microcones
AOHF-5 341 267 610 ± 0.05
-AOHF-30 - - - 5736 ± 0.541
AOHF-60 - - - 8188 ± 0.816
-Table 6. Production rate of oxides obtained in the anodised made in 5 min.
Sample Thickness (nm) To reach potential time 100V (s) Oxide production rate (nm/s)
ON-5 243 29 8.38
AO-5 254 28 9.07
ONHF-5 568 52 10.92
AOHF-5 610 43 14.19
oxides according to the model suggested by Oikawa et al.15
e Yang et al.16.
The oxides presented here follow the two models suggested. However, the sample anodized in 5 min in oxalic acid containing HF (Figure 10 a) presented the formation of supposedly crystalline oxide in the oxide metal interface. Figure 10 (b) shows the same sample seen by another angle.
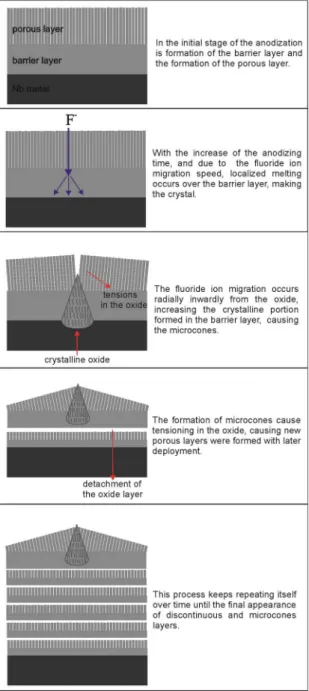
The formation of the oxide beneath the barrier layer seems to have a radial growth. As the formation intensity in this oxide is higher than one formed in niobiuma oxalate, which was evidenced by the current density measured between 1000 - 1800 and by the obtained thickness, one can assume that the luoride ion migration is more pronounced in this electrolyte. Therefore, the luoride ion migrates through the oxide, thus forming a porous layer14. Continuing the migration, the luoride ion reaches the barrier layer where a new oxide is formed radially. Since the migration of these ion in the electrolyte/oxide interface modiies the morphology of the oxide barrier, it is assumed that this occurs at high speed, leading to an increase in the temperature in the barrier oxide and consequently in the formation of crystalline oxide25. This
would also explain the formation of the rounded surface observed in the oxide barrier/metal interface. Therefore, we suggest the following model for the formation of oxides according the anodization time (Figure 11). The model steps are described next to each igure.
3.4. EDS analysis
In order to verify the incorporation of luoride ion in anodised samples with HF, EDS analyzes were performed at three diferent points in all samples.
Figure 10. Oxide formation on the sample with oxalic acid + HF at 5 minutes of anodization.
All samples anodized in the electrolytes containing HF presented luoride in their composition and also C and O possibly from the oxalate ion (C2O4
2-), present in the electrolytes, with the exception of the sample AOHF-5. The EDX technique is a semiquantitative analysis, which indicates a reliability only of the elements and not their amounts, hence, it is possible to predict the formation of oxide as per the amount of oxygen present in the measurements and incorporation of electrolyte elements.
Although the sample AOHF-5 has presented only Nb in its composition, it cannot be said that there is no incorporation of electrolyte elements in oxide. This may be due to the oxide being thin (of the nanometer order) and the EDS being located. Further analysis at diferent points of the sample would be required. Therefore, the incorporation of luorines to the oxides enables the model proposed in Figure 11.
3.5. AFM analysis
The AFM analysis allows the determination of surface roughness parameters in oxides. As the samples anodized at 30 and 60 min showed discontinuities and microcones it was not possible to analyze these samples. Therefore, these analyzes were done only in samples anodized in electrolyte containing HF, for 5 min. For comparison purposes, the non-anodized sample was also analyzed by AFM. The images obtained by AFM are shown in Figure 12.
Figure 11. Model for the formation of oxides containing discontinuous
layers and microcones.
Figure 12. 3D AFM images of the niobium samples: (a) prepared for anodization, (b) 0.15 M ammonium niobium oxalate with 2.24%
HF in 5 minutes and (c) 0.30 M oxalic acid with 2.24% HF in 5 minutes.
Therefore, table 7 shows the obtained Ra and Rz values. According to the Ra parameter, the roughness value decreases with anodization. On the other hand, the Rz values are similar to those obtained for the porous layers of the anodized oxide in the electrolytes containing HF, which is in accordance with the measured thickness values.
Table 7. Roughness of the anodized samples.
Sample Ra (nm) Rz (nm)
Niobium 150,5 702,3
ONHF-5 133,8 537,0
AOHF-5 96,3 604,2
3.6. Wettability analysis
In Figure 13 the images and values of the contact angle of the sessile drop method are shown, respectively, for the anodized samples.
It is observed that the non-anodized sample (igure 13) presented a hydrophilic surface with a contact angle of 57°. This behavior was expected, since the sample was etched and presented as spherical cavities as shown by the SEM morphological analysis (igure 3). The sample anodized in 5 min in ammonium niobium oxalate had a more hydrophobic behavior compared to the sample anodized in oxalic acid, which can be related to the incorporation of ammonium niobium and oxalate ions in the oxide during the anodization. According to Yang et al. 16 super hydrophobic surfaces have been achieved with the application of coatings on porous samples masking the surface roughness.
The values in Table 8 are in accordance with the results obtained from the analysis by AFM (Table 7) in which diferent Rz values were obtained for both samples, in which the roughness of the sample anodized in oxalic acid is greater than that obtained in ammonium niobium oxalate.
Figure 13. Contact angle imagens of the samples: a) niobium without anodized; niobium anodized at 0.15 M ammonium
niobium oxalate with 2.24% HF in (b) 5 min, (c) 30 min and (d) 60 min; and niobium anodized at 0.30 M oxalic acid with 2.24% HF at (e) 5 min, (f) 30min and (g) 60 min.
Table 8. Contact angle values.
Sample Contact angle (º)
Niobium 57 ± 1.68
0NHF-5 108 ± 2.00
0NHF-30 71 ± 2.03
0NHF-60 109 ± 0.67
AOHF-5 72 ± 1.22
AOHF-30 72 ± 1.68
AOHF-60 89 ± 0.58
min, the anodized samples exhibit the same behavior of the samples anodized in 5 min. In this case, the wettability behavior of the samples is related to the formation and the angle of the microcones.
Figure 14 shows the samples anodized in both electrolytes with the addition of HF in 60 min. Microcones formed in niobiuma oxalate showed larger cones and with a higher edge angle than those obtained from oxalic acid.
According to Yang et al.16, larger microcones with a higher edge angle are preferable for improving the water contact angle, obtaining a more hydrophobic surface.
Figure 14. SEM micrography of the cross section of the oxide formade
at (a) 0.15 M ammonium niobium oxalate with 2.24% HF in 60 minutes and (b) 0.30 M oxalic acid with 2.24% HF in 60 minutes.
4. Conclusions
This article presented a model for the formation of oxides under the conditions of anodization. Therefore, the niobium samples were anodized in electrolytes containing ammonium niobium oxalate and oxalic acid with and without the addition of HF for 5, 30 and 60 min.
with an increase in the thickness of the oxide over time. Furthermore, the addition of HF to the electrolytes resulted in the formation of nanoporous structures, microcones and in the detachment of the oxide. However, the addition of HF to the ammonium niobium oxalate electrolyte caused a lower level of dissolution than that of oxalic acid which has been assigned to the smallest number of defects in that oxide due to the incorporation of ammonium niobium oxalate and oxalate ions.
The results obtained in the analysis by EDS show that there is an incorporation of the luoride, carbon and oxygen ions, which makes the proposed model viable.
With the AFM analysis, it was found that the roughness measurements agree with the observed porosity measurements of samples obtained in ammonium niobium oxalate and oxalic acid for the samples anodized for 5min.
Considering the wettability analysis, it is possible to conclude that the samples anodized in ammonium niobium oxalate showed a hydrophobic behavior compared to the ones anodized in oxalic acid. This was attributed to the incorporation of ammonium niobium and oxalate ions in 5 min samples. For the 60 min samples, this behavior was due to the edge angle of the formed microcones.
According to the results, the proposed model suggests the migration of luoride ions into the oxide at a high speed which would lead to localized melting and crystallization in the barrier layer, originating the microcones. This would cause a strain in the oxide, leading to the detachment of the porous layer, with the formation of a new porous layer concurrently with the formation of microcones.
5. Acknowledgments
The authors would like to express their gratitude for the inancial support of CAPES (the Brazilian Governmental agency for the development of human resources) and CNPq (the Brazilian National Council for Scientiic and Technological Development), and to CBMM for providing niobium oxalate and to the Laboratory of Advanced Studies in Materials from Feevale University.
6. References
1. Alves AR, Coutinho AR. The Evolution of the Niobium Production in Brazil. Materials Research. 2015;18(1):106-112.
2. Tsuchiya H, Schmuki P. Thick self-organized porous zirconium oxide formed in H2SO4/NH4F electrolytes. Electrochemistry
Communications. 2004;6(11):1131-1134.
3. Choi J, Lim JH, Lee SC, Chang JH, Kim KJ, Cho MA. Porous niobium oxide ilms prepared by anodization in HF/H3PO4.
Electrochimica Acta. 2006;51(25):5502-5507.
4. Tzvetkov B, Bojinov M, Girginov A, Pébère N. An electrochemical and surface analytical study of the formation of nanoporous oxides on niobium. Electrochimica Acta. 2007;52(27):7724-7731.
5. Rani RA, Zoolfakar AS, Ou JZ, Field MR, Austin M, Kalantar-zadeh K. Nanoporous Nb2O5 hydrogen gas sensor. Sensors and
Actuators B: Chemical. 2013;176:149-156.
6. Rani RA, Zoolfakar AS, Subbiah J, Ou JZ, Kalantar-zadeh K. Highly ordered anodized Nb2O5 nanochannels for dye-sensitized
solar cells. Electrochemistry Communications. 2014;40:20-23.
7. Yoo JE, Park J, Cha G, Choi J. Micro-length anodic porous niobium oxide for lithium-ion thin ilm battery applications.
Thin Solid Films. 2013;531:583-587.
8. Su Z, Zhou W. Porous Anodic Metal Oxides. Science Foundation
in China. 2008;16(1):16-36.
9. D’Alkaine CV, de Souza LMM, Nart FC. The anodic behavior of niobium - I. The state of the art. Corrosion Science.
1993;34(1):109-115.
10. D’Alkaine CV, de Souza LMM, Nart FC. The anodic behavior of niobium - II. General experimental electrochemical aspects.
Corrosion Science. 1993;34(1):117-127.
11. Zhou X, Nguyen NT, Özkan S, Schmuki P. Anodic TiO2 nanotube
layers: Why does self-organized growth occur-A mini review.
Electrochemistry Communications. 2014;46:157-162.
12. De Wit HJ, Crevecoeur C. The dielectric breakdown of anodic aluminum oxide. Physics LettersA. 1974;50(5):365-366.
13. Sato N. J. Indian Chem. Soc. 2001;78:517-524.
14. Kowalski D, Kim D, Schmuki P. TiO2 nanotubes, nanochannels
and mesosponge: Self-organized formation and applications.
Nanotoday. 2013;8(3):235-264.
15. Oikawa, Y, Minami T, Mayama H, Tsujii K, Fushimi K, Aoki Y, et al. Preparation of self-organized porous anodic niobium oxide microcones and their surface wettability. Acta Materialia.
2009;57(13):3941-3946.
16. Yang S, Habazaki H, Fujii T, Aoki Y, Skeldon P, Thompson GE. Control of morphology and surface wettability of anodic niobium oxide microcones formed in hot phosphate-glycerol electrolytes. Electrochimica Acta. 2011;56(22):7446-7453.
17. Yang S, Aoki Y, Habazaki H. Efect of electrolyte temperature on the formation of self-organized anodic niobium oxide microcones in hot phosphate-glycerol electrolyte. Applied
Surface Science. 2011;257(19):8190-8195.
18. Karlinsey RL. Preparation of self-organized niobium oxide microstructures via potentiostatic anodization. Electrochemistry
Communications. 2005;7(12):1190-1194.
19. Shimizu K, Kobayashi K, Thompson GE, Skeldon P, Wood GC. Anodic oxide ilms on tantalum: Incorporation and mobilities of electrolyte-derived species. Philosophical Magazine Part B. 1996;73(3):461-485.
20. Shimizu K, Kobayashi K, Thompson GE, Skeldon P, Wood GC. The Migration of Fluoride Ions in Growing Anodic Oxide Films on Tantalum. Journal of the Electrochemical Society.
1997;144(2):418-423.
21. El-Mahdy GA. Formation and dissolution behaviour of niobium oxide in phosphoric acid solutions. Thin Solid Films.
22. Gomes MAB, Onofre S, Juanto S, Bulhões LOS. Anodization of niobium in sulphuric acid media. Journal of Applied
Electrochemistry. 1991;21(11):1023-1026.
23. Choi J, Lim JH, Lee J, Kim KJ. Porous niobium oxide ilms prepared by anodization-annealing-anodization. Nanotechnology.
2007;18(5):055603.
24. Sieber I, Hildebrand H, Friedrich A, Schmuki P. Formation of self-organized niobium porous oxide on niobium. Electrochemistry
Communications. 2005;7(1):97-100.