Abstract
The strain of a structural element is often measured indirectly by determining the strain of a transducer that is supposed to follow the deformation of the element perfectly, and with negligible interac-tion, around the mounting point. However, this assumption is not always true, and depends on the stiffness of the transducer relative to the local stiffness of the piece to which it is attached. This paper deals with the problem of evaluating the influence that a relatively rigid transducer (the HBM SLB-700A was chosen as an example) has on the strain field, studied from both the theoretical and the experimental points of view. The findings of the research have shown that, in order to interpret the measurements obtained from this kind of instruments correctly, the perturbation induced on the strain field cannot be disregarded. A corrective factor, obtained nu-merically by means of the FEM and discussed in the paper, can be used as a first approximation to evaluate the true strain, stress and forces in common structural steel elements.
Keywords
Elastic half-space, finite element analysis, measurement errors, size effects, strain transducers.
Stiffening Effect of Bolt-On Transducers on Strain Measurements
1 INTRODUCTION
In order to evaluate the loads acting on existing structures, with the purpose of assessing their safety under uncertain actions, it is a common practice to glue strain gauges at selected points on the resisting elements, and to connect them to an electronic control and acquisition unit that is able to record the variations of the electric signal related to the local strain. If the material remains within
Mauro Borri-Brunetto a Marco Alessio b
Monica Barbero c Fabrizio Barpi d Valerio De Biagi e Oronzo Pallara f
Department of Structural, Geotechnical and Building Engineering, Politecnico di Torino, Corso Duca degli Abruzzi 24, 10129 Torino, Italy
d [email protected] e [email protected]
http://dx.doi.org/10.1590/1679-78252109
Latin American Journal of Solids and Structures 13 (2016) 536-553
its elastic limits, the state of stress at those points can be calculated easily through standard formulae of the theory of elasticity, and the forces acting on the structural element can also be estimated. On occasion, because of the particular nature of the structure being investigated (e.g., difficult access, hostile environment, etc.) or due to an attempt to reduce the times and costs of the instal-lation of such fragile instruments on already worn surfaces, a different approach can be followed. The use of deformation transducers is an alternative technique. These transducers are designed to be bolted to structural elements whose strain has to be measured, and their adoption minimizes the skills and the time requested for on-site mounting.
The instruments referred to in this paper are produced by Hottinger Baldwin Messtechnik (HBM), and named SLB-700A. Previous experience gained in the installation of this kind of device in different conditions (Barbero et al., 2013, Barbero et al., 2014, Pirulli et al., 2014a, Pirulli et al., 2014b) has suggested that this solution may be a viable alternative to more traditional glued strain gauges, but also that attention has to be paid to their influence on the deformation at the measuring point. This difficulty emerges whenever a measuring device interacts with the measured quantity: for contact measurements, as in the case discussed here, the deformation of the instrument should freely follow the deformation of the surface to which it is attached. If, because of the stiffness of the transducer, the deformation gives rise to a reaction force around the mounting point, the strain, and consequently the measured value, differs from the one that would occur in the absence of the gauge, which has been referred to in the following as the free-field strain.
The perturbation of the strain field induced by the presence of a glued strain gauge has been studied extensively (Campbell and Medbery, 1947, Aleksandrov et al., 1966, Stehlin, 1972), particu-larly with reference to applications to soft materials, such as plastics or biomaterials (Findley and Reed, 1963, Swan, 1973, Beatty and Chewning, 1979, Little et al., 1990, Little, 1992). In the literature, these reinforcement effects are termed local when the strain field is only altered near the gauge, and global if the cross section of the structure is very thin and the gauge itself carries a significant part of the load (Dally and Riley, 2005). Several authors have analysed the influence of gauges on the free-field strain, with the aim of evaluating their magnitude and determining the corrections needed to obtain the true strain from the measured one (Ajovalasit and Zuccarello, 2005, Ajovalasit et al., 2007, Zike and Mikkelsen, 2014).
The usage of bolted deformation transducers with non-negligible stiffness poses a similar problem, namely, the need to assess the perturbing effect of the device on the measured strain for different typical mounting configurations, and to evaluate the adjustment that needs be made to the measure-ments in order to obtain the real strain value.
Latin American Journal of Solids and Structures 13 (2016) 536-553
2 MATERIALS AND METHODS
2.1 The Stiffness of the Transducer
The perturbation of the strain field induced by the presence of a transducer depends on its stiffness, compared to the stiffness of the support. Although the study has dealt with a specific device, the methodology presented in the following is applicable to any instrument that is based on the same concept.
The HBM SLB-700A strain transducer appears as a metallic plate, with a pair of holes at each end, used for bolting (Figure 1(a)), which contains 4 electric strain gauges connected in such a way as to form a Wheatstone bridge. The plate is machined in the central part in order to obtain a recessed zone, which maintains a small clearance (0.9 mm) between the instrument and the piece to which it is fixed. The dimensions of the instrument are shown in Figure 1(b); all the information about the transducer has been taken from the technical literature produced by the manufacturer (HBM, 2013).
(a) (b)
Figure 1: The HBM SLB-700A strain transducer mounted onto a steel profile (a). Schematic with the principal dimensions (millimetres) (b).
The instrument is able to measure the relative axial displacement of its bolted ends up to the nominal strain ±0.0005 (±500 μm/m), which corresponds to an axial force of ±3110 N. The trans-ducer is fastened to the piece by means of four M6 bolts that apply a sufficient normal force to the contacting parts to prevent sliding under the expected working conditions. The deformation of the central part of the transducer, which is 57 mm long and does not touch the underlying piece, is measured considering the voltage variation of the internal Wheatstone bridge.
Using these data, the stiffness of the transducer can be estimated as
(1)
Latin American Journal of Solids and Structures 13 (2016) 536-553
0.02% °C-1, which corresponds to 0.1 μm/(m °C), that is, a negligible value for all practical purposes under normal temperature conditions.
2.2 Perturbation of the Strain Field
The purpose of the installation of a strain transducer of any kind is to measure some components of the strain tensor at a point of the deformed body subjected to the applied loads. A desirable property of a measuring instrument is its negligible influence on the measured quantity. In the case of mechan-ical transducers (glued, clamped, or bolted to the structure), the device follows the local deformation, but this gives rise to forces that alter the original stress and strain fields. These forces are related to the deformation of the transducer through its stiffness, which can be determined for a given instru-ment as shown above for SLB-700A. The effect of the presence of a transducer at a particular location of a structural element depends on the stiffness of both: this interplay is analysed in the following through both an analytical and a numerical approach.
2.2.1 Half-Space Approximation
In order to obtain an estimate of the perturbation induced by a finite-stiffness transducer on the original strain field, the special case of a half-space of isotropic linear-elastic material, subjected to a homogeneous unidirectional stress field at infinity in the direction of a Cartesian reference frame has been considered. The half-space occupies the region, and the state of strain (the infinitesimal deformation theory has been adopted here) is defined by the non-null components
where is Young’s modulus and is Poisson’s ratio. The thus de-termined strain components define the free-field strain for this configuration.
The interaction between the half-space and the transducer was modelled considering the presence of the instrument, simulated by the action of a self-equilibrated force system, consisting of two ho-mogeneous distributions of opposite tangential tractions , directed along the axis and applied to the half-space surface on two equal rectangles, with centres on the axis at distance , and with sides and aligned to the and axes, respectively (Figure 2). The uniform distribution of tan-gential tractions is only a mean-value approximation of the real one, which is the outcome of the frictional contact of the two bodies along the common interface, but the influence of the discrepancies between different distributions is negligible when the relative displacements are calculated, as de-scribed hereafter.
It can be shown that the expression of the local stiffness of the half-space is given by:
(2)
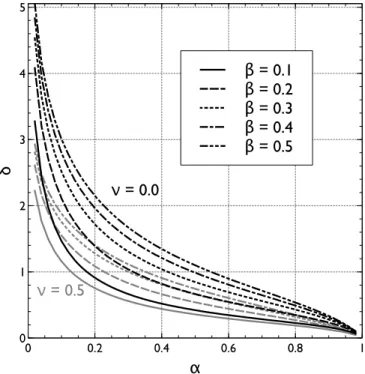
where is a non-dimensional function of the parameters , (see Appendix A). The graphs of the non-dimensional relative displacement are plotted in Figure 3 as functions of the non-dimensional parameters and , for two values of Poisson’s ratio, namely, and
Latin American Journal of Solids and Structures 13 (2016) 536-553
Figure 2: Distributions of opposite tractions qx to evaluate the strain perturbation induced by the deformation
transducer on the half-space surface. The distance between the centres of the loaded rectangles is d. The length and width of the surfaces are denoted by a and b, respectively.
Figure 3: Plots of the non-dimensional relative displacement vs. the non-dimensional length for different values of the non-dimensional width of the loaded zones, and for two Poisson ratio values,
namely, (black curves) and (grey curves).
Using this result, it is possible to calculate the perturbation induced on the strain field by a bolted transducer as follows. Let us consider a transducer giving a measure of its elongation, , correspond-ing to a certain axial force . At the same moment, the same force is applied to the half-space with an opposite sign, thus causing a variation of the original strain field (without the attached instrument). As stated above, the corresponding variation of the displacement is . Elim-inating F, we obtain:
z
x
y
q
xq
xa
b
Latin American Journal of Solids and Structures 13 (2016) 536-553
(3)
or, considering the strains,
(4)
The quantity represents the perturbation of the free-field strain in the half-space caused by the transducer. Considering the measurement as the value of the free-field strain in the half-space introduces an error: the correct magnitude of is larger, namely:
(5)
Considering real situations, where the structural element has finite thickness and finite transversal width, the magnitude of the correction obtained as described above can be considered, roughly speak-ing, as a lower bound. In such a case, the local stiffness of the piece is lower than the stiffness of the half-space, so that is greater than , as discussed in the next section.
2.2.2 Finite-Sized Pieces
The solution to the problem of the perturbation of the strain field induced by a transducer, presented in the previous section, has been obtained for the idealized situation of a strain gauge attached to a half-space: these conditions reproduce a limit model for the real working configuration, where the dimensions of the piece (i.e., thickness and width) are much larger than those of the transducer.
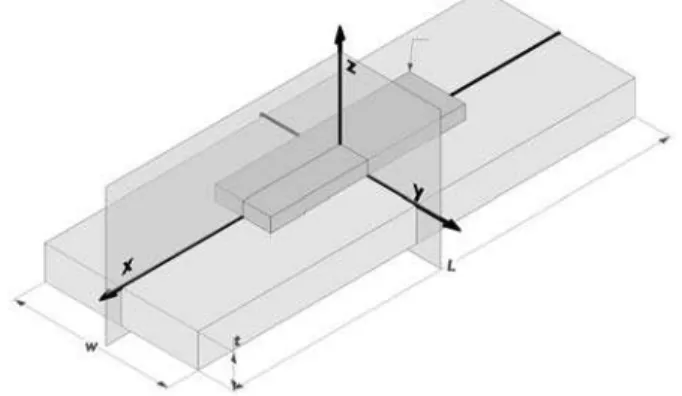
In order to assess the influence of the dimensions of the underlying piece on the perturbation of the strain field, a typical situation has been analysed in which an SLB-700A deformation transducer is sup-posed to measure the axial strain of a steel plate, whose dimensions w, t and L are shown in Figure 4.
Figure 4: Schematic of the configuration analysed with the finite element method. Homogeneous opposite displace-ments in the x direction are imposed on the faces of the plate perpendicular to the y axis. Thanks to symmetry, only
Latin American Journal of Solids and Structures 13 (2016) 536-553
The problem was investigated by means of the Diana finite element code (produced by TNO Diana BV); linear analyses, in which a given displacement was imposed in the axial direction to the plate faces normal to the direction, were carried out. By taking into account appropriate boundary conditions on the two symmetry planes, the analysis was limited to one quarter of the entire domain. Perfect continuity of the displacement field was supposed between the two pieces, i.e., no-sliding conditions were assumed at the contact between the transducer and the plate, and any micro-slip on the interface was neglected.
In order to examine the response of the system, four thickness values ( ) and five width values ( ) were considered, to cover the usual range of dimen-sions of steel profiles.
The elastic constants adopted for the plate were , . The same Pois-son ratio, , was assumed for the transducer, while Young’s modulus was obtained by equating the stiffness obtained from eq. (1) with the stiffness of a homogeneous bar with the same cross section and length as the free central part of the instrument:
(6)
In all cases, a 20-node isoparametric quadratic brick element mesh (type CHX60, TNO Diana (2010), p. 356) was generated within the solid volumes. In each case, the maximum size of the elements was 2 mm.
2.3 Laboratory Tests
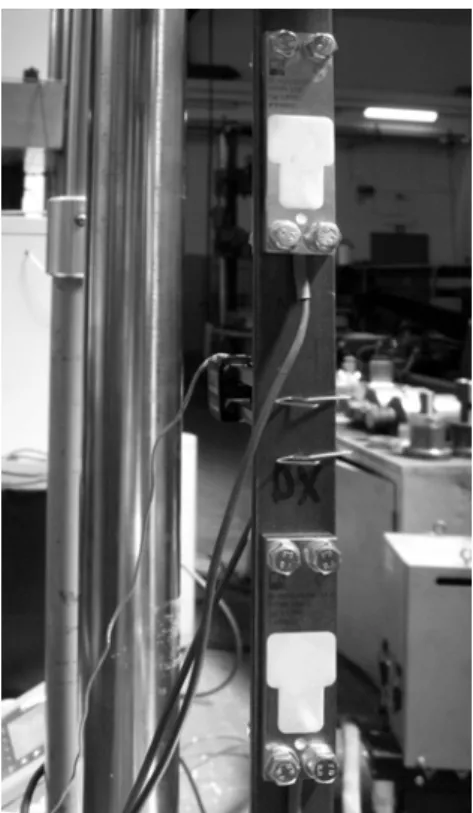
In order to check the correctness of the above presented considerations, and of the consequent nu-merical results, a steel bar was instrumented with two SLB-700A strain transducers, and subjected to a tensile force by means of a 100 kN MTS servo-hydraulic load frame in the laboratory of the Department of Structural, Geotechnical and Building Engineering, at the Politecnico di Torino - Italy. Two transducers were mounted onto a mild-steel bar (30×5 mm nominal rectangular cross section), spaced about 120 mm, placed symmetrically with respect to the midpoint, where a virtually forceless extensometer (MTS 632.24F-50) was installed to obtain an independent reference measurement (Figure 5). This instrument has a gauge length of 25 mm, a maximum strain of 100%, and a maximum non-linearity of 0.3% of the range.
The real area of the cross section was estimated as , on the basis of the mass and length of the bar and the steel density. The surface of the bar was left as produced, i.e., only cleaned of rust and dirt.
In order to test the transducers under both tension and compression, the bar was pre-loaded with a tensile force , corresponding to a mean stress , then the two instru-ments were fixed using ISO property class 8.8 steel bolts, tightened with a torque of 8 Nm, as pre-scribed in the mounting instructions for this material. Quasi-static loading cycles with amplitude
Latin American Journal of Solids and Structures 13 (2016) 536-553
sensitivity under both tension and compression, that is, . No hysteresis of the load-dis-placement curve was detected during the tests, and the contact between the transducer and the piece could therefore be considered free from measurable slip of the interface.
All the signals (load, displacement and strains) were recorded by an HBM Spider 8 control and acquisition unit for further digital processing.
In addition to the mechanical ones, several tests were conducted to assess the influence of tem-perature variations on the measurements, subjecting the unloaded bar with bolted transducers to thermal cycles in the 8-23 °C range. The difference between the readings taken at the highest and lowest values of temperature was used as a measure of the influence of temperature changes on the output of the transducer.
Figure 5: Setup for the SLB-700A comparison tests. The bar is placed vertically between the loading machine grips. The upper and lower transducers are clearly visible. The forceless MTS extensometer can also be seen
on the other side at the midpoint of the bar.
3 RESULTS
3.1 Numerical Calculations
3.1.1 Half-Space Approximation
Latin American Journal of Solids and Structures 13 (2016) 536-553
The value of the local half-space stiffness, , for the geometry of the SLB-700A transducer bolted to a steel piece, is obtained by using eq. (2), with (i.e.,
) and assuming typical values of the elastic constants, e.g., , :
(7)
where is evaluated by means of eqs. (10) and (11). An approximation can also be made by interpolating between the appropriate curves plotted in Figure 3.
By using eq. (5), with the values obtained from eq. (1) and eq. (7) for the stiffness of the transducer and half-space, respectively, we have:
(8)
that is, the free-field strain, in the undisturbed part of the half-space, is about 4% larger than the measured one.
3.1.2 Finite Element Analyses
The finite element analyses of the system consisting of the SLB-700A transducer and the underlying plate show that the state of strain within both pieces is far from being homogeneous, even for relatively large thicknesses of the plate. This result is more pronounced when the plate to which the transducer is bolted is thin. As an example, Figure 6 presents the normalized axial displacement (i.e., the local displacement divided by the imposed remote displacement) along six lines, starting from the x = 0 plane, with y = 0 (see Figure 4), and with z chosen at six levels: bottom, mid-height and top of the plate, and bottom, mid-height and top of the transducer. These results are relative to the case of a 3 mm thick and 50 mm wide plate: in this case, which represents the lower end of the plate size range, it appears that both the plate and the transducer tend to behave as beams subjected to normal force and bending moment, with variable strains along their cross section.
Because of this spatial variability, it is impossible to clearly define the strain of the transducer body. Moreover, in the present FEM simulations, the transducer body was considered as a ‘black box’, that is, a parallelepiped made of a fictitious material with homogeneous elastic properties, which was chosen to obtain a response comparable to the real one, disregarding the internal details of the instrument. In order to present the results of the calculations in a simple way, it has been assumed that the transducer strain was measured considering the elongation of the fibre at mid-height.
Latin American Journal of Solids and Structures 13 (2016) 536-553 Figure 6: Example of the results of the FEM calculations. Axial displacements along the x axis vs. distance from
the centre for t = 3 mm and w = 50 mm, normalized with respect to the maximum. The curves represent the displacement of points of the y = 0 plane along lines parallel to the x axis at different z heights.
Latin American Journal of Solids and Structures 13 (2016) 536-553
3.2 Experimental Results
The results of the thermal tests performed to evaluate the influence of temperature variations (be-tween 8 °C and 23 °C) have made it possible to establish that the spurious strain of thermal origin is less than . As the tests were conducted in a controlled laboratory environment and the typical test duration did not exceed one hour, the estimated maximum temperature change was about 2 °C. Accordingly, the thermal disturbances were neglected in all the elaborations of the results presented hereafter.
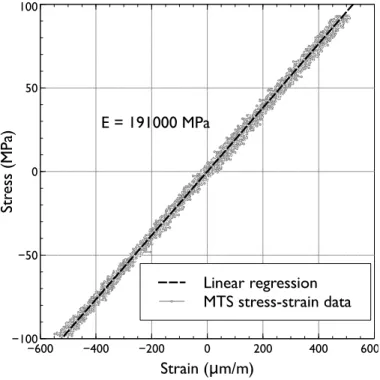
A first check of the experimental setup was carried out by determining the elastic modulus of the steel used in the tests. The data points, determined from a number of load cycles on the bar, are plotted in the stress-strain plane in Figure 8. The strain used for this calculation was obtained from the MTS 632.24-50 transducer, which was used for comparison purposes and placed across the middle section of the bar. The stress values plotted in the graph were obtained by subtracting from the real stress the mean value , so that the null value corresponds to the pre-load force .
Young’s modulus was determined by means of a linear regression of all the data, , rep-resented by the dashed line plotted in Figure 8, obtaining , with . The linear elastic behaviour of the bar in the load range used in the test is clearly confirmed by these results.
The measurements recorded from the two SLB-700A transducers mounted onto the bar are plot-ted in Figure 9, together with the above determined linearized load-strain law ( ). The two instruments show similar behaviour: an appreciable non-linearity, mainly in the compressive range, and a large underestimation of the bar deformation. At full load range and under tension, the trans-ducers give a strain measurement of about 36% of the undisturbed one measured at the midpoint of the bar.
The results of the theoretical and numerical analyses presented in the previous sections show a marked effect of local stiffening of the structural element at the point in which a transducer of non-negligible stiffness is used to determine the state of strain. In the case of the SLB-700A transducer mounted onto steel pieces, this effect appears also in the limit condition of the half-space where, as shown in the previous section, the measured strain is 96% of the free-field one.
Latin American Journal of Solids and Structures 13 (2016) 536-553 Figure 8: Experimental determination of Young’s modulus: stress and strain measured in cyclic axial
loading tests on a 30 mm × 5 mm steel bar.
Figure 9: Strain measured in cyclic axial loading tests on a 30 mm × 5 mm steel bar. SLB-700A (U) and (L) denote the positions of the instruments: upper and lower, respectively. The dashed line corresponds
Latin American Journal of Solids and Structures 13 (2016) 536-553 4 DISCUSSION
The results of the experiments carried out on a steel bar in the elastic range have confirmed these findings: the ratio between the strain measurements obtained from the SLB-700A transducers mounted onto the bar and the free-field strain was 0.36. This value is consistent with the numerical results obtained by means of the FEM. Entering into the graph of Figure 7 the bar parameters, i.e., thickness and width , it is possible to estimate a strain ratio of about 0.38, with a relative difference of about 5%.
From the above considerations it can be seen that when transducers such as the SLB-700A are used to determine the internal reactions in a steel beam (e.g., to evaluate the normal force in a truss element), attention should be paid to the ratio between the stiffness of the transducer and the local stiffness of the steel profile. In fact, neglecting the effects of this interplay leads to an underestimation of the free-field strain and, consequently, of the corresponding force, and thus introduces an error on the unsafe side.
To take into account the aforementioned effects, it could be useful to recast the previous results, discussed above in terms of a strain reduction, in the form of a correction that could be applied to the measured strain in order to obtain a correct estimation of the internal forces. Plotting the recip-rocal of the strain reduction ratio as a function of the size of the structural element (Figure 10) provides the corrective factor which, multiplied by the measured strain, gives the real free-field strain, which is proportional to the internal force that has to be evaluated.
For example, with the parameters of the steel bar used in the experiments ( ), the corrective factor was obtained from Figure 10. Let us con-sider, for instance, a measured strain , which was obtained under the maximum load during the cyclic tests (see Figure 9). The corresponding normal force in the bar would therefore be
where Young’s modulus, , and cross-sectional area, , were determined as described above. Thus, the true force in the bar can be evaluated as
which differs by about 1% from the exact value of the applied maximum force,
Latin American Journal of Solids and Structures 13 (2016) 536-553 Figure 10: Multiplicative correction factor c to calculate the free-field strain vs. the thickness t of the plate,
for different values of the width w.
5 SUMMARY AND CONCLUSIONS
The influence of the stiffness of a strain transducer on the very object of its measurement may be an effect that should not be disregarded in the interpretation of the experimental results, and it depends on the stiffness of the measuring device relative to the local stiffness of the piece at the measurement point. The perturbation of the strain field is an inherent feature of any measuring device based on glued, bolted or clamped gauges, where the instruments add a certain local stiffness to the underlying piece. However, in many cases, the magnitude of this perturbation is very small compared to the undisturbed value, and can safely be neglected.
This paper deals with a particular type of transducer, HBM SLB-700A, which, being based on the same principle adopted in load cells, contains a full Wheatstone bridge whose output signal is proportional to the deformation of the device and, consequently, to the deformation of the structure at the mounting point. The study was both theoretical and experimental.
From the theoretical viewpoint, the first approach was to treat the problem as an interaction of a finite-stiffness transducer with the surface of an isotropic linear elastic half-space. The problem, here regarded as the evaluation of the effect of opposite uniform distributions of tangential tractions, led to the development of a formula for the local stiffness of the half-space, which, compared to the stiffness of the transducer, gives an indication of the perturbation of the strain field due to the presence of the measuring device.
Latin American Journal of Solids and Structures 13 (2016) 536-553
realistic conditions therefore should involve a FEM numerical solution. In order to examine the influence of the size of the structural element on the strain perturbation, a reference problem was defined (i.e., a rectangular steel plate subjected to a given uniaxial free-field strain) and a number of analyses were carried out, varying the width and thickness of the plate over a typical structural steel profile element range. The results, presented in the paper, make it possible to infer the true free-field strain on the basis of the measurements obtained from the transducer, taking into account the real geometry.
The practical importance of the influence of the transducer stiffness on its readings, and the correctness of the proposed interpretive methodology have also been checked against the experimental determination of the strain in a laboratory test in which the deformation was measured independently with another transducer.
The main conclusions of this study can be summarized as follows:
Strain measurements obtained from transducers that require a force at their ends in order to be activated are perturbed by an amount that depends on the ratio between the stiff-ness of the transducer and the local stiffness of the underlying piece.
The lower perturbation bound is given by the half-space solution presented here and can be calculated according to the procedure shown above; the results are easily generalizable to instruments other than the HBM SLB-700A used in this study.
With reference to the HBM SLB-700A transducer, the perturbation of the free-field strain can be evaluated for different local geometries (i.e., attachment to the flange or the web of a steel profile) using the results of the FEM calculations presented here (see Figure 7). The evaluation of the internal force in structural elements, whose deformation is
deter-mined by the HBM SLB-700A transducer, or similar types, should consider the pertur-bation of the strain field. Disregarding this effect leads to an underestimation of the force, which in some cases, depending on the local geometry of the structural element, may be large. The results presented in graphical form in Figure 10 could be used for a first ap-proximation, without recurring to ad hoc simulations by means of numerical methods.
References
Ajovalasit, A. and Zuccarello, B. (2005). Local reinforcement effect of a strain gauge installation on low modulus materials. J. Strain Anal. Eng. Des. 40, 643-653.
Ajovalasit, A., D’Acquisto, L., Fragapane, S. and Zuccarello, B. (2007). Stiffness and reinforcement effect of electrical resistance strain gauges. Strain 43, 299–305.
Aleksandrov, V. M., Galadzhev, R. S. and Solov’ev, A. S. (1966). Calculation of errors in strain-gauge measurements. Meas. Tech. 9, 178– 81.
Barbero, M., Barpi, F., Borri-Brunetto, M., De Biagi, V., Olivero, G. and Pallara, O. (2014). Snow pressure on a semiflexible retaining structure. J. Cold Reg. Eng. 28, 04014002–1–19.
Barbero, M., Barpi, F., Borri-Brunetto, M., Pallara, O., Peila, D., Peila, L., Valfré, A. and Cornelini, P. (2013). Comportamento di una palificata prefabbricata per il contenimento delle terre: studi sperimentali. Geoingegneria Am-bientale e Mineraria L, 5–12.
Latin American Journal of Solids and Structures 13 (2016) 536-553 Campbell, W. R. and Medbery, A. F. (1947). Performance tests of wire strain gages, V - Error in indicated bending strains in thin sheet metal due to thickness and rigidity of gage. NACA Technical Note 1318 (Washington).
Dally, J. W. and Riley, W. F. (2005). Experimental stress analysis. 4th ed., College House (Knoxville).
Findley, W. and Reed, R. (1963). Concerning strain-gage measurement of creep of plastics. Exp. Mech. 3, 29–32. Giroud, J. P. (1969). Déplacement horizontal d’une droite particulière de la surface d’un massif élastique semi-infini linéairement chargé. C. R. Acad. Sci., Ser. A, 252–255.
HBM (2013). Data sheet SLB-700A/06-1, SLB700A/12-1 Strain transducer. Hottinger Baldwin Messtechnik GmbH (Darmstadt).
Little, E. (1992). Strain gauge measurement. In: A. Miles and K. Tanner (eds.), Strain Measurement in Biomechanics. Springer Netherlands, pp. 39–57.
Little, E. G., Tocher, D. and O’Donnell, P. (1990). Strain gauge reinforcement of plastics. Strain 26, 91–98. Pirulli, M., Barbero, M., Barpi, F., Borri-Brunetto, M. and Pallara, O. (2014a). The contribution of continuum-me-chanics based numerical models to the design of debris flow barriers. Latest Trends in Engineering Mecontinuum-me-chanics, Struc-tures, Engineering Geology. Ed. by G. Viccione and C. Guarnaccia. Vol. 26. Mathematics and Computers in Science and Engineering Series. WSEAS Press, pp. 13–21.
Pirulli, M., Barbero, M., Barpi, F., Borri-Brunetto, M., Pallara, O. and Segor, V. (2014b). Analisi dell’interazione tra colate detritiche e opere di difesa: il caso del torrente Grand Valey (Valle d’Aosta). La geotecnica nella difesa del territorio e delle infrastrutture dalle calamità naturali. Vol. 2. AGI (Rome), pp. 673–680.
Poulos, H. G. and Davis, E. H. (1974). Elastic solutions for soil and rock mechanics. Series in Soil Engineering. Wiley (New York).
Stehlin, P. (1972). Strain distribution in and around strain gauges. J. Strain Anal. Eng. Des. 7, 228-235. Swan, J. W. (1973). Resistance strain gauges on thermoplastics. Strain 9, 56–59.
TNO Diana (2010). Diana - Finite Element Analysis, User’s Manual, Element Library, Release 9.4.3. TNO Diana BV (Delft).
Zike, S. and Mikkelsen, L. P. (2014). Correction of gauge factor for strain gauges used in polymer composite testing. Exp. Mech. 54, 393–403.
Appendix A. The Half-Space Stiffness
The analytical solution to the problem of determining the surface displacement field, for the case of two oppositely acting rectangular distributions of uniform tangential tractions, has been obtained here by combining well-known solutions relative to a single loaded area (Giroud, 1969, Poulos and Davies, 1974).
The tangential displacement caused by a constant tangential traction applied to a linear-elastic isotropic
half-space on a rectangular region centred at the origin, with sides and parallel and perpendicular, respectively, to the axis (parallel to ), is given for the points on the axis (Giroud, 1969) by:
Latin American Journal of Solids and Structures 13 (2016) 536-553 By integration, we obtain:
In order to consider the combined effects of the two rectangular distributions of opposite tractions, the following function is defined:
(9)
where the abscissa refers to a new origin, at the midpoint of the segment of length , between the centres of the loaded rectangles (Figure 2).
The following non-dimensional quantities are defined:
so that the function becomes
(10)
Latin American Journal of Solids and Structures 13 (2016) 536-553 (11)
where , with .
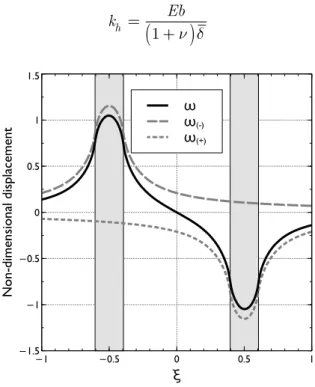
In Figure 11, the non-dimensional displacement is plotted for the particular choice of geometrical parameters
of the SLB-700A transducer ( ), together with the separate effects of the
oppo-site loadings (grey lines).
If the half-space stiffness kh is defined as the ratio between the resultant force and the corresponding relative
displacement , we obtain eq. (2):
Figure 11: Non-dimensional displacements along the axis for the SLB-700A transducer geometry. The shaded zones, centred at , represent the positions of the loaded rectangles. The two grey lines show