A canonical correlation analysis of the association between carcass
and ham traits in pigs used to produce dry-cured ham
Henrique T. Ventura
1, Paulo S. Lopes
1, José V. Peloso
1, Simone E.F. Guimarães
1,
Antonio Policarpo S. Carneiro
2and Paulo L.S. Carneiro
31
Departamento de Zootecnia, Universidade Federal de Viçosa, Viçosa, MG, Brazil.
2
Departamento de Estatística, Universidade Federal de Viçosa, Viçosa, MG, Brazil.
3
Departamento de Ciências Biológicas, Universidade Estadual do Sudoeste da Bahia, Jequié, BA, Brazil.
Abstract
The association between carcass and ham traits in a pig population used to produce dry-cured ham was studied us-ing canonical correlation analysis. The carcass traits examined were hot carcass weight (HCW), backfat thickness (BT) and loin depth (LD), and the ham traits studied were gross ham weight (GHW), trimmed ham weight (THW), ham inner layer fat thickness (HIFT), ham outer layer fat thickness (HOFT), pH (pH) and the Göfo value. Carcass and ham traits are not independent. The canonical correlations (r) between the carcass and ham traits at 130 kg were 0.77, 0.24 and 0.20 for the first, second and third canonical pair, respectively, and were all significant (p < 0.01) by the Wilks test. The corresponding canonical correlations between the three canonical variate pairs for the carcass and ham traits at 160 kg were 0.88, 0.42 and 0.14, respectively (p < 0.05 for all, except the third). The correlations be-tween the traits and their canonical variate showed an association among HCW, GHW and THW, and bebe-tween BT and HOFT. These results indicate that carcass traits should be used to cull pigs that are not suitable for dry-cured ham production.
Key words:canonical correlation, carcass, ham, pig.
Received: February 4, 2011; Accepted: April 28, 2011.
Introduction
Selecting pigs for dry-cured ham production requires various measurements on the ham in its rough state. Usual measurements include ham weight, trimmed ham weight, pH, meat color, intramuscular fat and the inner and outer layer fat thickness (Candek-Potokaret al., 2002; Pelosoet al., 2010). Several authors have reported an association be-tween ham traits and end product quality after the ham cur-ing process. Ham weight and fat thickness are related to losses in the curing process (Bosi and Russo, 2004). The in-ternal fat content influences the flavor (Woodet al., 1992) while the pH influences the dry-cured ham quality (Peloso
et al., 2010).
Measuring the ham traits involves procedures that re-quire specific equipment and trained personnel, in addition to a considerable amount of time to obtain the measure-ments, as can be appreciated in the methodologies reported by Candek-Potokaret al.(2002) and Pelosoet al.(2010). A potentially viable solution for eliminating the need to ob-tain these measurements in all individuals of a population of pigs intended for dry-cured ham production would be to
use the information from an easily measured group of car-cass traits that are correlated with the ham traits as this would allow prior culling of animals that did not meet the established standards.
Carcass typing measurements, such as hot carcass weight, backfat thickness and loin depth, can be obtained in pigs without great difficulty and are correlated with some of the measurements used in ham evaluation (Swatland, 1984; Beattie et al., 1999; Virgili et al., 2003; Doeschl-Wilsonet al., 2005, Pelosoet al., 2010). Hence, the rela-tionships among the carcass and ham traits could be useful in ascertaining the viability of using only the data from the first group of measurements when selecting the best indi-viduals for dry-cured ham production.
Canonical correlation (Weiss, 1972; Barbosaet al., 2005) is a technique that establishes the interrelation be-tween two sets of variables, in addition to quantifying the percentage of variance common to the two groups. Canoni-cal correlation analysis is a multivariate analysis technique in which the maximum correlation between two sets of variables is estimated by linear combinations of the original variables (canonical variates) (Cruzet al., 2004). The first group is generally considered to be established byptraits and the second byqtraits. The number of canonical
correla-www.sbg.org.br
Send correspondence to Paulo S. Lopes. Departamento de Zoo-tecnia, Universidade Federal de Viçosa, 36570-000 Viçosa, MG, Brazil. E-mail: [email protected].
tions is equal to the smallest number of traits that constitute one of the complexes (porq) and its magnitude decreases with the order in which these are estimated. However, in absolute value, the first coefficient of canonical correlation is always greater than or equal to any simple or multiple correlation coefficient among the traits of the first and sec-ond groups.
The objective of this study was therefore to use ca-nonical correlation analysis to examine the association among carcass and ham traits of a pig population intended for dry-cured ham production.
Material and Methods
The data used in this study were derived from five ge-netic groups of pigs produced on a farm in the state of Santa Catarina in southern Brazil. The following genetic groups were used: DUDU = Duroc, DULA = Duroc x Landrace, DUWI = Duroc x Large White, DULL = Duroc x (Landrace x Large White) and WIWI = Large White.
After weaning at 28 days of age, the piglets were transferred weekly in batches of 20 to the nursery and growing barns and separated based on their genetic group into pens of mixed gender. The animals remained in these facilities until they reached 83 days of age and a mean weight of 48.3 kg. They were then transferred to the finish-ing barns and kept in groups of 5-8 animals per stall accord-ing to their genetic group and gender. Throughout the experiment the pigs received a corn and soybean meal-based dietad libitum(Pelosoet al., 2010). The pigs were harvested in two periods (at 130 kg and 160 kg live weight). The animals in the Duroc (DUDU) genetic group were tested only at 130 kg harvest weight (HW) since ani-mals with 160 kg HW are inappropriate for industrial use because of their low feeding efficiency at this later stage, excess carcass fat, and the occurrence of deep-seated hair on the hams.
The pigs were harvested using the routine standard operational procedures of the plant, according to the techni-cal standards of the Federal Inspection Service (SIF) of the Brazilian Ministry of Agriculture, Livestock and Food Sup-ply. The carcass traits used included hot carcass weight (HCW), backfat thickness (BT) and loin depth (LD) and the ham traits were gross ham weight (GHW), trimmed ham weight (THW), ham inner layer fat thickness (HIFT), ham outer layer fat thickness (HOFT), pH at 24 h post-mortem (pH) and the ham color by objective surface light reflec-tance of the semimembranosus muscle at 24 h after harvest (Göfo value, ranging from 0 = pale to 100 = dark). Details of the measurements of these traits are described by Peloso
et al.(2010).
The analyses were done separately for each harvest weight group (130 kg and 160 kg) and pigs without the measure in all of the traits assessed within the group were excluded. Table 1 shows the number of individuals ana-lyzed in each harvest weight, together with the means and
coefficients of variation for carcass and ham traits. Prior to analysis, the data was adjusted for the fixed effects of gen-der and genetic group by the least squares method. The variables were then standardized to allow expression in dif-ferent scales, as described by Cruzet al.(2004).
The number of conditions (NC) test described by Montgomery and Peck (1992) was used to detect the effect of multicolinearaity or linear correlation among the vari-ables that could lead to the formation of singular or ill-conditioned matrices. Since the NC for all the data groups was less than 100 no variable was discarded. Canonical cor-relation analysis was used to evaluate the cor-relationships be-tween the groups of carcass and ham traits by the CANCORR procedure of the SAS program for Windows version 9.1, based on the phenotypic correlation matrix among the nine traits used in this study. The canonical cor-relation coefficients and the corcor-relation between the origi-nal variables and related canonical variate were estimated. The Wilks statistic was used to test the significance of the canonical correlation, as described by Barbosa et al.
(2005).
Results and Discussion
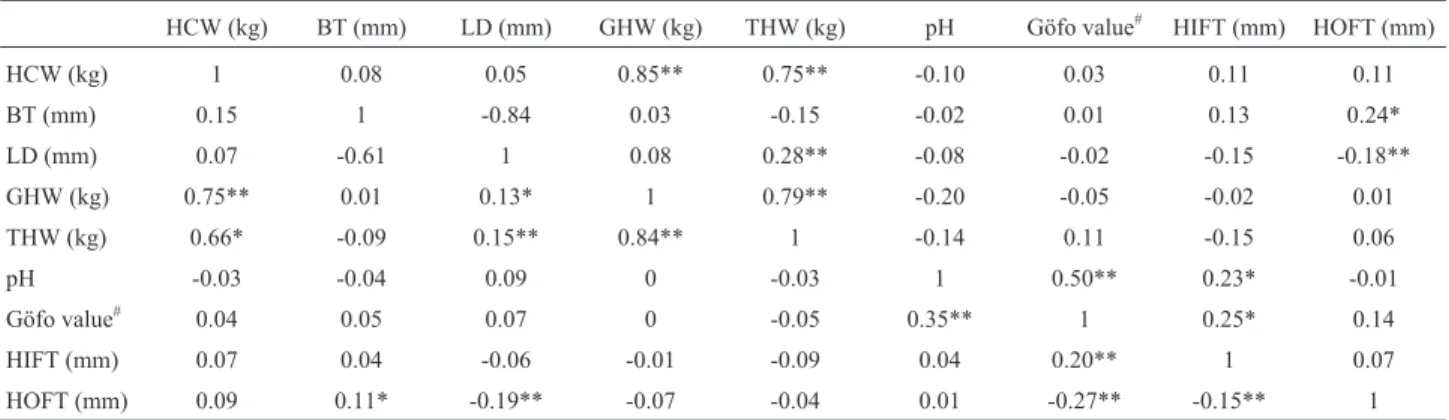
Table 2 shows that there was a high positive correla-tion among hot carcass weight (HCW), gross ham weight (GHW) and trimmed ham weight (THW), and simple cor-relation between backfat thickness (BT) and ham outer layer fat thickness (HOFT), as well as positive correlation between loin depth (LD) and trimmed ham weight (TH) for harvest at 130 kg and 160 kg (Table 2). These correlations revealed an association among the carcass and ham traits.
The canonical correlation (r) between the sets of car-cass and ham traits for harvest at 130 kg was 0.77, 0.24 and 0.20 for the first, second and third canonical variate pairs, respectively, and all were significant (p < 0.01) by the
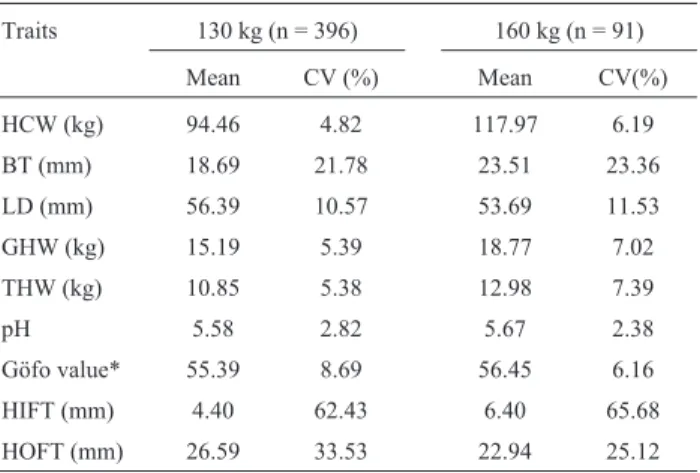
Table 1- Mean values and coefficients of variation for various production traits at two harvest weights in pigs.
Traits 130 kg (n = 396) 160 kg (n = 91)
Mean CV (%) Mean CV(%)
HCW (kg) 94.46 4.82 117.97 6.19
BT (mm) 18.69 21.78 23.51 23.36
LD (mm) 56.39 10.57 53.69 11.53
GHW (kg) 15.19 5.39 18.77 7.02
THW (kg) 10.85 5.38 12.98 7.39
pH 5.58 2.82 5.67 2.38
Göfo value* 55.39 8.69 56.45 6.16
HIFT (mm) 4.40 62.43 6.40 65.68
HOFT (mm) 26.59 33.53 22.94 25.12
Wilks test (Table 3). The canonical correlation (r) between the sets of carcass and ham traits for harvest at 160 kg for the three canonical variate pairs was 0.88, 0.42 and 0.14, re-spectively (Table 4); the last of these, corresponding to the third canonical variate pair, was the only one that was not significant by the Wilks test.
When the simple correlation coefficients (Table 2) were compared with the canonical correlation values (Ta-bles 3 and 4) the latter values for the first canonical variate pairs, for harvest at 130 kg (Table 3) and at 160 kg (Ta-ble 4), were greater than any simple correlation coefficient
among the carcass and ham traits within the corresponding harvest weight (130 kg or 160 kg) (Table 2). These results were expected since according to Cruzet al.(2004) the ab-solute value of the canonical correlation coefficient for the first canonical variate pairs is always greater than or equal to any simple or multiple correlation coefficient among the traits of the first and second groups.
The squared canonical correlation coefficients (r2) (Tables 3 and 4) that indicated the proportion of variance common to the two groups of traits were 0.60, 0.06 and 0.04 for the first, second and third canonical variate pairs,
re-Table 2- Simple correlation coefficients (r) among the carcass and ham traits for harvest at 130 kg (below the diagonal) and 160 kg (above the diagonal).
HCW (kg) BT (mm) LD (mm) GHW (kg) THW (kg) pH Göfo value# HIFT (mm) HOFT (mm)
HCW (kg) 1 0.08 0.05 0.85** 0.75** -0.10 0.03 0.11 0.11
BT (mm) 0.15 1 -0.84 0.03 -0.15 -0.02 0.01 0.13 0.24*
LD (mm) 0.07 -0.61 1 0.08 0.28** -0.08 -0.02 -0.15 -0.18**
GHW (kg) 0.75** 0.01 0.13* 1 0.79** -0.20 -0.05 -0.02 0.01
THW (kg) 0.66* -0.09 0.15** 0.84** 1 -0.14 0.11 -0.15 0.06
pH -0.03 -0.04 0.09 0 -0.03 1 0.50** 0.23* -0.01
Göfo value# 0.04 0.05 0.07 0 -0.05 0.35** 1 0.25* 0.14
HIFT (mm) 0.07 0.04 -0.06 -0.01 -0.09 0.04 0.20** 1 0.07
HOFT (mm) 0.09 0.11* -0.19** -0.07 -0.04 0.01 -0.27** -0.15** 1
BT - backfat thickness, GHW - gross ham weight, LD - loin depth, HCW - hot carcass weight, HIFT - ham inner layer fat thickness, HOFT - ham outer layer fat thickness, pH - pH 24 h post-mortem, THW - trimmed ham weight.#Range from 0 (pale) to 100 (dark). *p < 0.05 and **p < 0.01 (Student’s
t-test).
Table 3- Standardized canonical coefficients of variates, canonical corre-lation (r) between two sets of traits, significance test (F) for the canonical correlation and squared canonical correlation (r2) between carcass and ham traits for harvest at 130 kg, for the three canonical variate pairs.
Standardized canonical coefficients
Traits 1° 2° 3°
Carcass
HCW (kg) 1.008 0.096 -0.200
BT (mm) -0.158 0.646 1.110
LD (mm) 0.018 -0.454 1.199
Ham
GHW (kg) 0.790 1.074 0.959
THW (kg) 0.228 -1.116 -1.109
pH -0.037 -0.410 0.209
Göfo value# 0.038 0.254 0.506
HIFT (mm) 0.096 0.230 -0.443
HOFT (mm) -0.060 0.734 -0.352
r 0.77 0.24 0.20
F 26.29** 4.07** 3.99**
r2 0.60 0.06 0.04
BT backfat thickness, GHW gross ham weight, LD loin depth, HCW -hot carcass weight, HIFT - ham inner layer fat thickness, HOFT - ham outer layer fat thickness, pH - pH 24 h post-mortem, THW - trimmed ham weight.#Range from 0 (pale) to 100 (dark). **p < 0.01 (F test).
Table 4- Standardized canonical coefficients of variates, canonical corre-lation (r) between two sets of traits, significance test (F) for the canonical correlation and squared canonical correlation (r2) between carcass and ham traits for harvest at 160 kg, for the three canonical variate pairs.
Standardized canonical coefficients
Traits 1° 2° 3°
Carcass
HCW (kg) 0.9938 0.0996 -0.2482
BT (mm) 0.0018 0.1730 1.9127
LD (mm) 0.0691 -0.8478 1.7186
Ham
GHW (kg) 0.7259 1.1664 -0.6215
THW (kg) 0.3237 -1.380 0.5289
pH 0.0703 0.1405 -0.5301
Göfo value#
-0.0621 0.0784 -0.1115
HIFT (mm) 0.1626 0.0882 -0.0295
HOFT (mm) 0.0927 0.5456 0.7351
r 0.88 0.42 0.14
F 11.04** 1.94* 0.44ns
r2 0.78 0.18 0.02
spectively, for the 130 kg HW (Table 3) and 0.78, 0.18 and 0.02 (Table 4) for the 160 kg HW. These results indicate that the carcass and ham traits were not independent and that there were intergroup relationships.
The standardized canonical coefficients (canonical weights) indicate how much each variable contributed to the corresponding canonical variate (Akbas and Takma, 2005). In the first canonical variate pair, absolute predomi-nance was observed for HCW in the carcass traits, and for GHW and THW in the ham traits, for harvest at 130 kg (Ta-ble 3) and 160 kg (Ta(Ta-ble 4). The second canonical variate pair had greater standardized canonical coefficients for BT and LD in the carcass traits, and GHW and THW had a greater influence in the ham traits, for harvest at 130 kg (Table 3) and 160 kg (Table 4).
In the third canonical variate pair, BT and LD yielded the greatest coefficients for the carcass traits whereas GHW and THW predominated among the ham traits for harvest at 130 kg (Table 3). Although the standardized canonical co-efficients indicate participation of the original variables in their respective canonical variate, they cannot be used to conclude accurately on this relationship because the stan-dardized canonical coefficients are influenced by the gen-eral structure of the data (Akbas and Takma, 2005). According to Cruzet al.(2004), interpretation of the corre-lation between the original variable and the related canoni-cal variate (Tables 5 and 6) is a better alternative for identifying the nature of the relationships represented by the canonical correlation coefficient.
For the first canonical variate pair, the HCW showed greater correlation with its respective canonical variate and values close to unity among carcass traits for harvest at 130 kg (Table 5) and 160 kg (Table 6). In the ham traits, the greatest correlation for the first canonical variate pair with
the corresponding canonical variate was observed for GHW and THW at both 130 kg (Table 5) and 160 kg (Table 6). These findings indicated that HCW, GHW and THW were positively correlated.
Considering the second canonical variate pair, the carcass traits that correlated best with their respective ca-nonical variate were BT and LD; the latter had negative val-ues for the carcass traits for harvest at 130 kg (Table 5) and 160 kg (Table 6). For ham traits, the best correlation with the corresponding canonical variate was for HOFT at har-vest of 130 kg (Table 5) and 160 kg (Table 6). These results indicated that BT and LD correlated positively and nega-tively, respecnega-tively, with HOFT.
The carcass traits BT and LD also showed the greatest correlation with their respective canonical variate in the third canonical pair, whereas the ham trait light reflectance (color) of the semimembranosus muscle (Göfo value) showed the greatest correlation with its respective canoni-cal variate in the third canonicanoni-cal pair (Table 5). Both BT and LD were correlated with the Göfo value. The correla-tion between the carcass and ham traits and their respective canonical variate in the third canonical pair was significant only for harvest at 130 kg; no significant canonical correla-tions were observed for harvest at 160 kg.
Together, the results of this study indicate that hot carcass weight (HCW), backfat thickness (BT) and loin depth (LD) are associated with the traits gross ham weight (GHW), trimmed ham weight (THW) and ham outer layer fat thickness (HOFT). These ham traits directly influence the quality and efficiency of the dry-cured ham production process and are therefore determinants of successful dry-cured ham production. Some authors have reported that backfat thickness and ham weight are negatively correlated with losses during the maturation process (Candek-Potokar
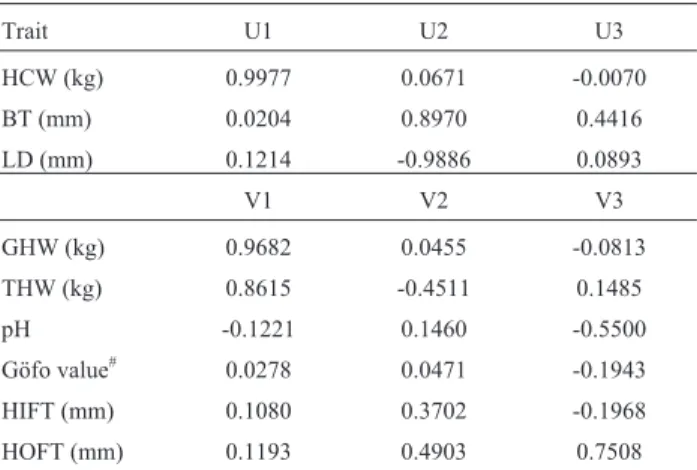
Table 6- Correlation between the carcass traits and their respective ca-nonical variates (U) and between the ham traits and their respective canon-ical variates (V) for harvest at 160 kg, for the three canoncanon-ical variate pairs.
Trait U1 U2 U3
HCW (kg) 0.9977 0.0671 -0.0070
BT (mm) 0.0204 0.8970 0.4416
LD (mm) 0.1214 -0.9886 0.0893
V1 V2 V3
GHW (kg) 0.9682 0.0455 -0.0813
THW (kg) 0.8615 -0.4511 0.1485
pH -0.1221 0.1460 -0.5500
Göfo value# 0.0278 0.0471 -0.1943
HIFT (mm) 0.1080 0.3702 -0.1968
HOFT (mm) 0.1193 0.4903 0.7508
BT backfat thickness, GHW gross ham weight, LD loin depth, HCW -hot carcass weight, HIFT - ham inner layer fat thickness, HOFT - ham outer layer fat thickness, pH - pH 24 h post-mortem, THW - trimmed ham weight.#Range from 0 (pale) to 100 (dark).
Table 5- Correlation between the carcass traits and their respective ca-nonical variates (U) and between the ham traits and their respective canon-ical variates (V) for harvest at 130 kg, for the three canoncanon-ical variate pairs.
Trait U1 U2 U3
HCW (kg) 0.9858 0.1613 0.0465
BT (mm) -0.0189 0.9349 0.3545
LD (mm) 0.1819 -0.8384 0.5138
V1 V2 V3
GHW (kg) 0.9851 0.0795 0.0562
THW (kg) 0.8864 -0.2666 -0.2730
pH -0.0260 -0.2795 0.3931
Göfo value# 0.0497 0.0136 0.6377
HIFT (mm) 0.0783 0.2445 -0.1914
HOFT (mm) -0.1501 0.6030 -0.4382
et al., 2002; Bosi and Russo, 2004). According to Bosi and Russo (2004), low fat proportions in the carcass and ham are associated with undesirable sensory traits in dry-cured ham.
Our findings indicate that the carcass traits consid-ered here could be used as criteria for prior culling of pigs that do not meet the established standards, thereby elimi-nating the need to obtain ham measurements in all of the pig population intended for dry-cured ham production. How-ever, it should be remembered that correlations estimated only from the phenotypic correlations do not necessarily re-flect the genetic nature of this link. Phenotypic correlations result from genetic and environmental causes. The extent of such correlations depends on genetic and environmental correlations, especially the heritability of each trait, which determines the importance of the genetic and environmen-tal causes that affect the phenotypic correlation. If both traits have low heritabilities, then the phenotypic correla-tion is determined mainly by the environmental correlacorrela-tion, but if they have high heritabilities, then genetic correlation is more important (Falconer and Mackay, 1996; Lopes, 2005). Consequently, inferences based only on results ob-tained from phenotypic correlations, as in the present study, should be considered with caution and applied only to this population.
To conclude, the carcass and ham traits studied here were not independent since there was an association be-tween hot carcass weight (HCW), gross ham weight (GHW) and trimmed ham weight (THW), and between backfat thickness (BT) and ham outer layer fat thickness (HOFT). The carcass traits HCW, BT and LD can be used for early culling of pigs that do not meet the standards es-tablished for dry-cured ham production, thereby eliminat-ing the need to obtain ham measurements from all of the animals. This prior culling would save time and labor dur-ing dry-cured ham production.
Acknowledgments
This work was supported by Conselho Nacional de Desenvolvimento Científico e Tecnológico (CNPq) and Fundação de Amparo à Pesquisa do Estado de Minas Gerais (FAPEMIG).
References
Akbas Y and Takma Ç (2005) Canonical correlation analysis for studying the relationship between egg production traits and
body weight, egg weight and age at sexual maturity in lay-ers. Czech J Anim Sci 50:163-168.
Barbosa L, Lopes PS, Regazzi AJ, Guimarães SEF and Torres RA (2005) Estudo da associação entre características de desem-penho e de carcaça de suínos por meio de correlação canô-nica. Rev Bras Zootec 34:2218-2224 (Abstract in English). Beattie VE, Weatherup RN, Moss BW and Walker N (1999) The
effect of increasing carcass weight of finishing boars and gilts on joint composition and meat quality. Meat Sci 52:205-211.
Bosi P and Russo V (2004) The production of the heavy pig for high quality processed products. Ital J Anim Sci 3:309-321. Candek-Potokar M, Monin G and Zlender B (2002) Pork quality,
processing, and sensory characteristics of dry-cured hams as influenced by Duroc crossing and sex. J Anim Sci 80:988-996.
Cruz CD, Regazzi AJ and Carneiro PCS (2004) Modelos Bio-métricos Aplicados ao Melhoramento Genético. 3rd edition. Universidade Federal de Viçosa, Viçosa, 480 pp.
Doeschl-Wilson AB, Green DM, Fisher AV, Carroll SM, Schofield CP and Whittemore CT (2005) The relationship between body dimensions of living pigs and their carcass composition. Meat Sci 70:229-240.
Falconer DS and Mackay TFC (1996) Introduction to Quantita-tive Genetics. 4th edition. Longman, Harlow, 464 pp. Lopes PS (2005) Teoria do Melhoramento Animal. FEPMVZ,
Belo Horizonte, 118 pp.
Montgomery DC and Peck EA (1992) Introduction to Linear Re-gression Analysis. 2nd edition. John Wiley Sons, New York, 527 pp.
Peloso JV, Lopes PS, Gomide LAM, Guimarães SEF and Car-neiro PLS (2010) Carcass and ham quality characteristics of heavy pigs from different genetic groups intended for the production of dry-cured hams. Meat Sci 86:371-376. Swatland HJ (1984) Structure and Development of Meat Animals.
Prentice-Hall, Englewood Cliffs, 436 pp.
Virgili R, Degni M, Schivazappa C, Faet V, Poletti E, Marchetto G, Pacchioli MT and Mordenti A (2003) Effect of age at slaughter on carcass traits and meat quality of Italian heavy pigs. J Anim Sci 81:2448-2456.
Weiss DJ (1972) Canonical correlation analysis in counselling psychology research. J Couns Psychol 19:241-252. Wood JD, Warriss PD and Enser MB (1992) Effects of production
factors on meat quality in pigs. In: Johnston DE, Knight MK and Ledward DA (eds) The Chemistry of Muscle-Based Foods. Royal Society of Chemistry, Cambridge, pp 3-15.
Associate Editor: Bertram Brenig