Relationship between the Porcine Stress Syndrome gene and carcass and
performance traits in F
2pigs resulting from divergent crosses
Guilherme de Oliveira Band
1, Simone Eliza Facioni Guimarães
1, Paulo Sávio Lopes
1, Jane de Oliveira
Peixoto
1, Danielle Assis Faria
1, Aldrin Vieira Pires
1, Frederico de Castro Figueiredo
1, Carlos Souza do
Nascimento
1and Lúcio Alberto de Miranda Gomide
21
Universidade Federal de Viçosa, Departamento de Zootecnia, Viçosa, MG, Brazil.
2
Universidade Federal de Viçosa, Departamento de Tecnologia de Alimentos, Viçosa, MG, Brazil.
Abstract
ThePSS genotypes of 596 F2pigs produced by initial mating of Brazilian native boars commercial sows and were
characterized by PCR-RFLP and their carcass and performance traits were evaluated. Among the 596 animals analyzed, 493 (82.72%) were characterized asNN and 103 (17.28%) as Nn. With respect to carcass traits, Nn animals presented higher (p < 0.05) right half carcass weight, left half carcass weight, loin depth and loin eye area, and lower shoulder backfat thickness, backfat thickness between last and next to last but one lumbar vertebrae and backfat thickness after last rib at 6.5 cm from the midline compared toNN animals. Nn animals also showed (p < 0.05) higher values for most of the cut yields, indicating higher cutting yields for animals carrying then allele and lower values for bacon depth, confirming lower fat deposition in carcass. In addition,Nn animals presented (p < 0.05) lower values for the performance trait weight at 105 days of age. These results indicate that animals carrying the PSS gene generate leaner carcasses, higher cut yields, and that the effects of the gene can be observed even in divergent crosses.
Key words:carcass, performance,PSSgene, PCR-RFLP, pig.
Received: December 5, 2003; Accepted: September 28, 2004.
Introduction
Since the identification of Porcine Stress Syndrome (PSS), several studies have been carried out comparing per-formance and carcass traits betweenPSSgenotypes. Most of these studies used the halothane challenge test to sepa-rate reactor (nn) and non-reactor (NN and Nn) animals (Leachet al., 1996). The more thorough identification of the threePSS genotypes by molecular techniques has re-vived interest in their effects on carcass traits (Fisheret al., 2000c).
ThePSSgene, also called halothane gene (Halgene), encodes the precursor protein of the calcium release chan-nel of skeletal muscle sarcoplasmic reticulum (Fujiiet al., 1991). TheHalgene, in recessive homozygosis (nn), is as-sociated with the development of PSS, and is related to mortality during transportation as well as occurrence of pale, soft and exudative (PSE) meat. When in heterozygosis (Nn), theHalgene continues to be related to poor meat quality, but recessive homozygous (nn)animals
gain more weight when compared to normal homozygous (NN) ones (Bastoset al., 2001; Santanaet al., 1998).
Zhang et al. (1992), studying Pietran x Yorkshire crossed animals, attributed 1 to 10% of the phenotypic vari-ation in meat yield and growth traits to thePSSgene locus. Other studies have indicated thatNnanimals presented ad-vantages in traits such as feed efficiency, carcass yield and lean meat content compared to dominant homozygous ani-mals (NN); however, they showed a higher incidence of PSE meat (Leachet al., 1996; Fisheret al., 2000c), a source of economic loss in the swine industry.
The objective of the present study was to evaluate carcass and performance traits and to determine their rela-tionship with thePSSgene in a F2population resulting from divergent crosses.
Material and Methods
The 596 genotyped F2 animals were produced by outbreed crossing of 18 commercial females, including 11 Landrace x Large White and 7 (Landrace x Large White x Pietrain) with two Brazilian native boars (Piau breed). Both boars and 11 parental females had theNNgenotype. The F2
www.sbg.org.br
Send correspondence to Simone E.F. Guimarães. Universidade Federal de Viçosa, Departamento de Zootecnia, Viçosa, MG, Brazil. E-mail: sfacioni@ufv.br.
animals were reared and slaughtered at a live weight of 65.03±5.51 kg at the Pig Breeding Farm, Department of Animal Science, Federal University of Viçosa, Viçosa, Minas Gerais State, Brazil.
Animals were deprived of food for 18 h before slaughter, with ad libidum access to fresh water. After-wards they were electrically stunned (300V/5s) and bled by heart puncture under the animal’s left armpit.
At slaughter the following carcass traits were evalu-ated: slaughter age (SA), right half carcass weight (RHCW), left half carcass weight (LHCW), carcass yield including feet and head (CY), carcass length according to the American carcass classification method (MLC), shoul-der backfat thickness (SBT), midline backfat thickness af-ter last rib (LR), midline backfat thickness between last and next to last but one lumbar vertebrae (LL), midline lower backfat thickness above the last lumbar vertebra (L), backfat thickness after last rib, 6.5 cm from the midline (P2), backfat thickness after last rib, 6.5 cm from the midline, equivalent to P2 (ETO), loin depth (LD), and loin eye area (LEA).
The following cut yields were also evaluated after 24 h of cooling at 4 °C: cold right half carcass weight (CRHCW), total ham weight (THW), skinless and fatless ham weight (HW), total shoulder weight (BSW), skinless and fatless shoulder weight (SFBSW), total picnic shoulder weight (PSW), skinless and fatless picnic shoulder weight (SFPSW), total loin (bone-in) weight (TLW), boneless loin weight (LW), bacon weight (BCW), bacon depth (BCD) and sirloin weight (SW). Evaluated performance traits were: birth weight (BW), live weights at 21 (W21), 77 (W77) and 105 (W105) days of age. Feed intake (FI), aver-age daily gain (ADG), and feed:gain ratio (FG) were mea-sured from 77 to 105 days of age.
Carcass traits and cut yields were determined by the carcass dissection technique described by Nascimento and Mota (2000) and Benevenuto Júnior (2001)
Genotypic analys were performed at the Laboratory of Animal Biotechnology, Department of Animal Science, Federal University of Viçosa.
DNA was salt extracted from white blood cells col-lected immediately after slaughter. Briefly, leukocytes were obtained from 10 mL blood collected in 0.5 mL 0.5% EDTA and centrifuged for 15 min at 958.69 g. The plasma was discarded and each pellet was stored in 1 mL NET 100 (100 mM NaCl, 10 mM Tris, pH 8.3, 100 mM EDTA, pH 8.0) at -20 °C for an indeterminate period of time. On the day of extraction, the samples were thawed at room temper-ature (about 25 °C). The cells were then washed twice in 1X PBS (3.825 g NaCl, 0.469 g NaH2PO4.H2O, 500 mL MilliQ water) and each microtube was filled with 2 mL hemolysis solution (10 mM Tris, pH 7.5, 5 mM MgCl2, 10 mM NaCl). The cells were then homogenized by vortexing, centrifuged at 958.69 g for 10 min in a refrigerated centrifuge at 4 °C and the supernatant was discarded. This step was repeated
until a white pellet was obtained. The samples were then transferred to new labeled microtubes and the pellets were incubated at 55 °C with 200µL proteinase K buffer (5X) (0.375 M NaCl, 0.12 M EDTA, pH 8.0), 20µL proteinase (20 mg/mL), 26µL 20% SDS (20 g SDS, 100 mL MilliQ water) and 744 µL distilled water, in a final volume of 1 mL, for 4-6 h or overnight. For DNA salt precipitation, each sample was divided into two additional microtubes, 110µL 5 M NaCl was added, and each sample was homog-enized manually for 15 s and then centrifuged at 15,338 g for 5 min at room temperature. The supernatant (DNA solu-tion) was then transferred to a new microtube and 1 mL of absolute ethanol was added to each sample. The samples were resuspended and then centrifuged for 5 min at 15,338 g. The supernatant was discarded and the pellet was dried for 15 to 20 min. at room temperature. After drying, the pellet was resuspended in 100 to 200µL TR (20 mM Tris, pH 8.3, 0.1 mM EDTA, pH 8.0) and incubated in a wa-ter bath at 37 °C for 30 min. Finally, the samples were stored at 4 °C for an indeterminate period of time.
The sequence of the ryr-1 gene that contains the C→T mutation responsible for triggering PSS (Fujiiet al., 1991) was amplified by PCR-RFLP using the primers cited by O’Brien et al. (1993), which generated a product of 659 bp.
The amplification mixture contained 1 U of Taq DNA polymerase (Phoneutria), 0.2µM of each primer (forward -5’-TCCAGTTTGCCACAGGTCCTACCA-3’ - and re-verse - 5’-TTCACCGGAGTGGAGTCTCTGAG-T-3’), 2 mM MgCl2, 20 mM Tris, pH 8.3, 50 mM KCl, 0.2 mM dNTPs, and 25 ng genomic DNA in distinct tubes for each animal, in a final volume of 20µL, following the standard protocol described by Fujiiet al.(1991).
Samples were distributed into microtubes, each la-beled with the number of the animal to be analyzed. These microtubes, containing the reagent mixture described above, were centrifuged at 7,826 g for 10 s to guarantee that the samples were at the bottom of each microtube. The microtubes were then added to a 96-sample tray of a MJ-Research PTC-100 thermocycler. The amplification pro-gram, modified from Fujiiet al.(1991) and Houdeet al. (1993), consisted of initial denaturation at 94 °C for 3 min and 35 cycles at 94 °C/45 s, 68 °C/1 min and 72 °C/1 min, and a final polymerization step at 72 °C for 5 min.
(NN), heterozygotes (Nn) and recessive homozygotes (nn) according to the size of the DNA fragments.
Statistical analysis of the association of the genotypes with the traits evaluated was performed using the SAS Gen-eral Linear Models (SAS, 1997) program, according to the following model:
Yijklm=m+Gi+Sj+Lk+b(Cijklm-C)+eijklm
whereYijkl= observed trait in l animal, ofigenotype,jsex
andkbatch;m= general mean;Gi=genotype effect (NNor
Nn);Sj= sex effect (1 = castrated male and 2 = female);
Lk= batch effect (k = 1, 2, 3, 4 and 5);b=linear regression
coefficient of trait as a function of the covariate;Cijkl=
ob-served covariate value in l animal, ofigenotype,jsex,k batch, andeijkl= random error.
For carcass traits and cut yields, carcass weight and cold right half carcass weight (CRHCW) were used as covariates, respectively. For traits FI, W105, ADG, and FG, W77 was used as covariate.
Results
The RFLP patterns observed were as expected. Ani-mals homozygous for the mutation (nn) were characterized by bands of 358, 166 and 135 bp. Normal animals (NN) showed the 524-bp band and the complementary 135-bp band. Heterozygous animals showed bands of 524 and 358 bp and smaller bands of 166 and 1 35 bp.
The frequencies of theNN andNngenotypes were 493 (82.72%) and 103 (17.28%) animals, respectively. Since only onennanimal was identified, it was not consid-ered for analysis. These unusual frequencies in F2crosses were found due to divergent mating patterns, in which pa-rental boars were not carriers and the F1generation was ran-domly mated despite theirPSSgenotype.
Average results for carcass traits and number of ob-servations within each genotype are shown in Table 1. Traits showing significant differences betweenNNandNn genotypes were RHCW, LHCW, SBT, LL, P2, LD and LEA. Higher (p < 0.05) RHCW, LHCW, LD and LEA and lower (p < 0,05) SBT, LL and P2 were observed forNn ani-mals, indicating a higher lean content and lower fat deposi-tion.
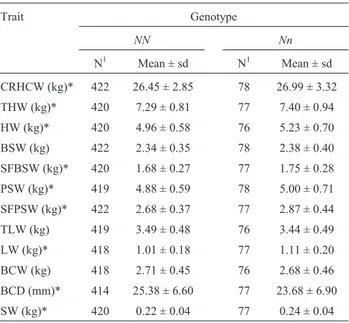
Average results and the number of observations for cut yields within each genotype are shown in Table 2. Sig-nificant differences betweenNNandNnanimals were ob-served for CRHCW, THW, HW, SFBSW, PSW, SFPSW, LW and SW.Nnanimals showed higher (p < 0.05) values for all these cut yields compared toNNanimals, confirming the carcass trait results, indicating a higher lean mean con-tent inNnanimals. For BCDNnanimals presented a signif-icantly (p < 0.05) lower value, confirming their lean carcass trait.
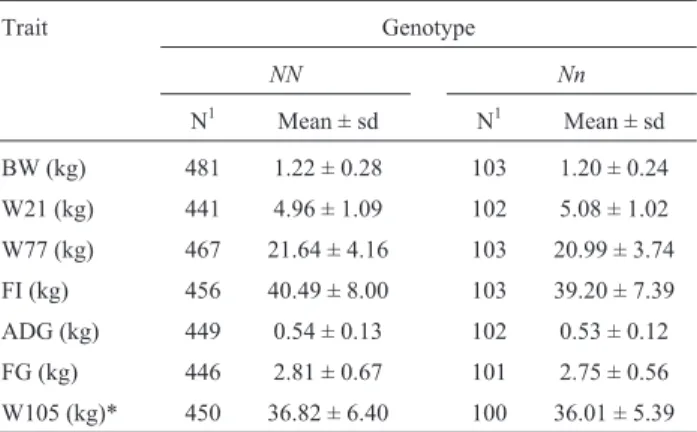
Average results and the number of observations for each performance trait within each genotype are shown in Table 3. Among the performance traits evaluated, only
Table 1- Carcass traits (means and standard deviations) obtained for each
PSSgenotype (NNandNn).
Trait Genotype
NN Nn
N1 Mean ± sd N1 Mean ± sd
RHCW (kg) * 420 26.85 ± 2.63 78 27.30 ± 4.04
LHCW (kg)* 422 26.74 ± 2,59 78 27.21 ± 2.89
SA (days) 416 147.51 ± 10.02 77 149.83 ± 10.37
CY (%) 408 82.09 ± 1.99 75 81.94 ± 2.28
MLC (cm) 416 71.71 ± 3.08 77 71.87 ± 3.80
SBT (mm)* 420 40.86 ± 5.41 78 39.08 ± 5.69
LR (mm) 422 20.00 ± 4.82 78 19.72 ± 4.71
LL (mm)* 422 28.92 ± 5.89 78 27.30 ± 6.14
L (mm) 373 44.95 ± 2.05 70 44.98 ± 1.92
P2 (mm)* 420 17.24 ± 3.74 78 15.51 ± 3.66
LD (mm)* 368 43.43 ± 4.23 66 45.48 ± 4.16
LEA (cm2)* 374 26.09 ± 3.74 66 28.14 ± 3.39
*Significant differences (p < 0.05) between genotypes by the F-test. RHCW right half carcass weight; LHCW left half carcass weight; SA -slaughter age; CY - carcass yield including feet and head; MLC - carcass length determined according to the American carcass classification method; SBT - shoulder backfat thickness; LR - backfat thickness after last rib, at midline; LL - backfat thickness between last and next to last but one lumbar vertebra, at midline; L - lower backfat thickness after last lum-bar vertebra, at midline; P2 - backfat thickness after last rib at 6.5 cm from the midline; LD - loin depth; LEA - loin eye area.
Table 2- Cut yields (means and standard deviations) obtained for each
PSSgenotype (NNandNn).
Trait Genotype
NN Nn
N1 Mean ± sd N1 Mean ± sd
CRHCW (kg)* 422 26.45 ± 2.85 78 26.99 ± 3.32
THW (kg)* 420 7.29 ± 0.81 77 7.40 ± 0.94
HW (kg)* 420 4.96 ± 0.58 76 5.23 ± 0.70
BSW (kg) 422 2.34 ± 0.35 78 2.38 ± 0.40
SFBSW (kg)* 420 1.68 ± 0.27 77 1.75 ± 0.28
PSW (kg)* 419 4.88 ± 0.59 78 5.00 ± 0.71
SFPSW (kg)* 422 2.68 ± 0.37 77 2.87 ± 0.44
TLW (kg) 419 3.49 ± 0.48 76 3.44 ± 0.49
LW (kg)* 418 1.01 ± 0.18 77 1.11 ± 0.20
BCW (kg) 418 2.71 ± 0.45 76 2.68 ± 0.46
BCD (mm)* 414 25.38 ± 6.60 77 23.68 ± 6.90
SW (kg)* 420 0.22 ± 0.04 77 0.24 ± 0.04
weight at 105 days of age was significantly different (p < 0.05) betweenNNandNngenotypes, with higher val-ues being observed forNNanimals.
Discussion
In contrast to some authors (Eggert et al., 1996; McPhee and Trout, 1995),Nnanimals showed better car-cass traits compared toNNanimals, with higher (p < 0.05) RHCW, LHCW, LD and LEA and lower (p < 0.05) SBT, LL and P2 values, thus confirming the effect of thePSS gene in terms of higher lean meat content and lower fat de-position (Fisheret al., 2000a, 2000b; Leach et al., 1996; Lundstromet al., 1995.). However, Bastoset al.(2001) did not find significant differences in hot carcass weight, backfat thickness, loin depth or lean meat content among the three genotypes (NN,Nnandnn) when studying ani-mals of the Large White, Landrace, Duroc and Pietrain breeds. The results of the present study differ from those described by those authors in terms of hot carcass weight and loin depth, which were higher inNnthan inNNanimals (p < 0.05).
Hamilton et al. (2000), Fisher et al. (2000a), Lundstrom et al. (1995) and McPhee and Trout (1995) found shorter carcasses inNnanimals compared toNN ani-mals, in contrast to the present study in which no significant difference in MLC traits was observed between genotypes (p > 0.05). However, Milleret al.(1999) also observed no difference in carcass length betweenNNandNngenotypes. These authors suggested that this gene might have been re-moved from pig populations, since their results indicated only a small effect of thePSSgene on lean meat content.
Lundstromet al.(1995), studying F2crosses between European wild pigs and Large White animals, found no
sig-nificant difference in growth rate betweenPSSgenotypes, as also observed in the present study.
Higher (p < 0.05) skinless and fatless cut yields (HW, SFBSW and SFPSW) inNnthan inNNanimals were also
reported in the literature (Fisheret al., 2000a; Leachet al., 1996; Zhanget al., 1992). However, in contrast to Fisheret al.(2000b)Nnanimals also showed (p < 0.05) lower BCD
than NN animals. However, Fisher et al. (2000b) has slaughtered heavier (86 kg) pigs. In this case the lack of dif-ference in BCD betweenNNandNnanimals in their
experi-ment may have been due to the fact that theirNnanimals had already attained a growth phase of fast fat deposition which could diminish the difference in fat depth between these two genotypes. Lower BCD, associated with no dif-ference in BCW between the two genotypes, suggests higher lean meat content inNnanimals with a live weight up to 65 kg.
The lack of statistical differences (p > 0.05) in aver-age daily gain betweenNNandNnanimals disagrees with the results reported by Zhanget al.(1992) and McPheeet al.(1994), and is supported by Leachet al.(1996), Milleret al.(1999) and Jinet al.(2002). On the other hand, the lack of a difference (p > 0.05) in the feed:gain ratio betweenNN and Nnanimals disagrees with Leach et al. (1996), but agrees with the results reported by McPheeet al.(1994) and Milleret al.(1999). Taken together, the lack of statistical differences in average daily gain and the feed:gain ratio in-dicates that then allele does not influence these traits in pigs fed up to 65 kg of live weight. The lack of a difference (p > 0.05) in the W21 trait betweenNNandNnanimals con-firms the results of Jinet al.(2002).
In the present study, thePSSgene had a positive ef-fect on lean meat deposition and cut yields, but not on per-formance traits of pigs grown up to 65 kg of live weight. In addition, the effect of the PSS gene was even observed in animals resulting from divergent crossings, thus confirm-ing studies regardconfirm-ing the major effects of this gene.
Acknowledgments
The authors wish to thank FAPEMIG, CNPq and CAPES for financial support.
References
Bastos RG, Federezzi J, Deschamps JC, Cardellino RA and Dellagostin OA (2001) Efeito do gene do estresse suíno sobre características de quantidade e qualidade de carcaça. Revista Brasileira de Zootecnia 30:37-40.
Benevenuto Júnior AA (2001) Avaliação de rendimento de carcaça e de qualidade da carne de suínos comerciais, de raça nativa e cruzados. Master Thesis, Universidade Federal de Viçosa, Viçosa.
Eggert JM, Sheiss EB, Scinckel AP, Forrest JC, Grants AL, Mills SE and Watkins BA (1996) Effects of the halothane gene on muscle quality and carcass composition of pigs. http://
Table 3- Pig performance traits (means and standard deviations) obtained
for eachPSSgenotypes (NNandNn).
Trait Genotype
NN Nn
N1 Mean ± sd N1 Mean ± sd
BW (kg) 481 1.22 ± 0.28 103 1.20 ± 0.24
W21 (kg) 441 4.96 ± 1.09 102 5.08 ± 1.02
W77 (kg) 467 21.64 ± 4.16 103 20.99 ± 3.74
FI (kg) 456 40.49 ± 8.00 103 39.20 ± 7.39
ADG (kg) 449 0.54 ± 0.13 102 0.53 ± 0.12
FG (kg) 446 2.81 ± 0.67 101 2.75 ± 0.56
W105 (kg)* 450 36.82 ± 6.40 100 36.01 ± 5.39
1Number of observations for each trait and genotype.
www.pasture.ecn.purdue.edu/~epados/far.../swine/draftinfo/ genetic/pubs/eggert2 (accessed on 05/18/1999).
Fisher P, Mellett FD and Hoffman LC (2000a) Halothane geno-type and pork quality. 1. Carcass and meat quality traits from the three halothane genotypes. Meat Science 54:97-105. Fisher P, Mellett FD and Hoffman LC (2000b) Halothane
geno-type and pork quality. 2. Cured meat products from the three halothane genotypes. Meat Science 54:107-111.
Fisher P, Mellett FD and Hoffman LC (2000c) Halothane geno-type and pork quality. 3. Comminuted meat products de-rived from the three halothane genotypes. Meat Science 54:113-117.
Fujii J, Otsu K, Zorzato F, De Leon S, Khanna VK, Weiler JE, O’Brien PJ and Maclennan DH (1991) Identification of a mutation in the porcine ryanodine receptor associated with malignant hyperthermia. Science 253:448-451.
Hamilton DN, Ellis M, Miller KD, McKeith FK and Parret DF (2000) The effect of the Halothane and Rendement Napole genes on carcass and meat quality traits of pigs. Journal of Animal Science 78:2862-2867.
Houde A, Pommier SA and Roy R (1993) Detection of the ryanodine receptor mutation associated with malignant hyperthermia in purebred swine populations. Journal of Ani-mal Science 71:1414-1418.
Jin HJ, Kim CD, Chung HY, Yeon SH, Cho CY, Lee JH, Kim IC, Ryu IS, Yoo CH and Kim CI (2002) The effects of Porcine Stress Syndrome (PSS) genotype on growth and litter size. 7th World Congress on Genetics Applied to Livestock Pro-duction, August 19-23, Montpellier, France.
Leach LM, Ellis M, Sutton DS, McKeith FK and Wilson ER (1996) The growth performance, carcass traits, and meat quality of halothane carrier and negative pigs. Journal of An-imal Science 74:934-943.
Lundstrom K, Karlsson A, Hakansson J, Hansson I, Johansson M, Andersson and Andersson K (1995) Production, carcass,
and meat quality traits of F2-breed crosses between Euro-pean Wild Pigs and domestic pigs including halothane gene carriers. Animal Science 61:325-331.
McPhee CP, Daniels LJ, Kramer HL, Macbeth GM and Noble JW (1994) The effects of selection for lean growth and the halothane allele on growth performance and mortality of pigs in a tropical environment. Livestock Production Sci-ence 38:117-123.
McPhee CP and Trout GR (1995) The effects of selection for lean growth, and the halothane allele on carcass and meat quality of pigs transported long and short distances for slaughter. Livestock Production Science 42:55-62.
Miller D, Ellis M and McKeith FWE (1999) Influence of sire line and halothane genotype on growth performance, carcass and meat quality traits in pigs. http://www.ansci.uiuc.edu/ porknet/ (accessed on 06/04/1999).
Nascimento JD and Mota EO (2000) Dissecção de carcaças de suínos na Agroceres PIC. Informe Técnico AGROCERES PIC, 5 pp.
O’Brien PJ, Shen H, Cory CR and Zhang X (1993) Use of a DNA-based test for the mutation associated with Porcine Stress Syndrome (malignant hyperthermia) in 10,000 breed-ing swine. JAVMA 203:842-851.
Santana BAA, Borges GSN, Franco MM, Bernardeli K, Nunes ALP, Antunes RC, Borges M and Goulart LR (1998) Apli-cação da genotipagem do gene halotano ao melhoramento genético suíno. Anais II Simpósio Nacional de Melhora-mento Animal, Uberaba, MG, p 453.
SAS (1997) STAT User’s Guide. Statistical Analysis System. Cary, NC.
Zhang W, Kuhlers DL and Rempel E (1992) Halothane gene and swine performance. J Anim Sci 70:1307-1313.