Extinction of canid populations by inbreeding depression under stochastic
environments in Southwestern Goiás State: A simulation study
Flávia Melo Rodrigues
1,2and José Alexandre Felizola Diniz-Filho
3 1Departamento de Biologia, Universidade Estadual de Goiás, Anápolis, GO, Brazil.
2
Programa de Pós-Graduação em Ciências Ambientais, Universidade Federal de Goiás, Goiânia,
GO, Brazil.
3
Departamento de Biologia Geral, Instituto de Ciências Biológicas, Universidade Federal de Goiás,
Goiânia, GO, Brazil.
Abstract
A frequently addressed question in conservation biology is what is the chance of survival for a population for a given number of years under certain conditions of habitat loss and human activities. This can be estimated through an inte-grated analysis of genetic, demographic and landscape processes, which allows the prediction of more realistic and precise models of population persistence. In this study, we modeled extinction in stochastic environments under in-breeding depression for two canid species, the maned wolf (Chrysocyon brachiurus) and the crab-eating fox (Cerdocyon thous), in southwest Goiás State. Genetic parameters were obtained from six microsattelite loci (Short Tandem Repeats - STR), which allowed estimates of inbreeding levels and of the effective population size under a stepwise mutation model based on heterozygosis. The simulations included twelve alternative scenarios with vary-ing rates of habitat loss, magnitude of population fluctuation and initial inbreedvary-ing levels. ANOVA analyses of the simulation results showed that times to extinction were better explained by demographic parameters. Times to ex-tinction ranged from 352 to 844, in the worst and best scenario, respectively, for the large-bodied maned wolf. For the small-bodied crab-eating fox, these same estimates were 422 and 974 years. Simulations results are within the ex-pectation based on knowledge about species’ life history, genetics and demography. They suggest that populations can persist through a reasonable time (i.e., more than 200 years) even under the worst demographic scenario. Our analyses are a starting point for a more focused evaluation of persistence in these populations. Our results can be used in future research aiming at obtaining better estimates of parameters that may, in turn, be used to achieve more appropriate and realist population viability models at a regional scale.
Key words:population persistence, population viability analysis, canids, STR markers, Parque Nacional das Emas. Received: October 25, 2005; Accepted: September 28, 2006.
Introduction
Conserving biological diversity often requires searchers and environmental planners to face questions re-garding the persistence of local populations. One of them is what is the chance of population persistence for a given number of years under certain conditions of habitat and hu-man activity. This basic question motivated the creation and quick development of the research program in Popula-tion Viability Analysis (PVA) (Soulé, 1987; Morris and Doak, 2002). PVA is usually based on stochastic popula-tion models and is frequently used as a practical exercise in applied population ecology. It is based on real life history
parameters of the target species or populations and on ac-tual environmental features of the species habitat (Frankham et al., 2002; Morris and Doak, 2002). Thus, PVA allows an integrated analysis of genetic, demographic and landscape parameters that can provide an effective at-tempt to understand extinction risks and biodiversity loss (Prayet al., 1994; Britten, 1996; Henleet al., 2004).
Genetic factors have always been recognized as an important component in evaluating population persistence (O’Brienet al., 1983; Lynch and Lande, 1993, Soulé, 1987, Lande, 1993, 1999), but the development of easier ways to assess population variability and structure was necessary before they became really useful for practical purposes (Frankhamet al., 2002). Most of the research in the area fo-cuses on the endogamy levels in natural or managed popu-lations, on how these levels reflect in inbreeding depression www.sbg.org.br
Send correspondence to José Alexandre Felizola Diniz Filho. De-partamento de Biologia Geral, Instituto de Ciências Biológicas, Universidade Federal de Goiás, Caixa Postal 131, 74001-970 Goiânia, GO, Brazil. E-mail: [email protected].
and which components of fitness they affect (Barret and Charlesworth, 1991; Charlesworth and Charlesworth, 1987; Beisinger, 2000). These empirical estimates are usu-ally the basis of population genetics models, which can then be combined with demographic and life history data to gen-erate future scenarios at a landscape level using PVA.
The southwestern region of Goiás State, Brazil, domi-nated by the Cerrado biome, started to be agriculturally ex-plored in the late 1930s, with the expansion of the agricultural activities from the neighboring states of São Paulo, Minas Gerais and Paraná. In the 1950-1960s, the im-plementation of governmental programs led to rapidly in-creasing agricultural and agro-industrial activities in the region, generating an inevitable high level of land conver-sion from natural into human-modified landscapes (Klink and Moreira, 2002; Klink and Machado, 2005; Marris 2005). The Parque Nacional das Emas (PNE), created in the core of this region in the decade of 1960, is currently the largest conservation unit of integral protection in the Cerrado biome, with a relatively high population density of many large-bodied mammals (Rodrigueset al., 2002). Al-though large-bodied mammals perceive the habitat at course grain and would disperse in these human-modified landscapes, these new landscapes pose difficulties for ef-fective support of local populations and at least in part must limit their dispersion (e.g., Gehring and Swihart, 2003; Blancoet al., 2005)
In this study, we simulated extinction by inbreeding depression under stochastic environments using Tanaka’s (2000a) model to evaluate the time to extinctionTein two populations of Canids, the maned-wolf (Chrysocyon brachiurus) and the crab-eating fox (Cerdocyon thous), in southwestern Goiás State. We first conducted a population genetic analysis of these two species based on microsatellite (STR) data of specimens captured in the Parque Nacional das Emas and surroundings (Rodrigues, 2005). We used the estimated heterozygosis (He) to assess regional effective population size under a stepwise muta-tion model and to obtain the inbreeding coefficients. Other parameters of the simulations were obtained using a macroecological approach based on the overall knowledge of the region and species’ life history. In the simulations, we assumed that combined effects of restricted dispersion, habitat loss (i.e., reduction in the carrying capacity of the region), and environmental stochasticity can drive regional populations to extinction.
Methodology
The genetic model
Our population dynamics simulations were based on Tanaka’s model (2000a) of extinction by inbreeding de-pression in stochastic environments (see also Tanaka, 1997, 1998, 2000b). It assumes that inbreeding depression involves recessive deleterious genes, distributed amongn
diallelic autossomal loci and with similar mutation rates, selection coefficients and dominance. The model also as-sumes that effects of linkage disequilibrium and epistatic interactions are negligible. The genotypes AA, Aa and aa in each locus have mean fitness 1, 1 and 1 –s, wheresis the selection coefficient.
Tanaka’s model (2000a) is based on three dynamic recurrence equations for the mean allele frequencyq, the inbreeding coefficientFand the population sizeN. These equations are:
qt+1=qt–s[q2+Ftq(1 –q)] +µ+γ (1)
Ft+1= (1/2Nt+ (1 – 1/2Nt)Ft] (1 – 2µ) (1 –sqt) (2)
Nt+2=Nt+1exp[rmax(1 – (Nt+1/Kt+1) +ε]δ (3)
In equation (1),µis the mutation rate andγis a ran-dom normal variate with mean 0 and standard deviation equal to (q(1 -q)/ 2nN)1/2, wherenis the number of loci. Equation 3 shows that population sizeNgrows according to a discrete logistic model in timet, with carrying capacityK
and fluctuating around the average N with a standard devia-tionε. The Malthusian parameter (intrinsic growth rate) is given byrmax, and thus the discrete increase inNby genera-tion isλ, given by:
l = exp [(rmax)(1 –Nt/Kt)] (4)
However, population is also being disturbed by exter-nal events, so that we assume here that the carrying capacity
Kvaries in time and is being reduced at a ratehper timet(in years, since this is the scale ofλ), so that:
Kt+1= Kt - hKt (5)
The original model by Tanaka (2000a) was based on an exponential decrease, but we assumed a linear and con-stant decrease through time, generating a sharper decrease inK. Because of the relatively small intervals ofN(see be-low), this change will make little difference in relation to the original model. Besides, population size is reduced by the factorδ, which is a function of allele frequenciesqand by how deleterious genes affect the population growth rate. Thus, population growth is related to the genetic loadLand is given asλδ, where:
δ= (1 –L) = 1 –nsq2 (6)
Ecological context and model parametrization
1996). We used a stepwise-mutation model (Nei and Kumar, 2000) to estimate effective population size with the following equation:
He= 1 - [1/(1 +8Ne u)1/2] (7)
whereHeis the expected heterosigosity,Neis the effective population size anduis the mutation rate, equal to 10-4. We can thus approximate the effective population size of the maned wolf and the crab-eating fox in the region (not nec-essarily within the PNE) asNe≈500 andNe≈1000, re-spectively. Multiplying this number by a conservative factor of 2 (Morris and Doak, 2002) gives a reasonable ini-tial estimate of population sizeNin the region, in the ab-sence of better empirical estimates. Standard deviations in population sizeNwere set to 5 or 10 individuals, so that this parameter will cause small effects at high population densi-ties, but large effects at small densidensi-ties, promoting an ex-tinction vortex.
We simulated population dynamic processes in a re-gion surrounding a relatively large conservation unit (the PNE), so we ran the simulations with two relatively low rates of decrease in carrying capacityK, equal to 0.005 and 0.01 individuals*year-1. This also indicates that even if the PNE area is maintained for a long time, the carrying capac-ity of the population will still be reduced due to indirect border effects, such as the reduction of prey populations, pollution or loss of specific suitable habitats within the park.
There are no available growth rates data for the two species analyzed, and they were thus estimated with the fol-lowing empirical equation (Alroy, 2001):
rmax= exp[ 1.4967 – 0.37 (logM)]
where logMis the natural logarithm of the body mass of the species, equal to 24 kg for the maned wolf and to 6 kg for the crab-eating fox (Einsenberg and Redford, 1999). Thus, the maximum intrinsic growth rates were equal to 0.10 and 0.17, for the maned wolf and the crab-eating fox, respec-tively.
A large variation in the inbreeding coefficientsF esti-mated for six STR loci was observed in both species.F
ranged from -0.394 to 0.197 (average equal to -0.09) for the maned wolf and from -0.055 to 0.205 (average equal to 0.032) for the crab-eating fox. We thus ran the simulations with three low initialF-values, equal to 0.01, 0.05 and 0.10. Other parameters of genetic load were equal to those used by Tanaka (2000a), so thatµ= 10-4,n= 15000 loci and the selection coefficientsequals 1.
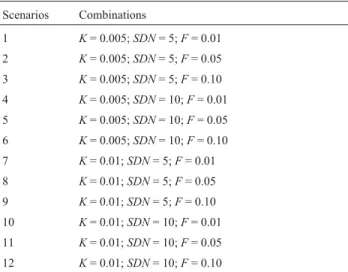
Simulations were run for each species using 12 com-binations of three varying parameters: ‘low’ and ‘high’ loss rates in carrying capacityK(0.005 and 0.01); ‘low’, ‘me-dium’ and ‘high’ inbreeding coefficientsF(0.01, 0.05 and 0.10) and ‘low’ and ‘high’ standard deviations in popula-tion size (5 and 10 individuals) (Table 1). For each combi-nation of parameters, 500 simulations were performed and
the time to extinctionTewas obtained. To evaluate how the combination of parameters used affectTe, a three-way fac-torial analysis of variance (ANOVA) (Sokal and Rohlf, 1995) was used.
Results
The average times to extinctionTefor both species were affected by the three parameters analyzed and their in-teractions, according to the ANOVA, butTewas specially affected byKandSDN(Table 2). As expected, the worst scenario (i.e., shorterTe) occurs for both species when pop-ulations fluctuate more, have highest inbreeding values and highest rates of decrease in carrying capacity (Table 1, sce-nario 12). On the other hand, the best scesce-nario occurred in the opposite conditions (Table 1, scenario 1). For similar combinations of parameters, the decrease in the maned wolf population is always faster than that of the wild dog population, as expected by its ‘slow’ life history parameters (smaller initial population sizeNand lower growth rater). Table 1- Twelve simulation scenarios based on the combination of three variable parameters: Carrying capacity (K), standard deviation of population size (SDN) and inbreeding coefficient (F).
Scenarios Combinations
1 K= 0.005;SDN= 5;F= 0.01
2 K= 0.005;SDN= 5;F= 0.05
3 K= 0.005;SDN= 5;F= 0.10
4 K= 0.005;SDN= 10;F= 0.01
5 K= 0.005;SDN= 10;F= 0.05
6 K= 0.005;SDN= 10;F= 0.10
7 K= 0.01;SDN= 5;F= 0.01
8 K= 0.01;SDN= 5;F= 0.05
9 K= 0.01;SDN= 5;F= 0.10
10 K= 0.01;SDN= 10;F= 0.01
11 K= 0.01;SDN= 10;F= 0.05
12 K= 0.01;SDN= 10;F= 0.10
Table 2 - F-values and their significance levels, from the factorial ANOVA applied to understand the components affecting time to extinc-tion (Te) in the two species analyzed, including variation in carrying ca-pacity (K), in standard deviation of population size (SDN) and in the inbreeding coefficient (F) and their first and second order interactions.
Source F(P)
Maned wolf Crab-eating fox
K 271470 (< 0.001) 353855 (0.000)
SDN 21113 (0.001) 19756 (0.000)
F 0.680 (0.507) 0.912 (0.402)
K*SDN 2241 (< 0.001) 2128 (0.000)
K*F 0.574 (0.563) 3.239 (0.039)
SDN*F 1.586 (0.205) 1.548 (0.213)
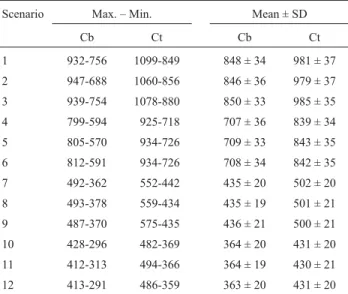
For the maned wolf,Tevalues ranged from 291 to 413 years, in the worst scenario, and from 756 to 932 years, in the best scenario. The most important factors affectingTein this species were K and SDN, and their interaction (Table 2), and the full ANOVA model explained 98% of the total variance inTe.
Similar results were found for the crab-eating fox. TheTevalues ranged from 359 to 486 years, in the worst scenario, and from 849 to 1099 years, in the best scenario. The most important factors affectingTein this species were alsoKandSDN, and their interaction, but there was also a significant component for the interaction betweenFandK
(Table 2). The ANOVA model also explained 98% of the total variance inTe.
Table 3 shows the detailed descriptive statistics forTe
in both species and one simulation example in the worst and best scenarios for each species are shown in Figures 1 and 2. The population size decreases, due to both the reduction in carrying capacity and the effects of inbreeding depres-sion. The average allele frequency q decreases quickly, whereas theF-values increase up to 1.0 (see also Tanaka, 2000a).
Discussion
The most important factors affecting the time to ex-tinction in both species analyzed were those related to the demographic process,i.e., the relative magnitude of popu-lation fluctuations and the reduction in the carrying capac-ity. These factors have always been considered as the most important in driving populations to extinction (Frankhamet al., 2002). The advantage of using Tanaka’s model (2000a) is that genetic factors were also incorporated, contributing to reduction in population size, since the genetic load di-rectly affects fitness. The absence of statistical significance of the levels ofF-values in the model does not mean that
these factors are not important, but just that the variation interval used was not large enough to generate variation in final Te, specially considering the stochastic variation aroundN. Neverthless, these values are probably close to real, considering the results obtained for other canid species in similar conditions (see Wayne, 1996; DeMattoset al., 2004) and our own analysis with six STR loci.
It is important to consider that some studies showed that large-bodied mammal populations can have relatively low genetic loads due to past bottleneck events that filter deleterious variability, thus being less affected by inbreed-ing (Vilàet al., 2002; Merola, 1994; O’Brienet al., 1983; Sage and Wolff, 1986; Avise, 2004).
The comparative analyses of the model parameters for both populations are in agreement with expectations based on demographic parameters and life history differ-Table 3- Time to extinction for the maned wolf (Cb) and the crab-eating fox (Ct) in 12 simulation scenarios (see Table 1).
Scenario Max. – Min. Mean ± SD
Cb Ct Cb Ct
1 932-756 1099-849 848 ± 34 981 ± 37
2 947-688 1060-856 846 ± 36 979 ± 37
3 939-754 1078-880 850 ± 33 985 ± 35
4 799-594 925-718 707 ± 36 839 ± 34
5 805-570 934-726 709 ± 33 843 ± 35
6 812-591 934-726 708 ± 34 842 ± 35
7 492-362 552-442 435 ± 20 502 ± 20
8 493-378 559-434 435 ± 19 501 ± 21
9 487-370 575-435 436 ± 21 500 ± 21
10 428-296 482-369 364 ± 20 431 ± 20
11 412-313 494-366 364 ± 19 430 ± 21
12 413-291 486-359 363 ± 20 431 ± 20
ences among species (e.g.Wayne, 1996). The maned wolf is a large-bodied canid with a large home range and a rela-tively low growth rate. Although it can disperse more effec-tively and is probably less sensitive to habitat loss and fragmentation, in some circumstances this absence of a strong population structure could increase the possibility of regional extinction (Henleet al., 2004). On the other hand, in small-bodied species, such as the crab-eating fox, growth rates are usually higher, which generates more population fluctuations. When associated with higher habitat special-ization (not the case with this species), this can generate more local extinction, which is usually counteracted by recolonization processes.
It is important to stress that the simulations that we performed should be viewed as mere initial evaluations of extinction risks and population viabilities. There are sev-eral reasons for that. First, there is no information on de-tailed genetic load for these populations and how this can be linked with basic population dynamics parameters, such as mortality rate and fecundity. Secondly, we derived the
initial population size N based on the expected heterozygosis estimated from a few microsatellite loci and the relation between effective and observed population sizes is unknown. The estimated population sizes provide approximations of populations in equilibrium in an evolu-tionary context. Recent events of population reduction and mortality, such as those caused by recent habitat loss and hunting in the last 50 years of intense human occupation in the region, could have occurred without changing the esti-mates based onHebecause their effects on genetic data are usually delayed. Finally, our model assumes that only habi-tat loss (generating reduction inK) affects genetic parame-ters, whereas in fact more complex extinction patterns, such as critical thresholds, can appear because of the inter-action between habitat loss and habitat fragmentation.
Our model is based on the persistence of a relatively large population at a regional scale, which is not unrealistic for the species studied considering their geographic range (see Eisenberg and Redford, 1999).We could also consider more drastic scenarios, specifically for southwestern Goiás State, by, for example, setting that core remaining popula-tions of both species are concentrated in PNE. Rough esti-mates of abundance by people performing field work in PNE suggest that population sizes for both species are at least one order of magnitude lower than the one we used in our simulations (Leandro Silveira, personal communica-tion). Starting with a population of 100 individuals of maned wolves in PNE, for example, theTewould be 126 years in average in the worst scenario and 364 years in the best scenario.
Our simulations showed that the populations of maned wolf and crab-eating fox in southwestern Goiás can persist for a reasonable time (i.e., for over 300 years) even in the worst possible scenario. These are initial theoretical projections and further detailed analyses of these popula-tions should be conducted. Nevertheless, our analysis is a starting point for a more focused evaluation of persistence in these populations and can drive future research towards obtaining better estimates of parameters that can, in turn, be used to achieve more appropriate and realistic models.
Acknowledgments
We thank Mariana Pires de Campos Telles, Leandro Silveira and Anah T.A. Jácomo for helpful discussions. This work was partially supported by a PRONEX program (CNPq/SECTE-GO) for establishing conservation priori-ties in the Brazilian Cerrado.
References
Alroy J (2001) A multi-species overkill simulation of the end-Pleistocene megafaunal mass extinction. Science 292:1893-1896.
Avise JC (2004) Molecular Markers, Natural History and Evolu-tion. Sinauer Press, Sunderland, 684 pp.
Barrett SCH and Charlesworth D (1991) Effects of a change in the level of inbreeding on the genetic load. Nature 352:522-524. Beissinger SR (2000) Ecological mechanisms of extinction. Proc
Natl Acad Sci USA 97:11688-11689.
Blanco JC, Cortés Y and Virgós E (2005) Wolf response to two kinds of barriers in an agricultural habitat in Spain. Can J Zool 83:312-323.
Britten HB (1996) Meta analyses of the association between multi locus heterozygosity and fitness. Evolution 50:2158 2164. Charlesworth D and Charlesworth B (1987) Inbreeding
depres-sion and its evolutionary consequences. Ann Rev Ecol Syst 18:237-268.
DeMattos PSR, Del Lama MA, Toppa RH and Arno Rudi Schwantes AR (2004) Populational genetic structure of free-living maned wolves (Chrysocyon brachyurus) deter-mined by proteic markers. Braz J Biol 64:639-644. Eisenberg JF and Redford KH (1999) Mammals of the
Neo-tropics: The Central Neotropics. V. III. Ecuador, Peru, Bolivia, Brazil. University of Chicago Press, Chicago, 609 pp.
Frankham R, Ballou JD and Briscoe DA (2002) Introduction to Conservation Genetics. Cambridge University Press, Cam-bridge, 640 pp.
Gehring TM and Swihart RK (2003) Body size, niche breadth, and ecologically scaled responses to habitat fragmentation: Mammalian predators in an agricultural landscape. Biol Conserv 109:283-295.
Henle K, Lindenmayer DB, Margules CR, Saunders DA and Wissel C (2004) Species survival in fragmented landscapes: Where are we now? Biodivers Conserv 13:1-8.
Klink CA and Machado RB (2005) Conservation of the Brazilian cerrado. Conserv Biol 19:707-713.
Klink CA and Moreira AG (2002) Past and current human occu-pation, and land use. In: Oliveira PS and Marques RJ (eds) The Cerrado of Brazil: Ecology and Natural History of a Neotropical Savanna. Columbia University Press, New York, pp 69-88.
Lande R (1993) Risks of population extinction from demographic and environmental stochasticity and random catastrophes. Am Nat 142:911-927.
Lande R (1999) Extinction risks from anthropogenic, ecological and genetic factors. In: Landweber LF and Dobson AP (eds) Genetics and the Extinction of Species. Princeton University Press, Princeton, pp 1-22.
Lynch M and Lande R (1993) Evolution and extinction in re-sponse to environmental change. In: P Kareiva, J Kingsolver and R Huey (eds) Biotic Interactions and Global Change. Sinauer Assocs., Inc. Sunderland, pp 234-250.
Marris E (2005) Conservation in Brazil: The forgotten ecosystem. Nature 437:944-945.
Merola M (1994) A reassessment of homozygosity and the case for inbreeding depression in the cheetah,Acinonyx jubatus: Implications for conservation. Conserv Biol 8:961-971. Morris WF and Doak DF (2002) Quantitative Conservation
Biol-ogy: The Theory and Practice of Population Viability Anal-ysis. Sinauer Associates, Sunderland, 480 pp.
Nei M and Kumar S (2000) Molecular Evolution and Phylogenetics. Oxford University Press, Oxford, 333 pp. O’Brien SJ, Wildt DE, Goldmann D, Merril CR and Bush M
(1983) The cheetah is depauperate in genetic variation. Sci-ence 221:459-462.
Pray LA, Schwartz JM, Goodnight GJ and Stevens L (1994) Envi-ronmental dependency of inbreeding depression: Implica-tions for conservation biology. Conserv Biol 8:562-568. Rodrigues FHG, Silveira L, Jácomo ATA, Bezerra AP, Coelho
AMR, Santos DC, Pagnozzi HG and Hass A (2002) Com-posição e caracterização da fauna de mamíferos do Parque Nacional das Emas, Goiás. Rev Bras Zool 19:589-600. Rodrigues FM (2005) Genética da conservação em duas espécies
de canídeos no Parque Nacional das Emas - GO. Tese de Doutorado. Universidade Federal de Goiás, Goiás. Sage RD and Wolff JO (1986) Pleistocene glaciations, fluctuating
ranges, and low genetic variability in a large mammal (Ovis dalli). Evolution 40:1092-1095.
Sokal R and Rohlf F (1985) Biometry. 3rd edition. W.H. Freeman & Company, USA, 395 pp.
Soulé M (1987) (ed) Viable Populations for Conservation. Cam-bridge University Press, CamCam-bridge, 189 pp.
Tanaka Y (1997) Extinction of populations due to inbreeding de-pression with demographic disturbances. Res Popul Ecol 39:57-66.
Tanaka Y (1998) Theoretical aspects of extinction by inbreeding depression. Res Popul Ecol 40:279-286.
Tanaka Y (2000a) Theoretical properties of extinction by inbreed-ing depression under stochastic environments. In: Ferson S and Burgman M (eds) Quantitative Methods for Conserva-tion Biology. Springer-Verlag, New York, pp 274-290. Tanaka Y (2000b) Extinction of populations by inbreeding
de-pression under stochastic environments. Res Popul Ecol 42:55-62.
Vilà C, Sundquist AK, Flagstad O, Seddon JM, Bjornerfeldt S, Kojola I, Sand H, Wabakken P and Ellegren H (2002) Res-cue of a severely bottlenecked wolf (Canis lupus) popula-tion by a single inmigrant. Proc R Soc Lond B 270:91-97. Wayne RK (1996) Conservation genetics in the Canidae. In:
Avise JC and Hanuick JL (eds) Conservation Genetics: Case Histories from Nature. Chapman & Hall, New York, pp 75-118.