STATISTICAL EVALUATION OF NUTRITIONAL COMPONENTS IMPACTING PHYCOCYANIN PRODUCTION IN SYNECHOCYSTIS SP.
Devendra V. Deshmukh; Pravin R. Puranik*
School of Life Sciences, North Maharashtra University, P.B. No. 80, Jalgaon 425 001, MS, India.
Submitted: August 26, 2010; Approved: January 16, 2012.
ABSTRACT
Alkaliphilic cyanobacterial cultures were isolated from Lonar lake (MS, India). Among the set of cultures, Synechocystis sp, was studied for phycocyanin production. A maximum yield was obtained in BG-11 medium at optimized conditions (pH 10 and 16 h light). In order to increase the phycocyanin yield media optimization based on the eight media components a Plackett-Burman design of the 12 experimental trials was used. As per the analysis CaCl2.2H2O and Na2CO3 have been found to be the most influencing media
components at 95% significance. Further the optimum concentrations of these components were estimated following a Box Wilson Central Composite Design (CCD) with four star points and five replicates at the center points for each of two factors was adopted for optimization of these two media components. The results indicated that there was an interlinked influence of CaCl2.2H2O and Na2CO3 on 98% significance.
The maximum yield of phycocyanin (12% of dry wt) could be obtained at 0.058 g/l and 0.115 g/l of CaCl2.2H2O and Na2CO3, respectively.
Key words: Synechocystis, Lonar lake, Phycocyanin, Plackett-Burman, Central composite design
INTRODUCTION
The alkaline lake of Lonar (Dist. Buldhana, MS, India, lat 19° 58’, lag 76° 34’) is one few alkaline lakes on the earth. Meteoritic impact around 50-60 thousand years ago formed this crater. This is a unique crater in basaltic rock (9). Craters formed by such hypervelocity impact are considered to be a unique ecological habitat (14). The lake water remains alkaline throughout the year owing to the high content of sodium carbonate. Soda lakes are characterized by the presence of
large amount of sodium carbonate (or complexes of these salts) formed by evaporative concentration under particular condition of geology, geography, and climate (7). Soda lakes are the most stable and productive naturally occurring alkaline environments in the world, with pH values greater than 10 (9).
Along with Spirulina, Synechocystis sp., a unicellular cyanobacterium gives the water a dull blue-green color. Cyanobacteria has four basic types of biliproteins i.e.; phycocyanin, allophycocyanin, phycoerythrin and phycoerythrocyanin (16). These chromophores, called bilins,
Deshmukh, D.V. et al. Phycocyanin production in Synechocystis sp.
are covalently attached to the cystine residues of the apoproteins. Allophycocyanin and C-phycocyanin have a bilin called as phycocyanobilin, and C-phycoerythrin has a bilin called phycoerythrobilin (15). The absorbance coefficient of phycobiliproteins is markedly higher than those of most commercial dyes (6). This is the main reason that phycobiliproteins are used as highly- fluorescent substance in Fluorescence Activated Cell Sorting (FACS), immunochemistry, detection of reactive oxygen species, and amino acid sequencing (1, 2). Cyanobacterial phycobiliproteins have gained importance in the commercial sector, as they have
several applications. The primary potential of these molecules
are as natural dyes but a number of investigations have shown
their health-promoting properties and broad range of
pharmaceutical applications (16). They are used as the
colorants in chewing gum, ice sherbets, popsicles, candies, soft
drinks, dairy products and cosmetics like lipstick and eyeliners.
In addition, phycobiliproteins are widely used in clinical and
immunological research laboratories (20).
The viability of product produced from micro-organism depends on cost of production and net yield of the product. Media composition and growth conditions influence culture growth rate and in this case phycocyanin production. In order to avoid conventional optimization, statistical models Fractional Factorial Design (FFD) and Central Composite Design (CCD) have been proved to be effective (8, 22). Here we attempt to increase the production of phycocyanin by Synechocystis sp, isolated from Lonar Lake, using methods of FFD and CCD. Media components affecting phycocyanin production were evaluated by the application of two-level factorial Plackett-Burman design (4, 13).
MATERIALS AND METHODS
Organism and Culture Conditions
The unicellular cyanobacterium Synechocystis sp. used in this study was isolated from the water sample of Lake Lonar. The identification was done as per Desikachary (5). The
cyanobacterium was maintained on BG-11 media (11). The pH of the media was adjusted with NaOH at 10.36 (lake water pH). In 250 ml capacity Erlenmeyer flasks 100 ml culture medium was taken and the initial cell density was maintained at 106 cells/ml. The flasks were exposed to a light intensity of 75 µmol photons.m-2.s-1 with a light/dark cycle of 16/8 h at 24 ± 2°C. The irradiance was measured under the white fluorescent tube light in the culture racks using a luxmeter.
Extraction of Phycocyanin
After incubation of 12 days the cells were harvested by
centrifugation at 5000 × g for 10 min at 5°C (Sorvall, USA, Model RC2). The pellet was washed with distilled water and resuspended in 5 ml of 0.05 M phosphate buffer. The content was sonicated (Sonics and Materials Inc., USA) with 30 Hz frequency at a pulse of 10/5 min. Freezing-thawing of the sonicated content was done at least for two times and cell rupture was confirmed microscopically. The extract was
centrifuged at 10000 × g for 10 min at 5°C. The supernatant was collected and the concentration of phycocyanin was measured spectrophotometrically at 615 and 652 nm using following Equation (1) with 0.05 M phosphate buffer as blank (11).
Phycocyanin (PC) mg/ml = {A615 − (0.474 × A652)}/5.34 (1)
Effect of pH and Light Exposure on Phycocyanin Production In order to check the effect of pH and light exposure on phycocyanin production two sets of Erlenmeyer flasks containing 100 ml BG-11 medium at varying pH (5 to 12) and light exposure (8L:16D, 12L:12D, 16L:8D and 24L:0D h) were inoculated with Synechocystis sp. The pH of the medium was adjusted using 0.1 M sodium hydroxide and incubated at 24 ±
2°C for 12 days. After incubation phycocyanin content was measured.
Statistical Analysis
the eight major nutrients in BG-11 growth medium that could influence the production of phycobiliproteins. The level of micronutrients was kept constant in all experiments. A method of least squares was used to analyze the experimental response fit using the following first-order model, Equation (2):
= 0 + 1X1 + 2X2 + 3X3 + 4X4 + 5X5 + 6X6 + 7X7 + 8X8
(2)
where, was the predicted response (phycobiliproteins yield),
0, 1, 2, 3, 4, 5, 6, 7 and 8 were the regression coefficients, and X1, X2, X3, X4, X5, X6, X7 and X8 were the coded
levels of the independent variables. Based on the first-order model equation obtained by the Plackett–Burman design, a second-order polynomial model i.e. a central composition design (CCD) with five coded levels was performed. The quadratic model for predicting the optimal point was expressed according to the following Equation (3):
= 0 + 1X1+ 2X2+ 11X12+ 12X1X2+ 22X22 (3)
where, was the predicted response (phycobiliprotein yield),
0, 1, 2, 11, 12 and 22 were the regression coefficients, and
X1 and X2 were the coded levels of the independent variables. All statistical analyses were done using statistical software MINITAB 13.31, USA, Inc.
RESULTS AND DISCUSSION
The alkaliphiles are unique microorganisms, with great potential for microbiology and biotechnological exploitation. In present study cyanobacterial culture, Synechocystis sp. was isolated from the soda lake of Lonar, which is a unique habitat in India, rich source of naturally occurring alkaliphilic microbes. Fig. 1 shows the effect of medium pH on phycocyanin production by Synechocystis sp. Culture could not grow at pH 5 and 6. Maximum phycocyanin production of 14.5 mg/l was obtained at pH 10. The phycocyanin production by
Synechocystis sp. was also assessed at varying light exposures (Fig. 2). Light exposure of 16 h was found optimum for phycocyanin production.
Deshmukh, D.V. et al. Phycocyanin production in Synechocystis sp.
Figure 2. Effect of light exposure on phycocyanin production by Synechocystis sp. grown in BG-11 medium at pH 10.36 at 24 ± 2°C with varying light exposure of 8, 12, 16 and 24 h (75 µmol photons.m-2.s-1)
Cyanotech is developing micro-algae based technologies and producing phycobiliproteins, currently range in price from US $ 5,000-33,000 g-1 (16). While Dainippon Ink Corporations have been the market leaders for many years in production of commercial products from algae and cyanobacteria (23). Statistical design is an aid to reach a statistical valid outcome with minimum number of observations (8,10). Response Surface Methodology (RSM) is a sequential procedure with an initial objective of leading the experimenter rapidly and efficiently to the general vicinity of the optimum and since the location of the optimum is unknown prior to running RSM
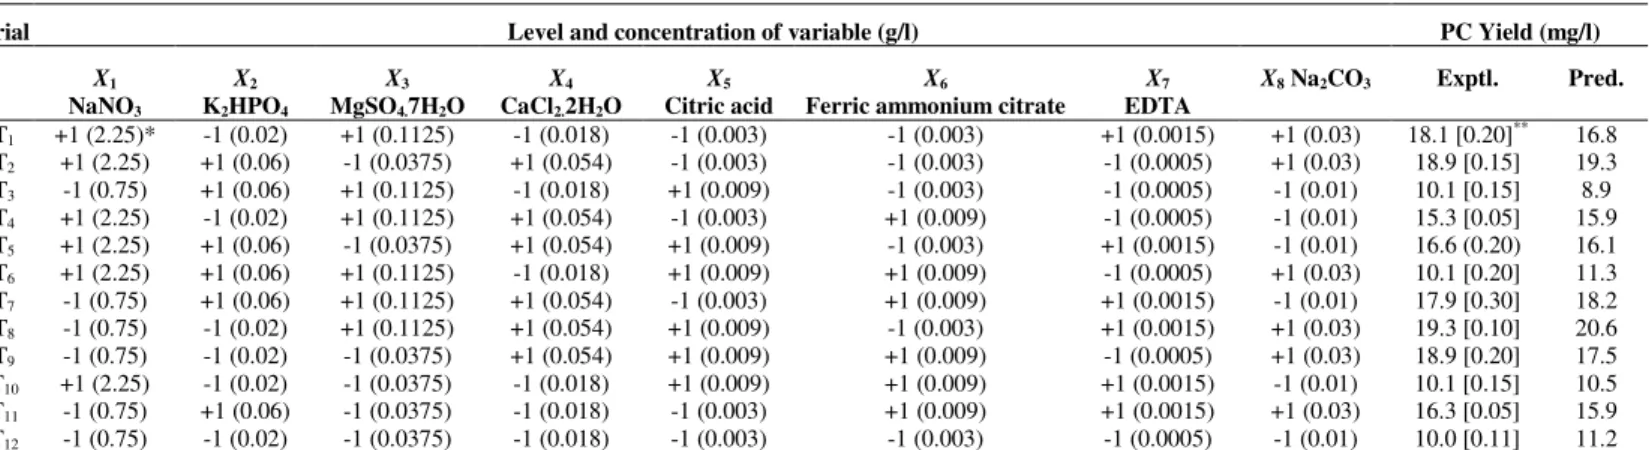
experiments; it makes sense to have a design that provides equal precision of estimation in all directions employed. Based on the eight media components a Plackett-Burman design of the 12 experimental trials was used as in Table 1. Each row represents the 12 different experiments to evaluate their effect on phycocyanin production and each column represents a different variable. Each independent variable was investigated at a high (+1) and a low (-1) level which represents two different nutrient concentrations. The significant levels of each media variable were determined by using t test and regression analysis and are shown in Table 2.
Table 1. The Plackett-Burman experimental design matrix for screening medium composition of BG-11
Trial Level and concentration of variable (g/l) PC Yield (mg/l)
X1 NaNO3
X2 K2HPO4
X3 MgSO4.7H2O
X4 CaCl2.2H2O
X5 Citric acid
X6
Ferric ammonium citrate
X7 EDTA
X8 Na2CO3 Exptl. Pred.
Table 2. Estimated effect on phycocyanin (PC) production from the results of Plackett-Burman design
Factor Effect Standard error t- value p-value Confidence level (%)
Intercept 0 = 15.13 0.5369 28.19 0 -
X1 1 = -0.57 0.5369 -0.53 0.634 36.6
X2 2 = -0.30 0.5369 -0.28 0.798 20.2
X3 3 = 0 0.5369 0 1.000 0
X4 4 = 5.37 0.5369 5.00 0.015 98.5
X5 5 = -1.90 0.5369 -1.77 0.175 82.5
X6 6 = -0.73 0.5369 -0.68 0.544 45.6
X7 7 = 2.50 0.5369 2.33 0.102 89.8
X8 8 = 3.60 0.5369 3.35 0.044 95.6
The experimental yields of phycocyanin at varied levels of medium components as per Plackett-Burman design are given in Table 1. The analysis showed that CaCl2.2H2O and Na2CO3
had a significant influence (95% significant level) on phycocyanin production, while other factors had insignificant influence on phycocyanin production from Synechocystis sp. On the basis of statistical testing and the F-test applied for the analysis of variance (ANOVA) the F-value and p-value were 5.70 and 0.090, respectively. The coefficient of determination (R2) obtained was 0.938 had indicating that the model explained 93.8%.of variability in the response.
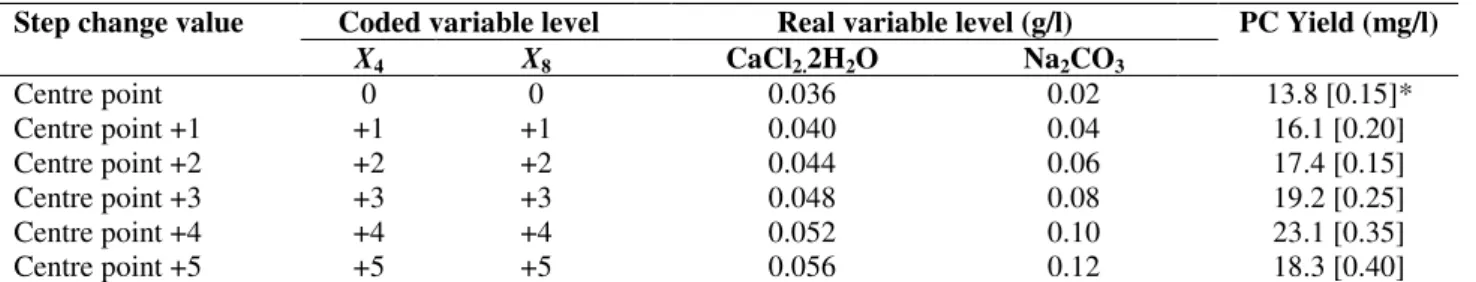
Though the Plackett-Burman design pointed out the factors influencing phycocyanin production one cannot determine the exact optimum values of the individual factors. This has necessitated using a second order experimental design. A central composite design (CCD) was applied. A steepest ascent experiment was performed before the second-order polynomial model. The design and the steepest ascent experiment are shown in Table 3. In CCD the centre point could be taken as a level that had shown maximum response in
the steepest ascent experiment (21). It can be seen from Table 3 that the maximum phycocyanin production was obtained at 0.052 g/l of CaCl2.2H2O and 0.10 g/l of Na2CO3. On this basis
a Box Wilson CCD (22) with four star points and five replicates at the center points for each of two factors was adopted for optimization of these two media components. Table 4 shows the observed and predicted values of phycocyanin yield obtained using CCD Equation (3).
The real values of significant variables X4 and X8 used in
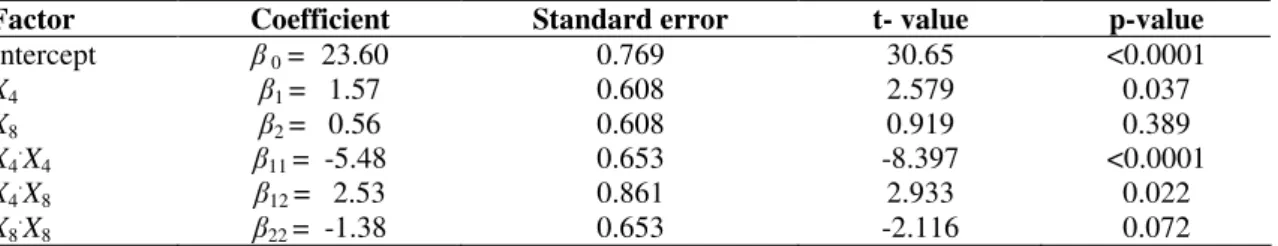
the Box Wilson model are shown in Table 5. The significant levels of each variable were determined by t-test (Table 6). The factors, X4.X4 and X4 were found to be significant with a
probability of 99% and 96.3%, respectively. The interaction between X4 and X8 had an interlinked influence on phycocyanin
production at 98% significance.
The equation for phycocyanin yield for the second order model could be written as:
= 23.6 + 1.574 X4 + 0.564 X8 – 5.483 X4.X4 + 2.528 X4.X8 –
1.381X8.X8 (4)
Table 3. The steepest ascent experiment for determination of centre point for CCD
Step change value Coded variable level Real variable level (g/l) PC Yield (mg/l)
X4 X8 CaCl2.2H2O Na2CO3
Centre point 0 0 0.036 0.02 13.8 [0.15]*
Centre point +1 +1 +1 0.040 0.04 16.1 [0.20]
Centre point +2 +2 +2 0.044 0.06 17.4 [0.15]
Centre point +3 +3 +3 0.048 0.08 19.2 [0.25]
Centre point +4 +4 +4 0.052 0.10 23.1 [0.35]
Centre point +5 +5 +5 0.056 0.12 18.3 [0.40]
Deshmukh, D.V. et al. Phycocyanin production in Synechocystis sp.
Table 4. Central composite design and the corresponding responses for phycocyanin.
Run X4 X8 PC Yield (mg/l)
Exptl. Pred.
1 -1.000 -1.000 15.6 [0.25]* 17.1
2 1.000 -1.000 12.8 [0.15] 15.2
3 -1.000 1.000 13.0 [0.30] 13.2
4 1.000 1.000 20.3 [0.05] 21.4
5 -1.414 0.000 11.1 [0.30] 10.4
6 1.414 0.000 16.8 [0.25] 14.8
7 0 -1.414 22.3 [0.20] 20.0
8 0 1.414 22.0 [0.20] 21.6
9 0 0 23.8 [0.20] 23.6
10 0 0 23.9 [0.10] 23.6
11 0 0 24.1 [0.15] 23.6
12 0 0 23.8 [0.15] 23.6
13 0 0 22.4 [0.05] 23.6
X4, CaCl2.2H2O; X8, Na2CO3; Exptl, Experimental response; Pred, Predicted (values calculated from the fitted second order model), * Values in rectangle brackets are of standard deviation.
Table 5. Real values of the significant factors used in CCD.
Factor Component Real values
-1.414 -1 0 +1 +1.414
X4 CaCl2.2H2O (g/l) 0.023 0.026 0.052 0.078 0.083
X8 Na2CO3 (g/l) 0.046 0.05 0.1 0.15 0.16
Table 6. Coefficients and t values calculated from the central composition experiment
Factor Coefficient Standard error t- value p-value
Intercept 0 = 23.60 0.769 30.65 <0.0001
X4 1 = 1.57 0.608 2.579 0.037
X8 2 = 0.56 0.608 0.919 0.389
X4.X4 11= -5.48 0.653 -8.397 <0.0001
X4 .
X8 12 = 2.53 0.861 2.933 0.022
X8.X8 22 = -1.38 0.653 -2.116 0.072
Statistical testing of the experimental data was carried out using Fisher’s test for analysis of variance (ANOVA) using MINITAB 13.31. The F- and p-values were 17.54 and 0.001, respectively. The quality of the fit of the quadratic regression model equation was expressed by R2, which indicated 92.6% of
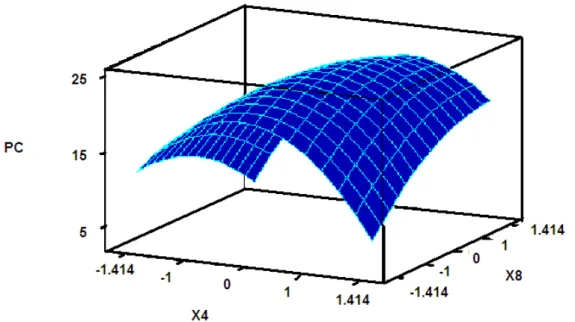
the variability of the response could be explained by this model. The value of the Adj R2 (87.3%) also indicated the high significance of the model. Thus these results indicated that the response equation provided a suitable model for the CCD experiment. The response surface plot for the CCD used for phycocyanin production is depicted in Fig. 3. It can be seen that maximum yield of phycocyanin (23.8 mg/l, i.e. 12% of cell
dry weight) could be obtained at 0.058 g/l and 0.115 g/l of X4,
CaCl2.2H2O and X8, Na2CO3, respectively.
In order to confirm the second order model, Synechocystis sp. was grown using optimized media constituents and yielded 22.6 mg/l of phycocyanin. The yield of phycocyanin obtained with Synechocystis sp. isolated from Lonar lake was comparable with earlier report on Synechocystis sp. PCC 6701 (25 mg/l) (8). Nitrate and phosphate were identified as the most significant factors.
production of phycobiliproteins. Gloeotrichia natans, a nitrogen fixing cyanobacterium has been studied as a possible source of phycobiliproteins (3). Under optimal growth conditions (38°C, pH 8.0, with no carbon enrichment), the specific growth rate of the rice-field isolate of Gloeotrichia natans was 0.076 h-1. The pH of the medium (between 6.5 and 9.0) did not influence the growth rate, but it did affect phycobiliprotein content, as reflected by a change of the color of the cultures. At pH 7.0, the culture was green-brown with phycobiliproteins constituting up to 10% of the total protein, while at pH 9.0 the culture was brownish-black and the content of these pigments was as high as 28% of the total protein. In the current study the optimum pH level for the production of phycocyanin was found to be pH 10 (Fig. 1). Phycocyanin production from cyanobacterial cultures has been reported to be dependent on various factors viz. culture conditions, particularly nitrogen and carbon sources. Supply of 3% carbon dioxide and 97% nitrogen in gaseous form supported 20.1% of C-phycocyanin yield in a laboratory culture of Nostoc sp. (19). A screening process indicated that the content of C-phycocyanin was 17% of dry weight in some strains of Anabaena and Nostoc and 10% of in some Nostoc sp. (12). A commercial process of
open-tank mass cultivation of a marine cyanobacterium Phormidium valderianum BDU 30501 was also developed for producing phycocyanin (17). The average pigment yield was 20% on dry weight basis. Optimization of mass cultivation media for the production of biomass and natural colourants from marine cyanobacteria by a mathematical design of experiments were also performed (18). Kathiresan et al. (10) reported effect of major media constituents of Porphyridium spp. studied using response surface methodology (RSM) on biomass yield, total phycobiliprotein and the production of phycoerythrin. The independent variables such as concentration of NaCl, MgSO4,
NaNO3 and K2HPO4 influenced the total phycobiliproteins and
phycoerythrin production.
The production of phycobiliproteins by cyanobacteria has been observed as a pH dependent phenomenon (8). The production of phycobiliproteins increases with increase in alkaline conditions. The soda lake habitats often have a combination of Ca2+ and carbonate levels (7). The Synechocystis sp. was isolated from Lonar Lake, a saline alkaline condition. The alkaline conditions are mainly favorable for primary producers such as cyanobacteria in the lake.
Figure 3. Response surface plot of phycocyanin (PC) production as a function of CaCl2.2H2O (X4) and Na2CO3 (X8). When X4 =
Deshmukh, D.V. et al. Phycocyanin production in Synechocystis sp.
ACKNOWLEDGEMENTS
The author Devendra Deshmukh is thankful to University Grants Commission, New Delhi for providing Junior Research Fellowship under Research Fellowship in Science for Meritorious Students (RFSMS) Scheme. The financial assistance towards instrumentation facility at School of Life Sciences from UGC, New Delhi under SAP-DRS program and DST, New Delhi under FIST program is duly acknowledged.
REFERENCES
1. Arad, S.M.; Yaron, A. (1992). Natural pigments from red microalgae for use in foods and cosmetics. Trends Food Sci. Technol., 3, 92-97. 2. Bermejo, R.; Talavera, E.M.; DelValle, C.; Alvarez-Pez, J.M. (2000).
C-phycocyanin incorporated into reverse micelles: a fluorescence study. Colloids Surf. B Biointerfaces, 18, 51-59.
3. Boussiba, S. (1991). Nitrogen fixing cyanobacteria potential uses. Plant Soil, 137, 177-180.
4. Deshmukh, D.V.; Puranik, P.R. (2010). Application of Plackett-Burman design to evaluate media components affecting antibacterial activity of alkaliphilic cyanobacteria isolated from Lonar Lake. Tur. J. Biochem., 35, 112-118.
5. Desikachary, T.V. (1959). Cyanophyta. Indian Council of Agricultural Research, New Delhi, India.
6. Glazer, A.N. (1999). Phycobiliproteins. In: Cohen, Z. (ed). Chemicals from Microalgae. Taylor and Francis Ltd, London, p.261-280.
7. Grant, W.D. (2004). Half a lifetime in soda lakes. In: Ventosa, A. (ed). Halophilic Microorganisms. Springer-Verlag, Berlin, p.17-32.
8. Hong, S.J.; Lee, C.G. (2008). Statistical optimization of culture media for production of phycobiliprotein by Synechocystis sp. PCC 6701. Biotechnol. Bioprocess Eng., 13, 491-498.
9. Joshi, A.A.; Kanekar, P.P.; Kelkar, A.S.; Shouche, Y.S.; Wani, A.A.;
Borgave, S.B.; Sarnaik, S.S. (2008). Cultivable bacterial diversity of
alkaline lonar lake, India. Microbial Ecology, 55, 163-172.
10. Kathiresan, S.; Sarada, R.; Battacharya, S.; Ravishankar, G.A. (2006). Culture media optimization for growth and phycoerythrin production
from Porphyridium purpureum. Biotechnol. Bioeng., 96, 456-463. 11. Kaushik, B.D. (1987). Laboratory methods for blue-green algae.
Associated Publication Co., New Delhi, India.
12. Moreno, J.; Rodriquez, M.; Vargas, A.; Rivas, J.; Guerrero, M. (1995). Nitrogen fixing cyanobacteria as a source of phycobiliproteins pigments - composition and growth performance of ten filamentous heterocystous strains. J. Appl. Phycol., 7, 17-23.
13. Plackett, R.L.; Burman, J.P. (1946). The design of optimum multifactorial experiments. Biometrika, 33, 305-325.
14. Ranade, D.R.; Thakker, C.D. (2002). An alkalophilic Methanosarcina isolated from Lonar crater. Curr. Sci., 82, 455-458.
15. Samsonoff, W.A.; MacColl, R. (2001). Biliproteins and phycobilisomes from cyanobacteria and red algae at the extreme of habitat. Arch. Microbiol., 176, 400-405.
16. Sekar, S.; Chandramohan, M. (2008). Phycobiliproteins as a commodity: trends in applied research, patents and commercialization. J. Appl. Phycol., 20, 113-136.
17. Sekar, S.; Subramanian, G. (1998). A method of mass cultivation of the marine cyanobacterium Phormidium valderianum BDU 30501 for the production of blue natural colourant phycocyanin. In: Subramanian, G., Kaushik, B.D., Venkataraman, G.S. (eds). Cyanobacterial Biotechnology. Science Publishers, New Hampshire.
18. Sekar, S.; Priya, S.L.; Roy, W.P. (2000). Optimization of mass cultivation media for the production of biomass and natural colourants from two marine cyanobacteria by a mathematical design of experiments. J. Plant Biotechnol., 2, 157-163.
19. Silva, H.; Cortinas, T.I.; Ertola, R.J. (1989). Effect of nutritional factors on the culture of Nostoc sp. as a source of phycobiliproteins. Appl. Microbiol. Biotechnol., 31, 293-297.
20. Spolaore, P.; Cassan, C.J.; Duran, E.; Isambert, A. (2006). Commercial application of microalgae. J. Biosci. Bioeng., 101, 87-96. 21. Wu, C.F.J.; Hamada, M. (2000). Experiments: Planning, Analysis, and
Parameter Design Optimization. Wiley, New York.
22. Xiao, Z.J.; Liu, P.H.; Qin, J.Y.; Xu, P. (2007). Statistical optimization of medium components for enhanced acetoin production from molasses and soybean meal hydrolysate. Appl. Microbiol. Biotechnol., 74, 61-68.
23. Yamaguchi, K. (1997) Recent advances in microalgal bioscience in Japan, with special reference to utilization of biomass and metabolites: a review. J. Appl. Phycol., 8, 487-502.