Enteroaggregative
Escherichia coli
Subclinical
Infection and Coinfections and Impaired Child
Growth in the MAL-ED Cohort Study
Aldo A.M. Lima,
Alberto M. Soares,
Jose´ Q.S. Filho,
Alexandre Havt,
Ila F.N. Lima,
Noe´lia L. Lima,
Cla´udia B. Abreu,
Francisco S. Junior,
Rosa M.S. Mota,
yWilliam K.-Y. Pan,
zChristopher Troeger,
Pedro H.Q.S. Medeiros,
Herlice N. Veras,
Mara A. Prata,
§Ben J.J. McCormick,
§Monica McGrath,
jj
Elizabeth T. Rogawski,
jjEric R. Houpt,
jjJames A. Platts-Mills,
jjJean Gratz,
ôAmidou Samie,
ôPascal Bessong,
#Sudhir Babji,
Gangadeep Kang,
yyShahida Qureshi,
yySadia Shakoor,
zzZulfigar A. Bhutta,
§§
Rashidul Haque,
§§
Tahmeed Ahmed,
jjjjEstomih R. Mduma,
ôôErling Svensen,
##Margaret Kosek,
##Pablo P. Yori,
Ladaporn Bodhidatta,
Shrestha Jasmin,
yyy
Carl J. Mason,
zzzDennis Lang,
zzzMichael Gottlieb, and
jjRichard L. Guerrant
ABSTRACT
Objective: We evaluated the impact of subclinical enteroaggregative
Escherichia coli(EAEC) infection alone and in combination with other pathogens in the first 6 months of life on child growth.
Methods:Nondiarrheal samples from 1684 children across 8 Multisite Birth Cohort Study, Malnutrition and Enteric Diseases (MAL-ED) sites in Asia, Africa, and Latin America were tested monthly; more than 90% of children were followed-up twice weekly for the first 6 months of life.
Results:Children with subclinical EAEC infection did not show altered growth between enrollment and 6 months. Conversely, EAEC coinfection with any other pathogen was negatively associated with delta weight-for-length (P<0.05) and weight-for-age (P>0.05)zscores between 0 and 6 months. The presence of 2 or more pathogens without EAEC was not significantly associated with delta weight-for-length and weight-for-age. The most frequent EAEC coinfections includedCampylobacterspp, heat-labile toxin-producing enterotoxigenicE coli,Cryptosporidiumspp, and atypical enteropathogenicE coli. Myeloperoxidase levels were increased with EAEC coinfection (P<0.05). EAEC pathogen codetection was associated with lower neopterin levels compared to those of no-pathogen control children (P<0.05). Mothers of children with EAEC coinfections had lower levels of education, poorer hygiene and sanitation, lower socioeconomic status, and lower breast-feeding rates compared to mothers of children in whom no pathogen was detected (P<0.05).
Conclusions: These data emphasize the public health importance of subclinical EAEC infection in early infancy in association with other pathogens and the need for improved maternal and child care, hygiene, sanitation, and socioeconomic factors.
Key Words:enteroaggregativeEscherichia coli, gut inflammation, intestinal immune responses, nutritional status, pathogen enteroaggregative
Escherichia colicoinfection
(JPGN2018;66: 325–333)
What Is Known
In pediatric cohort studies, enteroaggregative Escher-ichia coliwas frequently detected in developing coun-tries;
EnteroaggregativeE coliwas associated with growth deficits in these children;
The potential impact of enteroaggregative E coli subclinical infections and the presence of co-infec-tions on child growth remain unclear.
What Is New
Isolated subclinical enteroaggregativeE coliinfection does not influence child growth in the first six months of life;
Increased pathogen enteroaggregativeE coli coinfec-tion is negatively associated with delta weight-for-length and weight-for-agezscores, which are partially dependent on the presence of enteroaggregativeE coli. These data emphasize the importance of subclinical enteroaggregative E coli coinfections in early child-hood.
E
scherichia coliare an important cause of enteric infections,and the following 5 enterovirulent types have been
identi-fied: enterotoxigenic E coli, Shiga toxin-producing E coli,
Received March 8, 2017; accepted July 8, 2017.
From the Clinical Research Unit and Institute of Biomedicine, Universidade Federal do Ceara, Fortaleza, Ceara´, Brazil, the yDuke Global Health Institute, Duke University, Durham, NC, thezInstitute for Health Metrics and Evaluation, Seattle, WA, the §National Institutes of Health, Fogarty International Center, Bethesda, MD, thejjDivision of Infectious Diseases and International Health, University of Virginia, Charlottesville, VA, theôDepartment of Microbiology, University of Venda, the#Division of Gastrointestinal Sciences, Christian Medical College and Hospital Vellore, Vellore, India, the Department of Gastrointestinal Sciences Christian Medical College, theyyAga Khan University, thezzDepartment of Pediatrics, Aga Khan University, Naush-ahro Feroze, Pakistan, the §§International Centre for Diarrhoeal Disease Research, ICDDR-B, Dhaka, Bangladesh, thejjjjHaydom Lutheran Hos-pital, Moshi, Tanzania, theôôHaukeland University Hospital, Haydom, Tanzania, the ##Johns Hopkins University, Baltimore, MD, the
Walter Reed AFRIMS Research Unit Nepal, theyyyArmed Forces Research Institute of Medical Sciences, Kathmandu, Nepal, and the zzzFoundation for the National Institutes of Health, Baltimore, MD. Address correspondence and reprint requests to Aldo A.M. Lima, PhD,
Clinical Research Unit and Institute of Biomedicine, Universidade Federal do Ceara, R. Cel. Nunes de Melo, 1315, Rodolfo Teo´filo, Fortaleza, CEP 60430-270, CE, Brazil (e-mail: alima@ufc.br).
Supplemental digital content is available for this article. Direct URL citations appear in the printed text, and links to the digital files are provided in the HTML text of this article on the journal’s Web site (www.jpgn.org). The authors report no conflicts of interest.
Copyright # 2017 by European Society for Pediatric Gastroenterology, Hepatology, and Nutrition and North American Society for Pediatric Gastroenterology, Hepatology, and Nutrition
enteroinvasiveE coli, enteropathogenicE coli, and
enteroaggre-gative E coli (EAEC) (1–3). The multisite birth cohort study,
Malnutrition and Enteric Diseases (MAL-ED), involved intensive community surveillance for diarrhea and nondiarrheal stools over the first 2 years of life from 8 sites in South America, Africa, and Asia, showed that EAEC were frequently detected in children with and without diarrhea (4). These results were consistent with early data reported in a small cohort study in Fortaleza CE, Brazil (5). The EAEC pathogen burden in the MAL-ED birth cohort study was associated with growth deficits in these children (The MAL-ED contributors. Factors affecting growth velocity and risk factors for stunting in the first 24 months of life: results from the MAL-ED study. MAL-ED major paper in preparation to submit soon). However, the potential impact of EAEC associated with coinfec-tions in early infancy on child growth remains unclear. The MAL-ED birth cohort study also reported that both the incidence of diarrhea and the number of pathogens detected per stool increased markedly during the first year of life (4). Two or more pathogens were identified in 41% (2999) of diarrhea samples and 29% (7046) of nondiarrheal samples, suggesting that coinfections are common in these children in their first year of life. Therefore, we examined subclinical or ‘‘silent’’ EAEC infections alone and in combination with other pathogens and their associations with child growth in the first 6 months of life.
Early studies have shown that EAEC is an inflammatory pathogen and that growth deficits occur in children when the bacterium is acquired, with or without diarrheal symptoms (6,7). The potential impact of subclinical EAEC infections and the presence of coinfections on the pathobiology of EAEC infections and effects on child growth remain unclear.
We hypothesized that maternal education, birth weight, breast-feeding, and socioeconomic status (SES) will increase the risk of acquiring asymptomatic EAEC alone or with other enteric pathogens in early infancy, leading to gut inflammation and impaired growth. The aim of the present study was thus to under-stand the risk factors, gut integrity, inflammation, and innate immune responses associated with EAEC or in combination with other enteric pathogens and their impact on growth in the first 6 months of life across all 8 sites in the MAL-ED multisite birth cohort study.
METHODS
Study Setting
This study was conducted across 8 locations: Dhaka, Bangladesh (BGD); Fortaleza, Brazil (BRF); Vellore, India (INV); Bhaktapur, Nepal (NEB); Loreto, Peru (PEL); Naushero Feroze, Pakistan (PKN); Venda, South Africa (SAV); and Haydom, Tanzania (TZH). A detailed description of the MAL-ED study location, demography, and SES has been reported elsewhere (8– 15).
Study Design, Population, and Ethical Approval
In this longitudinal birth cohort study, infants up to 2 years of age were followed-up in each of the 8 study sites; this report included data collected during the first 6 months of life. The overall design of the project has been described in detail else-where (16 – 23). The study and consent protocols were approved by the local institutional review board (IRB) at all sites and the collaborating institution IRBs. Written informed consent was obtained from the parent or guardian of every child. We enrolled infants within 17 days of birth between November 2009 and February 2012.
Surveillance and Stool Collection
Surveillance was performed during twice-weekly household visits. Caregivers responded to a standardized questionnaire designed to collect data regarding daily symptoms of cough, fever, vomiting, diarrhea, and medication use. We investigated nondiar-rheal specimens that were collected during the surveillance between 1 and 6 months of age. The overall surveillance methods used in the MAL-ED cohorts have been described in detail elsewhere (16).
Maternal Education, Birth Weight, and
Breast-feeding Variables, and Socioeconomic Status
Questionnaires were developed to collect information about child anthropometrics, child care, characteristics of the mother or caregiver, household, people usually sleeping in the house, sources of water, toilet facilities, average monthly income, and other related parameters. For SES determination, we used a standardized SES questionnaire applicable to the MAL-ED cohorts (24). The defined variables and their parameterizations are shown in Supplementary Table 1 (Supplemental Digital Content 1, http://links.lww.com/
MPG/B92).
Anthropometric Measurements
The study protocol used a standard recumbent length mea-suring board (Schorr Productions, Olney, MD) to measure the monthly length of all enrolled children to the nearest 0.1 cm. Digital scales were also used monthly to measure weight to the nearest 100 g. The for-age (WAZ), length-for-age (LAZ), and weight-for-length (WLZ)zscores were calculated using the World Health Organization Multi-Country Growth Reference Study (25).
Microbiology and Stool Testing
The nondiarrheal specimens were analyzed in accordance with a standardized microbiology protocol, which was implemented at all study sites. The protocol has previously been described in detail (20). Briefly, we selected a pool of 5 lactose-fermenting colonies resem-blingE coli and characterized them for virulence genes using a multiplex polymerase chain reaction assay. Details of the virulence genes selected for the polymerase chain reaction probes are presented in the references of the article by Houpt et al (20).
Gut Function Integrity, Immune, and
Inflammatory Biomarkers
The lactulose:mannitol test was used to evaluate intestinal permeability, malabsorption, and damage and was administered to children at 3 and 6 months. The average of these 2 measurements used for the analysis. Lactulose and mannitol were measured as previously described (26).
Three additional biomarkers were also measured monthly in nondiarrheal stools between 0 and 6 months of age and the average of these measurements used for this analysis. These included alpha-1-antitrypsin (A1AT), myeloperoxidase (MPO), and neopterin (NEO) (26).
Statistical Analysis
We evaluated cumulative EAEC infection alone and in combination with any other enteric pathogen in monthly nondiar-rheal stools from asymptomatic children across 8 MAL-ED sites in Asia, Africa, and Latin America. Children were selected when they had90% active surveillance (Surveillance Assessment Form) for 0 to 6 months, had collected a Follow-up Socioeconomic status form for 0 to 6 months, and had stool samples with a complete microbiology workup.
Pathogen Coinfections and Outcome Variables
To determine the impact of EAEC infection alone and in combination with any other enteric pathogen coinfection, we divided the cohort children into 7 groups based on the cumulative monthly stool detection of enteric pathogens as follows: children with no pathogen detection in every stool collected; children with EAEC in any stool collected; children with EAEC and 1 other pathogen; children with EAEC and 2 other pathogens; children with EAEC and 3 or more other pathogens; children with 1 or 2 pathogens other than EAEC; and children with 3 or more pathogens other than EAEC. The major outcome variables were WAZ, length-for-age, and WLZ deltaszscores (0–6 months). The secondary outcome vari-ables included the average 0 to 6 months’ gut function, inflamma-tion, and innate immune response marker association in the study groups. Categorization of groups based on cumulative EAEC infection alone or coinfection with any other enteric pathogen enabled us to assess the impact of EAEC alone or in combination with other enteric pathogens on child growth.
Chi-square or Fisher exact tests were performed to compare categorical variables between the 7 groups defined above. Studentt
tests for normally distributed data and Kruskal-Wallis tests for non-normally distributed data were used to compare continuous vari-ables between these groups.
We performed a mixed-effects linear regression analysis on child growth in the first 6 months of life. The differences in WAZ, WLZ, and LAZzscores between enrollment and 6 months were regressed against EAEC exposure with and without other enteric pathogens. We included model covariates based on biologic plau-sibility that included child sex, weight, and/or length at enrollment, an indicator of household food insecurity, and proportion of days of breast-feeding, symptoms of acute lower respiratory infection, and antibiotic use. Definitions of the surveillance covariates are pro-vided in Supplementary Table 1 (Supplemental Digital Content 1,
http://links.lww.com/MPG/B92). The model included a random
intercept on the study site to account for unexplained variation in the model due to site variability.
Statistical analysis was conducted using IBM SPSS Statistics for Windows, version 20.0 (IBM Corp, Armonk, NY). Regression and plots were performed in R v.3.2.2 using the ‘‘lme4’’ package.P
values<0.05 were considered statistically significant.
RESULTS
Participant Enrollment and Selection
Across 8 study sites, 2145 children were enrolled on a rolling basis between November 2009 and February 2012 and longitudinally followed. Of these, stool samples with a complete microbiology workup were available for 1695 children. Finally, 1684 children who underwent a minimum of 90% of the active surveillance assessments between 0 and 6 months and whose parents or legal guardians had answered an SES questionnaire during this time were included in the final analysis. The 1684 children provided 8216 surveillance stools
up to 6 months of age. The groups of children and details of the stools provided for analysis are shown in Table 1.
Association of Potential Risk Determinants
With Subclinical Enteroaggregative
Escherichia
coli
Infection Alone or in Combination With
Other Pathogens
Table 1 summarizes the categorical risk variables associated with subclinical EAEC infections through the first 6 months of age. There were no differences in sex or age between the groups tested.
The proportions of children with birth weights<2500 g were also
similar among all groups. Mothers with<6 years of schooling and
no suitable drinking water sources were significantly more common
for children with subclinical EAEC infections with 3 other
pathogens compared to all other groups of children. Both
subclini-cal infections with EAEC plus3 other pathogens and3
patho-gens without EAEC were significantly more common in children with inadequate sanitation compared to the other pathogen groups. Food insecurity was present in a smaller proportion in the group of children with subclinical EAEC infection alone compared to no pathogens. Children with subclinical EAEC infection with only 1 other pathogen had less food insecurity compared to EAEC with 2 other pathogens. Table 2 shows the quantitative risk variables associated with subclinical EAEC infections through the first 6 months of age. Birth weights, mothers’ years of schooling, and monthly incomes were similar across all groups of children. The
SES measured via the asset score was lower in the group with
EAEC combined with3 other pathogens compared to the scores
for all other groups of children. The SES was also lower in the group with EAEC combined with 1 or 2 other pathogens compared to those in the following groups: no pathogen, EAEC alone, and 1 or 2 pathogens without EAEC. Finally, the SES was lower in the group with3 pathogens without EAEC than in the nonpathogens group. A similar significant trend was also observed for SES measured via the water/sanitation, household assets, maternal education, and household income as shown in Table 2. The proportion of days of antibiotic use was significantly higher in the group of children
with EAEC subclinical infection with3 other pathogens than in all
other groups. The proportion of breast-feeding days was
signifi-cantly lower in the group with EAEC subclinical infections with3
other pathogens compared to those in all other groups except for3
pathogens without EAEC. The proportion of breast-feeding days was also lower in the group with EAEC combined with 2 other pathogens compared to that in the nonpathogen group.
Gut Function Barrier Integrity, and Immune
and Inflammatory Biomarkers
Gut function as measured by the adjusted z scores of the
percentages of lactulose and mannitol excreted in the urine and lactulose:mannitol ratios were similar across all groups of children (Table 3). Stool MPO concentrations were significantly higher in the
subclinical EAEC infection with3 other pathogens group than that
in the nonpathogen group. MPO concentration was also higher in children with EAEC with 2 other pathogens than in the nonpathogen group. Lower concentrations of stool neopterin were found in the
groups of children with subclinical EAEC infection with3 other
pathogens compared to all other groups of children, except 3
pathogens without EAEC; children with EAEC with 2 other patho-gens (vs no pathopatho-gens and vs 1 or 2 pathopatho-gens without EAEC);
children with3 pathogens without EAEC (vs no pathogens and vs 1
Effect of Subclinical Enteroaggregative
Escherichia coli
Infections Alone or Combined
With Any Other Pathogen on Cumulative Child
Growth
Cumulative growth was measured up to 6 months of age. Table 4 and Supplementary Figure 1 (Supplemental Digital Content
2, http://links.lww.com/MPG/B93) summarize the delta z scores
WLZ, WAZ, and LAZ. Children with EAEC with 3 other
pathogens showed an impaired delta WLZ z score compared to
all other groups, except for EAEC with 2 other pathogens. The delta
WAZzscore was also significantly lower in the EAEC with3
other pathogens group compared to all other groups, except for EAEC with 2 other pathogens and nonpathogens (borderline;
P¼0.056).
TABLE 1. Determinant categorical variables associated with enteroaggregativeEscherichia colicarriage over 0 to 6 months of age
Groups of children
Determinant variables
No
pathogens EAEC_P0 EAEC_P1 EAEC_P2 EAEC_P3
1 or 2 Pathogens without EAEC
3 Pathogens without EAEC
Number of children
Total 1684
171 198 321 292 363 266 73
Surveillance stools contributed
Total 8216
708 923 1584 1459 1915 1277 350
Sex Male Count
%
82a 94a 169a 162a 176a 142a 33a
48.0% 47.5% 52.6% 55.5% 48.5% 53.4% 45.2%
Total Count
%
171 198 321 292 363 266 73
100.0% 100.0% 100.0% 100.0% 100.0% 100.0% 100.0%
Birth weight <2500 g
yes Count
%
15a 20a 36a 26a 21a 23a 6a
9.1% 11.2% 12.8% 10.7% 9.7% 9.4% 9,7%
Total Count
%
165 179 281 243 216 245 62
100.0% 100.0% 100.0% 100.0% 100.0% 100.0% 100.0%
Suitable source of drinking water
no Count
%
7a 15a.b. c. d 30c. d 30b. d 73e 15a. b. c. d 4a, b, c, d
4.3% 8.1% 9.8% 10.6% 20.7% 6.1% 5,6%
Total Count
%
161 186 306 282 352 246 71
100.0% 100.0% 100.0% 100.0% 100.0% 100.0% 100.0%
Suitable sanitation
no Count
%
43a 50a 84a 93a 147b 74a 21a, b
26.7% 26.9% 27.5% 33.0% 41.8% 30.0% 29,6%
Total Count
%
161 186 306 282 352 247 71
100.0% 100.0% 100.0% 100.0% 100.0% 100.0% 100.0%
Mother with <6 years of schooling
yes Count
%
34a 56a. b 108b. c. d 111d 185e 69a. b 32c, d, e
21.1% 30.1% 35.4% 39.5% 52.6% 27.9% 45,1%
Total Count
%
161 186 305 281 352 247 71
100.0% 100.0% 100.0% 100.0% 100.0% 100.0% 100.0%
Food Insecurity
yes Count
%
76b. c 66a 122a. b 135c 155a. b. c 127c 34b, c
49.7% 37.5% 41.4% 49.6% 45.5% 53.4% 52,3%
Total Count
%
153 176 295 272 341 238 65
100.0% 100.0% 100.0% 100.0% 100.0% 100.0% 100.0%
Each subscript letter denotes a subset of groups of children categories whose column proportions do not differ significantly from each other at the 0.05 level (Chi-square tests).
EAEC¼enteroaggregativeEscherichia coli.
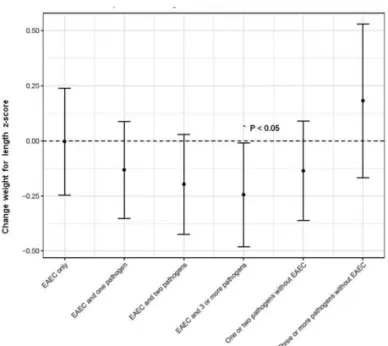
The regression results of the association between EAEC exposure, in the absence of other pathogens, with growth over the first 6 months of life were not statistically significant (Fig. 1). However, when EAEC was associated with coinfection with 1, 2, or 3 additional pathogens, decreased delta WLZ and WAZ were observed (Fig. 1). When EAEC was associated with coinfection
with 3 or more additional pathogens, WLZ was0.244z scores
lower than that in children with no pathogens present (P<0.05,
Fig. 1). This association was not maintained when 3 or more pathogens were present in the absence of EAEC (Fig. 1).
Prevalence of Subclinical Enteric Coinfections
With Enteroaggregative
Escherichia coli
Across the cohort’s study sites, we observed that the groups
of children with subclinical EAEC infection with 2 or3 other
TABLE 2. Determinant quantitative variables associated with enteroaggregativeEscherichia colicarriage over 0 to 6 months of age
Groups of children
Determinant variables
No
pathogens EAEC_P0 EAEC_P1 EAEC_P2 EAEC_P3
1 or 2 Pathogens without EAEC
3 Pathogens without EAEC
Birth weight, kg
Median 3.05 3.00 3.00 3.05 3.00 3.09 3.00
Minimum 1.90 1.80 1.69 1.78 1.80 1.90 2.25
Maximum 4.90 4.10 4.27 4.50 4.60 4.75 4.00
Mother schooling, y
Median 9 8 7 7 5 8 6
Minimum 0 0 0 0 0 0 0
Maximum 17 18 16 15 15 17 13
Income (US$/month)
Median 115.00 117.50 113.05 104.55 103.50 136.50 123.70
Minimum 3.0 1.2 2.4 3.6 1.8 6.0 7.0
Maximum 966.7 625.2 1056.0 924.0 994.0 1648.4 812.0
Asset
Median 6.00 5.00 4.00§ 4.00 3.00 5.00 4.00y
Minimum 0 0 0 0 0 0 0
Maximum 8 8 8 8 8 8 8
WAMI
Median 0.625 0.617 0.563§ 0.547 0.438 0.609 0.563
Minimum 0.031 0.063 0.000 0.000 0.000 0.000 0.031
Maximum 0.953 1.000 0.984 0.953 0.953 1.000 0.953
Percentage of days with acute lower respiratory infections
Median 1.1 0.0 2.2 0.0 0.0 2.2 0.0
Minimum 0.0 0.0 0.0 0.0 0.0 0.0 0.0
Maximum 6.6 9.2 7.6 5.9 7.7 7.0 9.2
Percentage of days using antibiotics
Median 2.7 2.7 3.8 2.9 6.0 2.7 2.7
Minimum 0.0 0.0 0.0 0.0 0.0 0.0 0.0
Maximum 42.4 47.3 52.5 75.1 61.1 53.8 50.0
Percentage of days with breast-feeding
Median 98.8 98.4 98.4 98.3 96.8 98.4 97.8
Minimum 58.1 0.0 0.0 0.0 0.0 0.0 44.9
Maximum 100.0 100.0 100.0 100.0 100.0 100.0 100.0
Percentage of days with dehydration
Median 6.8 9.2 4.4 3.0 7.1 9.2 4.9
Minimum 2.2 2.8 1.1 0.5 0.5 1.1 0.5
Maximum 11.4 24.5 63.6 23.6 40.8 38.0 20.2
Percentage of days with diarrhea
Median 0.6 0.6 1.1 1.1 1.6 1.6 1.7
Minimum 0.0 0.0 0.0 0.0 0.0 0.0 0.0
Maximum 89.7 53.3 67.4 43.7 49.2 54.9 37.3
Percentage of days with fever
Median 0.0 0.0 0.0 0.0 0.0 0.0 0.0
Minimum 0.0 0.0 0.0 0.0 0.0 0.0 0.0
Maximum 8.7 18.4 47.8 5.0 18.9 20.6 12.6
Asset (sum of 8 scores; has mattress, chair, table, TV, refrigerator, bank account, kitchen,<2 people per room) pairwise comparisons by independent-samples Kruskal-Wallis test.
EAEC¼enteroaggregativeEscherichia coli.
EAEC_P3 versus all other groups (P<0.05).
EAEC_P2 versus nonpathogens, EAEC_P0 and 1 or 2 pathogens without EAEC (P<0.05).
§
EAEC_P1 versus nonpathogens, 1 or 2 pathogens without EAEC (P<0.05).
y3 pathogens without EAEC versus nonpathogens (P<0.05).
WAMI (Sum of the following variables: sanitation, asset, incat, newfseschool, and dividing the total by 32):EAEC_P3 versus all other groups except3 pathogens without EAEC (P<0.05);EAEC_P2 versus nonpathogens and 1 or 2 pathogens without EAEC (P<0.05);§EAEC_P1 versus nonpathogens (P<0.05).
Percentage of days using antibiotics:EAEC_P3 versus all other groups except3 pathogens without EAEC (P<0.05).
Percentage of days with breast-feeding:EAEC_P3 versus all other groups except3 pathogens without EAEC (P<0.05); EAEC_P2 versus nonpathogens (P<0.05).
pathogens were strongly associated with impaired physical growth,
as measured by WLZ and WAZ delta z scores. Therefore, we
explored the prevalence of subclinical enteric coinfections with EAEC in these 2 groups of children. Figure 2A shows that the
highest prevalence of enteric coinfection involvedCampylobacter
spp and atypical enteropathogenicEscherichia coliin children with
EAEC and 2 pathogens.Campylobacterspp, enterotoxigenicE coli
thermo-labile toxinproducing, andCryptosporidiumspp were the
most prevalent coinfection pathogens in children with EAEC with 3 other pathogens. Figure 2B shows only the enteric pathogens
with>1% of the cumulative prevalence up to 6 months of age.
DISCUSSION
In nondiarrheal stool samples, subclinical EAEC infection alone was not significantly associated with child growth between enrollment and 6 months of age. However, increasing pathogen codetection with EAEC was negatively associated with decreased delta WAZ and WLZ from 0 to 6 months. Compared to children with no pathogens detected, the mean delta WLZ was approxi-mately 0.25 lower in children with EAEC and 3 or more pathogens
(P<0.05) and the mean delta WAZ was approximately 0.16 lower
in children with EAEC and 3 or more pathogens (P>0.05). There
was no clear trend in the correlation between EAEC exposure and LAZ with or without pathogen codetection. However, early cohort studies reported an association between EAEC subclinical infection and child growth impairment (The MAL-ED contributors. Factors affecting growth velocity and risk factors for stunting in the first 24 months of life: results from the MAL-ED study. MAL-ED major
paper in preparation to submit soon). A previous analysis of EAEC in the MAL-ED study showed that consistent detection of EAEC across the first 2 years of life was associated with linear growth deficits at 2 years of age (28). This previous work, however, did not explore coinfection. In addition, increasing pathogen EAEC code-tection was negatively associated with WLZ and WAZ in the present study. This effect was not observed in other pathogen coinfections in the absence of EAEC. These results suggest a pathobiological interaction between EAEC and other pathogens, resulting in growth impairment at a critical stage of early develop-ment. A recent study using microbiota from a Malawian birth cohort in an undernourished donor community administered to recipient gnotobiotic mice produced a growth deficit compared to that from a healthy donor community (29). These data suggest the hypothesis that gut microbiota immaturity together with enteric copathogens including EAEC may impact growth development or have other long-term consequences, a possibility that warrants further study. Few studies have evaluated isolated EAEC subclinical infec-tion with determinant variables; several have reported an associa-tion between inadequate or contaminated food and water and EAEC infection without examining pathogen codetection (30–32). Com-parable associations between EAEC infection and poor hygiene and host immunosuppression have been reported (33). Therefore, we limited the focus of this work to the variables associated with EAEC coinfections in the current literature.
Consistent with recent publications from the MAL-ED birth cohort and BRF site case-control MAL-ED studies, EAEC alone and all the other groups of children presented with high urine LM-Z ratio and fecal MPO, A1AT, and NEO biomarker levels, suggesting TABLE 3. Biomarkers associated with no pathogens or with enteroaggregativeEscherichia colicarriage and coinfections with other enteric pathogens
Groups of children
Biomarkers Nonpathogens EAEC_P0 EAEC_P1 EAEC_P2 EAEC_P3
1 or 2 Pathogens without EAEC
3 Pathogens without EAEC
Zscore % lactulose
Median 0.9343 0.8767 0.9832 0.7951 0.8696 0.9417 1.0582 Minimum 1.9429 2.0421 2.1568 3.2737 4.5702 2.2246 2.3525 Maximum 7.1715 4.9319 6.4300 7.9253 6.4066 5.3051 3.9377
Zscore %mannitol
Median 0.4036 0.4575 0.3923 0.3852 0.3478 0.4771 0.4711 Minimum 1.4403 2.1661 1.9402 2.6062 2.1725 1.8277 1.9379 Maximum 2.6551 3.1492 2.6375 3.9473 3.9912 2.4371 2.4148
Zscore lactulose/mannitol ratio
Median 0.2370 0.2509 0.3106 0.2235 0.3003 0.2099 0.1884 Minimum 1.6894 6.9774 2.3467 6.1037 2.9995 2.9296 2.4921 Maximum 2.2237 2.4843 1.9751 2.8774 2.1294 1.8635 1.8433 Myeloperoxidase, ng/mL
Median 5877.25 7447.02 7446.47 8290.56 9039.79 7480.78 8375.42 Minimum 634.99 167.88 1045.33 452.45 257.86 349.00 660.42 Maximum 44025.94 73561.05 66145.51 58975.13 46209.77 49072.82 28763.12 Neopterin, nmol/L
Median 2298.41 2229.06 2045.85 1760.84 1300.00 2176.95 1578.38§
Minimum 120.86 38.95 152.29 137.87 46.81 68.61 109.31 Maximum 12875.92 12123.592 12222.55 9938.28 26732.90 17846.67 9375.92 Alpha-1-antitrypsin, mg/g
Median 0.422 0.405 0.400 0.398 0.366 0.407 0.475
Minimum 0.040 0.048 0.070 0.035 0.020 0.055 0.084
Maximum 1.629 2.028 2.773 1.970 2.599 2.590 2.008
%Lactulose, %mannitol, and lactulose:mannitol ratiozscores assigned average over 3 and 6 months values to age cumulative interval 0 to 6 months. Myeloperoxidase, neopterin, and alpha-1-antitrypsin assigned average values over the cumulative interval 0 to 6 months.
Myeloperoxidase pairwise comparisons by independent-samples Kruskal-Wallis test:EAEC_P3 versus nonpathogens (P<0.05);EAEC_P2 versus nonpathogens (P<0.05).
Neopterin pairwise comparisons by independent-samples Kruskal-Wallis test:EAEC_P3 versus all other groups except3 pathogens without EAEC (P<0.05);EAEC_P2 versus nonpathogens and 1 or 2 pathogens without EAEC (P<0.05);§
environmental enteropathy disease (26,34). MPO concentration was significantly higher in children with EAEC and 3 or more pathogens and in children with EAEC with co-detection of 2 other pathogens compared to the concentrations in children in which no pathogens were detected. These results suggest an interaction effect of EAEC with 2 or more pathogens on gut inflammatory responses but not in the absence of EAEC with 2 or more pathogens. Studies have shown colonization of EAEC without overt symptoms of
diarrhea; however, these studies did not evaluate pathogen codetec-tion (6,7). Furthermore, the studies concluded that EAEC was an inflammatory pathogen and that infection resulted in growth deficit even without overt symptoms of diarrhea (6,7). The present report suggests for the first time that early childhood growth deficits are associated with EAEC and coinfections in an asymptomatic cohort of children. The pathobiology of subclinical EAEC infection with pathogen codetection appears to be more complex than previously thought; therefore, further studies are required to examine this in detail. NEO concentration was higher in the nonpathogen group compared to that in EAEC group with 2 or more other pathogens and in the group with 3 or more pathogen codetection without EAEC. These data suggest greater protection in the gut immune responses in the control group compared to the other groups of children.
This study has several limitations. First, despite monthly stool analysis over 6 months, subclinical pathogen codetection could have been missed between stool sample collections. Second, the study group definition and design analyses do not account for the duration of subclinical infections, even though we had a sense of repeated detection and quantitative specific pathogen detection. These are relevant parameters to consider for further studies on the pathobiology and impact of isolated subclinical EAEC and code-tected pathogen infections on physical growth in children. The study also has several strengths. First, the MAL-ED multicenter study collects comprehensive information on determinant variables such as maternal and child care characteristics, sanitation, hygiene, and SES, which enable assessment of the association or influence of the determinant variables on child nutritional status after 6 months of follow-up. Second, the study also collects information on important biomarkers, allowing for examination of key potential pathobiolo-gical association with the subclinical isolated EAEC and coinfec-tions. Third, the MAL-ED study allowed co-infection analysis to examine the potential interaction associations of isolated EAEC and pathogen coinfection with child growth.
In conclusion, silent (ie, acutely asymptomatic) enteric coin-fections with EAEC and other pathogens in the first 6 months of life were associated with significant growth deficits (decreasing delta
WLZ z score). Further study of the potential associations and
mechanisms of infection with EAEC alone and coinfection with other potential pathogens is warranted, and potential strategies to prevent growth deficit or other long-term consequences are required.
FIGURE 1. Changes in weight-for-length (WLZ)zscores from 0 to
6 months of age (delta WLZ0–6 m) by EAEC with or without copathogens when compared with the delta WLZ0–6 min children with no enteric pathogen detected over 0 to 6 months of age. Coefficients refer to the number of standard deviations a dependent variable (children with no pathogen group) will change, per standard deviation increase in the predictor variable (all other groups of children, see figure). This figure shows the beta coefficient estimate for delta WLZ. Note that when EAEC is present with 1, 2, or 3 additional pathogens, there is a progressive decrease in the delta WLZ. This relationship is not maintained when 3 or more pathogens are present in the absence of EAEC.
FIGURE 2. Prevalence of specific pathogens in children with enteroaggregativeEscherichia coli(EAEC) with 2 (A) and 3 or more (B) pathogen
coinfections, respectively, in monthly stool samples in the first 6 months of life. aEPEC ¼ atypical enteropathogenic E coli; EAEC ¼
enteroaggregativeEscherichia coli; EIEC¼ enteroinvasiveE coli; tEPEC¼ typical enteropathogenicE coli; LT/ST-ETEC¼LT/ST-producing
Acknowledgments:The Etiology, Risk Factors, and Interactions of Enteric Infections and Malnutrition and the Consequences for Child Health and Development Project (MAL-ED) is carried out as a collaborative project supported by the Bill & Melinda Gates Foundation, the Foundation for the NIH, and the National Institutes of Health/Fogarty International Center. The authors thank the staff and participants of the MAL-ED Network for their important contributions.
REFERENCES
1. Nataro JP, Kaper JB. DiarrheagenicEscherichia coli.Clin Microbiol Rev1998;11:142–201.
2. Arenas-Herna´ndez MM, Martı´nez-Laguna Y, Torres AG. Clinical im-plications of enteroadherentEscherichia coli.Curr Gastroenterol Rep
2012;14:386–94.
3. Croxen MA, Law RJ, Scholz R, et al. Recent advances in understanding enteric pathogenicEscherichia coli.Clin Microbiol Rev2013;26:822– 80.
4. Platts-Mills JA, Babji S, Bodhidatta L, et al. Pathogen-specific burdens of community diarrhoea in developing countries: a multisite birth cohort study (MAL-ED).Lancet Glob Health2015;3:e564–75.
5. Lima AA, Moore SR, Barboza MS Jr et al. Persistent diarrhea signals a critical period of increased diarrhea burdens and nutritional shortfalls: a prospective cohort study among children in northeastern Brazil.J Infect Dis2000;181:1643–51.
6. Steiner TS, Lima AA, Nataro JP, et al. EnteroaggregativeEscherichia coliproduce intestinal inflammation and growth impairment and cause interleukin-8 release from intestinal epithelial cells. J Infect Dis
1998;177:88–96.
7. Greenberg DE, Jiang ZD, Steffen R, et al. Markers of inflammation in bacterial diarrhea among travelers, with a focus on enteroaggregative
Escherichia colipathogenicity.J Infect Dis2002;185:944–9.
8. Ahmed T, Mahfuz M, Islam MM, et al. The MAL-ED cohort study in Mirpur, Bangladesh.Clin Infect Dis2014;59(suppl 4):S280–6.
9. John SM, Thomas RJ, Kaki S, et al. Establishment of the MAL-ED birth cohort study site in Vellore, southern India. Clin Infect Dis
2014;59(suppl 4):S295–9.
10. Shrestha PS, Shrestha SK, Bodhidatta L, et al. Bhaktapur, Nepal: the MALED birth cohort study in Nepal.Clin Infect Dis2014;59(suppl 4):S300–3.
11. Turab A, Soofi SB, Ahmed I, et al. Demographic, socioeconomic, and health characteristics of the MAL-ED network study site in rural Pakistan.Clin Infect Dis2014;59(suppl 4):S304–9.
12. Bessong P, Nyathi E, Mahopo C, et al. Development of the Dzimauli community in Vhembe district, Limpopo province of South Africa for the MAL-ED cohort study. Clin Infect Dis 2014;59(suppl 4): S317– 24.
13. Mduma ER, Gratz J, Patil C, et al. The etiology, risk factors and interactions of enteric infections and malnutrition and the Consequences for Child Health and Development Study (MAL-ED): description of the Tanzanian site.Clin Infect Dis2014;59(suppl 4):S325–30.
14. Lima A, Oria´ RB, Soares AM, et al. Geography, population, demo-graphy, socioeconomic, anthropometry, and environmental status in the MAL-ED cohort and case-control study sites in Fortaleza, Ceara´, Brazil.
Clin Infect Dis2014;59(suppl 4):S287–94.
15. Yori PP, Lee G, Olo´rtegui MP, et al. Santa clara de nanay: the MAL-ED cohort in Peru.Clin Infect Dis2014;59(suppl 4):S310–6.
16. Richard SA, Barrett L, Guerrant RL, et al. Disease surveillance methods used in the 8-site MAL-ED cohort study.Clin Infect Dis2014;59(suppl 4):S220–4.
17. Hoest C, Seidman JC, Pan W, et al. Evaluating associations between vaccine response and malnutrition, gut function, and enteric infections in the MAL-ED cohort study: methods and challenges.Clin Infect Dis
2014;59(suppl 4):S273–9.
18. Richard SA, McCormick BJ, Miller M, et al. Modeling environmental influences on child growth in the MAL-ED cohort study: opportunities and challenges.Clin Infect Dis2014;59(suppl 4):S255–60.
19. Caulfield LE, Bose A, Chandyo RK, et al. Infant feeding practices, dietary adequacy, and micronutrient status measures in the MAL-ED cohort study.Clin Infect Dis2014;59(suppl 4):S248–54.
20. Houpt E, Gratz J, Kosek M, et al. Microbiologic methods utilized in the MAL-ED cohort study. Clin Infect Dis 2014;59(suppl 4): S225–32.
21. Platts-Mills JA, McCormick BJJ, Kosek M, et al. Methods of analysis of enteropathogen infection in the MAL-ED cohort study.Clin Infect Dis
2014;59(suppl 4):S233–8.
22. Kosek M, Guerrant RL, Kang G, et al. Assessment of environmental enteropathy in the MAL-ED cohort study: theoretical and analytic framework.Clin Infect Dis2014;59(suppl 4):S239–47.
23. Murray-Kolb LE, Rasmussen ZA, Scharf RJ, et al. The MAL-ED cohort study: methods and lessons learned when assessing early child development and caregiving mediators in infants and young children in 8 low- and middle-income countries.Clin Infect Dis2014;59(suppl 4): S261–72.
24. Psaki SR, Seidman JC, Miller M, et al. Measuring socioeconomic status in multicountry studies: results from the eight-country MAL-ED study.
Popul Health Metr2014;12:8. TABLE 4. Nutritional impact of enteroaggregativeEscherichia colicarriage or coinfections with enteric pathogens
Groups of children
Cumulative nutritional
parameters Nonpathogens EAEC_P0 EAEC_P1 EAEC_P2 EAEC_P3
1 or 2 Pathogens without EAEC
3 Pathogens without EAEC
Delta_WLZ
Median 0.660 0.815 0.785 0.360 0.250 0.700 0.940
Minimum 4.42 2.94 4.70 3.16 6.29 3.29 2.98
Maximum 4.37 5.37 5.30 7.15 5.54 4.42 4.42
Delta_WAZ
Median 0.320 0.310 0.280 0.035 0.045 0.350 0.480
Minimum 2.90 3.14 3.11 2.20 4.08 2.81 3.59
Maximum 3.62 3.45 6.08 4.83 5.62 5.09 4.14
Delta_LAZ
Median 0.220 0.100 0.080 0.105 0.160 0.015 0.190
Minimum 2.74 2.75 2.88 3.23 3.04 2.42 2.11
Maximum 4.32 5.29 3.18 3.14 3.50 4.76 2.93
Cumulativezscores (0–6 months follow-up) for weight-for-height (WHZ), weight-for-age (WAZ), and length-for-age (LAZ).
WLZ pairwise comparisons by independent-samples Kruskal-Wallis test:EAEC_P3 versus all other groups except EAEC_P2 (P<0.05).
25. World Health Organization Multicentre Growth Reference Study Group. WHO child growth standards based on length/height, weight and age.Acta Paediatr Suppl2006;450:76–85.
26. Kosek M, Haque R, Lima A, et al. Fecal markers of intestinal inflam-mation and permeability associated with the subsequent acquisition of linear growth deficits in infants.Am J Trop Med Hyg2013;88:390–6.
27. MAL-ED, Network Investigators. The MAL-ED study: a multinational and multidisciplinary approach to understand the relationship between enteric pathogens, malnutrition, gut physiology, physical growth, cogni-tive development, and immune responses in infants and children up to 2 years of age in resource-poor environments. Clin Infect Dis
2014;59(suppl 4):S193–6.
28. Rogawski ET, Guerrant RL, Havt A, et al. Epidemiology of enteroag-gregative Escherichia coli infections and associated outcomes in the MAL-ED birth cohort.PLoS Negl Trop Dis2017;11:e0005798.
29. Blanton LV, Charbonneau MR, Salih T, et al. Gut bacteria that prevent growth impairments transmitted by microbiota from malnourished children.Science2016;351:pii: aad3311.
30. Akter S, Islam M, Afreen KS, et al. Prevalence and distribu-tion of different diarrhoeagenic Escherichia coli virulotypes in major water bodies in Bangladesh. Epidemiol Infect 2013;141: 2516– 25.
31. Kagambe`ga A, Martikainen O, Lienemann T, et al. Diarrheagenic
Escherichia coli detected by 16-plex PCR in raw meat and beef intestines sold at local markets in Ouagadougou, Burkina Faso.Int J Food Microbiol2012;153:154–8.
32. Morais TB, Gomes TA, Sigulem DM. EnteroaggregativeEscherichia coliin infant feeding bottles.Lancet1997;349:1448–9.
33. Estrada-Garcia T, Navarro-Garcia F. EnteroaggregativeEscherichia coli
pathotype: a genetically heterogeneous emerging foodborne entero-pathogen.FEMS Immunol Med Microbiol2012;66:281–98.
34. Lima AAM, Leite A´ M, Di Moura A, et al. Determinant variables, enteric pathogen burden, gut function, and immune-related inflamma-tory biomarkers associated with childhood malnutrition: a prospective case-control study in Northeastern Brazil. Pediatr Infect Dis J