3D VISUALIZATION OF VOLCANIC ASH DISPERSION PREDICTION WITH SPATIAL
INFORMATION OPEN PLATFORM IN KOREA
1J. Youn a,, T. Kim a
a ICT Convergence and Integration Research Institute, Korean Institute of Civil Engineering and Building Technology, Korea – (younj, kth)@kict.re.kr
Commission VIII, WG VIII/1
KEY WORDS: Visualization, Volcanic ash, Disaster prediction, Spatial information, Open platform
ABSTRACT:
Visualization of disaster dispersion prediction enables decision makers and civilian to prepare disaster and to reduce the damage by showing the realistic simulation results. With advances of GIS technology and the theory of volcanic disaster prediction algorithm, the predicted disaster dispersions are displayed in spatial information. However, most of volcanic ash dispersion predictions are displayed in 2D. 2D visualization has a limitation to understand the realistic dispersion prediction since its height could be presented only by colour. Especially for volcanic ash, 3D visualization of dispersion prediction is essential since it could bring out big aircraft accident. In this paper, we deals with 3D visualization techniques of volcanic ash dispersion prediction with spatial information open platform in Korea. First, time-series volcanic ash 3D position and concentrations are calculated with WRF (Weather Research and Forecasting) model and Modified Fall3D algorithm. For 3D visualization, we propose three techniques; those are ‘Cube in the air’, ‘Cube in the cube’, and ‘Semi-transparent plane in the air’ methods. In the ‘Cube in the Air’, which locates the semitransparent cubes having different color depends on its particle concentration. Big cube is not realistic when it is zoomed. Therefore, cube is divided into small cube with Octree algorithm. That is ‘Cube in the Cube’ algorithm. For more realistic visualization, we apply ‘Semi-transparent Volcanic Ash Plane’ which shows the ash as fog. The results are displayed in the ‘V-world’ which is a spatial information open platform implemented by Korean government. Proposed techniques were adopted in Volcanic Disaster Response System implemented by Korean Ministry of Public Safety and Security.
1 This paper is an enriched and revised version of a paper presented at the Journal of the Korean Society for Geospatial Information System Vol 24 (in print)
1. INTRODUCTION
Korea has been classified as a region safe from volcanic disasters. However, recent studies and observations show that the Korean peninsula is no longer exempt from these types of disasters. Mt. Baekdu has not erupted since a major eruption in the 10th century, and has therefore been classified as dormant. Its status, however, has changed and 10 to 15 earthquakes have been observed every month since the year 2002, resulting in vigorous tectonic activity. Analyses of the seismic waves indicate a huge chamber of magma under Mt. Baekdu (Kim and Youn, 2014). As a result, experts redefined the mountain as an active volcano following the 1996 International Geological Congress (Jiang et al. 2013). A volcanic eruption of the same magnitude as the 10th century event is expected to cause large-scale political chaos and economic damage. The Republic of Korea government also recognizes the threat as serious and have therefore developed an IT-based system capable of predicting and responding to the damage from a volcanic disaster, through a research assignment on ‘the development of volcanic disaster response system’ since 2012, under the direction of the Ministry of Public Safety and Security.
Considering the various volcanic hazards if the mountain erupts, the Republic of Korea is expected to suffer most damage as a result of volcanic ash dispersion. The expected impacts of the volcanic eruption include volcanic ash, volcanic mudflows,
volcanic floods, and pyroclastic flows. If Mt. Baekdu erupts, all hazards except volcanic ash are expected to affect North Korea and adjacent Chinese territories, while the Republic of Korea will be mostly impacted by the volcanic ash. Expected consequences of the volcanic ash include loss of human life and damage to buildings, roads, construction, railroads, aircraft, electricity, water, agriculture, forests, fisheries, and much more. Jiang et al. (2013) quantitatively categorized the types of damage by distinguishing cases into ones with rainfall and ones without rainfall. According to the results of the study, when transportation systems such as air, road, and rail are disabled, travel to disaster areas will become difficult, leading to paralyzed domestic and international logistics systems. Due to a crippled logistics system, business activities based on logistics for the supply of raw materials and products will also be paralyzed. Since the dependence on exports is very high in the Republic of Korea, exports by air, which constitute approximately 25 % of all exports, are at risk of being severely affected (Jiang et al., 2013). The first cause of disabled aircraft operation would be visual impairment due to the volcanic ash. More severe issues exist with paralysis of aircraft consoles by the ash, and failure of engines due to silica contained within the volcanic ash, potentially leading to a large-scale aviation accident. Therefore, visualizing the potential volcanic ash dispersion in case of an eruption is essential to ensure an appropriate response. In particular, for the safety of aircrafts, the 3D-based aircraft passage can be compared with the The International Archives of the Photogrammetry, Remote Sensing and Spatial Information Sciences, Volume XLI-B8, 2016
visualized result of 3D volcanic ash dispersion prediction, in order to determine whether to suspend or approve flight plans. There have been studies conducted by Scani and Folsh (2013), Gűnther et al., (2015), and more, analyzing the impacts on air transportation by visualizing the dispersion of volcanic ash.
Efforts to visualize the dispersion of volcanic ash include research on the location and concentration of ash from a volcano that is already erupting, using satellite images to image the ash in three dimensions. Simmon (2011) merged the data of CALIPSO (Cloud-Aerosol Lidar and Infrared Pathfinder Satellite Observation) and the MODIS satellite in a trial visualization of the volcanic ash from the eruption of Eyjafjallajokull, Iceland, in 2010. In this research, the author obtained the three-dimensional location of volcanic ash using the CALIPSO satellite data, and displayed it by overlapping the data with images from MODIS. The visualization method used by Simmon (2011) is limited to show only the top portion of the volcanic ash clouds, with only the latitudinal/longitudinal two-dimensional location visualized on the satellite images. In order to determine the altitude of the volcanic ash, profile graphs (e.g. Y-axis: altitude, X-axis: longitude) were displayed on another screen. Another study, performed by Maes et al. (2016), attempted to detect and visualize the vertical distribution of volcanic ash from the eruption of Puyehue, Chile, in 2011, using the IASI (Infrared Atmospheric Sounding Interferometer) sensor loaded on the MetOp satellite. This research also had limitations related to the display of three-dimensional data on an actual ground digital elevation model and on an image. Gűnther et al. (2015) used satellite data to visualize data including the concentration, altitude, and extent of the volcanic ash from three volcanic eruptions (Iceland, Chile, Eritrea), which occurred within 3 weeks between May and June 2011. In this study, colors corresponding to volcanic ash concentration and extent were marked differently on a three-dimensional space for subsequent analysis of the impact on air transportation.
Apart from the aforementioned studies on the visualization of erupted volcanic ash, previous work has also focused on the prediction and three-dimensional visualization of volcanic ash that has yet to erupt. Park and Choi (2013) proposed the FLEXPART dispersion model for Mt. Baekdu volcano, while Kim et al. (2013) used a Fall3D model to three-dimensionally visualize the dispersion of volcanic ash in a certain time period. These two methods have disadvantages in that the calculation takes too much time due to the number of particles increasing exponentially, since the domain displaying the concentration of volcanic ash particles is dynamically fragmented (MPSS, 2015). To overcome this issue, Kim et al. (2015) latticized the space and designated the central point value of the lattice for the three-dimensional visualization.
In this study, we use Fall3D to predict the values (concentration and location) of volcanic ash dispersion and visualize the results in three dimensions. There is more than one method for visualizing a scientific phenomenon. The visualization of many scientific programs is suitable specifically for those who analyze data, and is not readily understood by the public (Simmon, 2011). Therefore, various methods for visualization are necessary, in order that non-experts understand the data more intuitively. The method proposed in this research is based on, and similar to, the suggestion of Gűnther et al. (2015), wherein different colors are used to represent different levels of volcanic ash concentration and displayed on a three-dimensional spatial frame. The differences between the two methods are, firstly, the data used for visualization in this study were obtained from a
volcano yet to erupt (Mt. Baekdu) using Fall3D, and not were not based on satellite data from an actual past volcanic eruption and secondly, unlike the visualization of global-scale volcanic ash dispersion conducted by Gűnther et al. (2015), this research deals with the visualization of local volcanic ash dispersion prediction for the Korean Peninsula. This paper consists of the following: an introduction on the acquisition of prediction data of volcanic ash and a comparison of three methods for visualizing the prediction result of volcanic ash. The methods are defined as ‘cube in the air’, ‘cube in the cube’, and ‘semi-transparent volcanic ash plane’.
2. 3D VISUALIZATION OF VOLCANIC ASH 2.1 3D Geographical Background
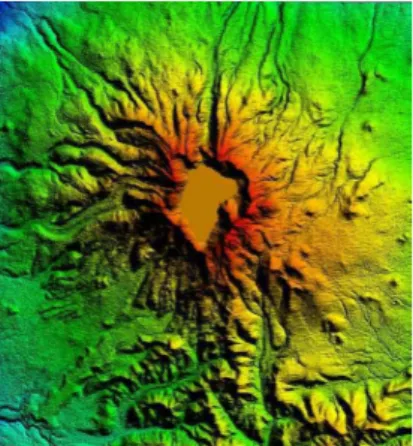
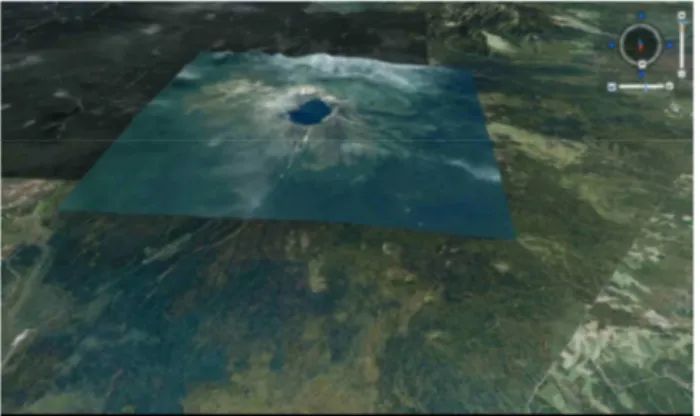
For the volcanic ash to be visualized in the 3D space, a 3D geographical background is required. The original geographic data used in this research are CGIAR-SCI SRTM world geographic altitude data (approximately 90 m resolution) and a Landsat satellite image (approximately 1 m resolution) of Mt. Baekdu volcano. The 3D data of other areas were provided by the V-world, an open spatial information platform, operated by the Ministry of Land, Infrastructure, and Transport. The open spatial information platform provides a wide range of digital elevation models, three-dimensional building data, imagery maps, and administration border data (Kim et al., 2014). In this research, digital elevation models, imagery maps, and administration borders are used. By utilizing the original topography altitude data, a height value hierarchy is comprised and a hillshade map is created using the height value of each topography mesh. Moreover, by overlapping the satellite image on the hierarchical topography data in accordance with the coordinate system, the areas around Mt. Baekdu can be visualized. Since entire memory loading of such massive topography is impossible, the analyzed visualization technique is used to hierarchize the data into a pyramid-type class. With the 3D rendering method, the rendering detail of each topography mesh, which can be easily viewed by the user, is adjusted to enable a scanning rate of more than 60 frames, thereby optimizing the simulation of the 3D visualization. The generated digital elevation model is shown in Figure 1. Figure 2 and 3 show the Mt. Baekdu area digital elevation model draped with satellite image.
Figure 1. Mt. Baekdu area digital elevation model The International Archives of the Photogrammetry, Remote Sensing and Spatial Information Sciences, Volume XLI-B8, 2016
Figure 2. Mt. Baekdu area digital elevation model draped with satellite image-1
Figure 3. Mt. Baekdu area digital elevation model draped with satellite image-2
2.2 Cube in the Air Method
The first method displays the volcanic ash concentration per unit cube. This method is called the ‘cube in the air’ method. According to the result file of Fall3D, total particle concentration, PM10 concentration, and ground deposit thickness are expressed by weight per m3 or m2 unit at a minimum. In order to express the amount of volcanic ash at a specific location, it is difficult to adjust in real time (the adjustment is defined by a real time 3D screen adjustment) due to computer processing time. Moreover, for an immediate prediction in case of a volcanic eruption, the amount of calculations should be lowered. Therefore, it is appropriate to adjust the size to a level capable of real-time adjustment. As a result, the size of the unit cuboid is defined as 9 km wide, 9 km long, and 1.5 km high. Also, when calculating the particle concentration and distribution in Fall3D, only the calculation regarding the central point of the cuboid was performed. As a result, the value of a single cuboid is represented by the value at the central point of the cuboid, which is set by the V-world globe-based WGS84 spherical coordinate system. Each cuboid is expressed with transparency, and after finding maximum and minimum values for particle concentration the values are divided into 10 levels and stored, in order to assign different colors to each level.
Figures 4, 5, and 6 display the total particle concentration, expressed by the ‘cube in the air’ method. The horizontal bar graph displayed in the upper left of the figures show the legend regarding the concentration inside the cuboid. The vertical bar graph displayed in the upper left of the figure is a ruler representing the height. The circle in the upper right shows the bearing, while the menu around the circle is for changing the
user’s point of view using a mouse. Also, in order to distinguish one cuboid from another, a distance of 1 km was allowed between each cuboid. Figures 4 and 5 show the scene viewed from above the dispersion height of volcanic ash. Figure 6 is a scene view from the middle of the volcanic ash dispersion. This method contains a drawback, however, whereby visual expressions regarding the three-dimensional volumes are not well established. In other words, when viewing Figure 6, the cuboids look as if they are afloat in the middle of an air parcel dispersed with volcanic ash, and do not look like the volcanic ash itself.
Figure 4. 3D visualization result with "Cube in the Air" method-1
Figure 5. 3D visualization result with "Cube in the Air" method-2
Figure 6. 3D visualization result with "Cube in the Air" method-3
2.3 Cube in the Cube Method
In order to overcome the shortcomings of the ‘cube in the air’ method, a second method is suggested, whereby the cuboids are divided up according to concentration level. This method is called the ‘cube in the cube’ method. This method aims to maximize the impression of reality by expressing more volcanic ash lattices in areas with high volcanic ash concentration, and less in areas with low volcanic ash concentration. For this, a loose octree algorithm is applied.
The definition of an octree is a data structure for expressing an object in a three-dimensional space. The octree automatically hierarchizes and groups objects, whilst not expressing the empty parts inside the space. First, the octree node is a root cell, which is an arrangement of eight consecutive elements. These elements are capable of then indicating another of the eight consecutive elements. This is continued until reaching a specific maximum number. The final level is the terminal level, and here, a terminal element or voxel is stored. When all elements of all cells indicate the cell below the terminal level, this octree is called the “full octree”. The full octree with ‘n’ levels includes the same number of voxels as the number of regular 3D grids of 2n x 2n x 2n resolution (for example, if the full octree is level 5, it is identical to a 3D grid with 32 x 32 x 32 resolution). However, if the voxel expresses the surface instead of the volume, most of the space is empty, and this will not be expressed inside the octree. In this case, the octree is very economic, and can create a high-resolution voxel space with low memory consumption. Therefore, in order to prevent the object from being stuck in a specific node, the tree space is managed by being overlapped, thereby efficiently utilizing the 3D space.
In this study, the dimension of a single cuboid is defined as 6 km in width and length, and 1 km in height. Total particle concentration is obtained from the central point of each cuboid. The cuboid is exaggerated and expressed as a cube with sides 6 km long for a more realistic expression. As a result, the height in the visualization is exaggerated compared to the actual height so, in order to remove ambiguity, a virtual ruler is installed on the figure. Moreover, 10 concentration levels are used to adjust the number of objects being partitioned. Therefore, a single cube is partitioned into a minimum of 6 partitions (216 small cubes) or a maximum of 64 partitions (262,144 small cubes).
The visualization of volcanic ash particles expressed by applying the octree technique is shown in Figure 9. Similar to the ‘cube in the air’ method, the 10 levels are assigned different colors relating to concentration. In the ‘cube in the air’ method, the bottom surface of the cube only possessed a single height value, whereas in the ‘cube in the cube’ method shown in Figure 9, a pair of apexes between the two most distant apexes is given with the same latitude and longitude, in order to achieve a more realistic result. Consequently, a more accurate and similar visualization was possible by showing the upward movement of the volcanic ash. When comparing Figures 4 - 6 with Figure 9, it is apparent that expressing more particles in a spot with a high volcanic ash concentration and showing the accompanying change in color results in a more realistic visualization.
Figure 7. Applying the Octree Algorithm (data source: MPSS, 2015-1)
Figure 8. Applying the Loose Octree Algorithm (data source: MPSS, 2015-1)
Figure 9. 3D visualization result with "Cube in the Cube" method
2.4 Simi-transparent Volcanic Ash Plane Method
The first and second methods created basic cubes to express volcanic ash dispersion. As shown in Figure 9, the ‘cube in the cube’ method appears realistic, since the volcanic ash is actually visualized. However, this method can overburden the real-time calculation, because all of the small cubes have to be calculated and expressed. Therefore, the third proposed method does not overload the calculation as much and is capable of expressing volcanic ash as a ‘mist’. This method is called the ‘semi-transparent volcanic ash plane’ method.
The ‘semi-transparent volcanic ash plane’ method expresses the volcanic ash by laminating a couple of semi-transparent planes on the volcanic ash visualization space. This semi-transparent plane can be viewed as a planar layer having different height values. A single layer comprises a small lattice 6 km by 6 km. After defining the interval between the lattices of the planar layer, the height of the layer is defined. In this study, the interval was set at 500 m from ground level. When the lattice size and height are defined, the latitude, longitude, and altitude The International Archives of the Photogrammetry, Remote Sensing and Spatial Information Sciences, Volume XLI-B8, 2016
of each lattice of the layer can be obtained. In Fall3D, the total particle concentration is obtained from the centre of each lattice.
After obtaining the total particle concentration of each lattice in the layer, each lattice is marked with different colors. Also, in order to express the volcanic ash as a mist, the transparency was adjusted. In accordance with the characteristics of 3D graphic API, sorting by sight distance is required. Therefore, volcanic ash in a lattice layer of low height is expressed first, and then lattices are expressed in order of increasing height to eventually express the ash particles as a volume. By locating the fabricated planar layers onto the corresponding coordinates, the distribution area of volcanic ash can be expressed in 3D, and using differences in color related to concentration and differences in transparency, the volcanic ash can resemble remote observations of an actual volcanic ash cloud. The first way this method differs from the others is that the volcanic ash does not look like particles but rather a mist. Secondly, the calculation burden for the three-dimensional visualization can be alleviated. The ‘cube in the air’ method has to express each particle one by one, whereas the ‘semi-transparent volcanic ash plane’ method only expresses the layer. Figures 10 - 12 are the result of 3D visualization of volcanic ash dispersion, as predicted by the ‘semi-transparent volcanic ash plane’ method. Figure 10 and 11 show the view from the ground, far from the volcanic ash, whereas Figure 12 shows the view from in the middle of the volcanic ash, approaching the volcanic crater, and clearly shows the resemblance of the volcanic ash to mist.
Figure 10. 3D visualization result with "Semi-transparent Volcanic Ash Plane" method -1
Figure 11. 3D visualization result with "Semi-transparent Volcanic Ash Plane" method-2
Figure 12. 3D visualization result with "Semi-transparent Volcanic Ash Plane" method-3
3. CONCLUSIONS
In this research, three-dimensional visualization methods for predicting the dispersion of volcanic ash were proposed, and, assuming a virtual eruption of Mt. Baekdu, their prediction results were visualized. A digital elevation model of Mt. Baekdu area was utilized with SRTM world topography altitude data and Landsat satellite image data. Spatial information for other areas was provided by the V-world open spatial information platform of the Ministry of Land, Infrastructure, and Transportation. Firstly, an analysis of the NetCDF file, which is the output format of the Fall3D volcanic ash dispersion prediction program, was performed in order to derive the required layers. A total of three techniques were analysed for visualizing the prediction results of volcanic ash. The first is the ‘cube in the air’ technique. This technique defines a virtual cuboid in the midst of air, and calculates the total particle concentration of volcanic ash at the central value of each cuboid. The total particle concentration is marked with different colors according to the concentration level. The second technique is the ‘cube in the cube’ technique. An improvement on the ‘cube in the air’ technique, the volcanic ash can be viewed as particles by dividing up each cube by concentration. The final method is the ‘semi-transparent volcanic ash plane’ technique. This technique locates one large layer in the middle of the air. The lattice or grid of each layer expresses the total particle concentration of volcanic ash, whilst differentiating its transparency according to concentration. In this way, the volcanic ash can be expressed as a mist. It is difficult to define a single best technique for visualizing objects. A decision maker determining whether to confirm or cancel a flight plan by predicting the dispersion of volcanic ash can obtain the necessary information using the ‘cube in the air’ technique. However, when a volcano erupts, the government must construct a response system and keep the public informed of their decisions. In this respect, the ‘cube in the air’ or ‘semi-transparent volcanic ash plane’ techniques might be more effective for relaying the volcanic ash dispersion predictions to the public. Furthermore, in the case where officials need to communicate rapid visualization results, the ‘semi-transparent volcanic ash plane’ would be the best technique, due to the low calculation burden. Therefore, based on the various techniques suggested in this study, predictions of volcanic ash dispersion can be effectively utilized depending on the specific requirements of the user.
ACKNOWLEDGEMENTS
This research was supported by a grant [MPSS-NH-2015-81] through the Natural Hazard Mitigation Research Group funded by Ministry of Public Safety and Security of Korean government
REFERENCES
Gűnther, T., Schulze, M., Friederici, A. and Theisel, H., 2015. 2014 IEEE Scientific Visualization Contest Winner:Visualizing volcanic clouds in the atmosphere and their impact on air traffic, IEEE Computer Graphics and Applications, E-publish ahead of
print,
http://wwwisg.cs.uni-magdeburg.de/visual/files/publications/2015/Guenther_2015_C GA.pdf.
Jiang, J., Yu, S. and Yoon S. and Choi, K., 2013. Damage and socio-economic impact of volcanic ash, Journal of Korean Earth Science Society, Vol. 34, No. 6, pp. 536-549.
Kim, D., Kim, H. and Park, C., 2013. Implementation of the pilot system of damage prediction through the volcanic ash diffusion model for 3D visualization, Proc. of the 3rd International Workshop for Volcanic Disaster Preparedness, pp. 207-210.
Kim, H., Kim, S, and Park, C., 2015. Research of 3D visualization of ash dispersion by Fall3D model, Proc. of the 2015 KSHM Conference, Vol. 14, pp. 40-40.
Kim, J., Yi, S., Kim, J. and Bae, S., 2014. An analysis of vertical position accuracy for the three-dimensional spatial data object utilizing the public information, Journal of the Korean Society for Geospatial Information Science, Vol. 22, No. 4, pp. 137-143.
Kim, T. and Youn, J., 2014. A study on the IT-based response system development for Mt. Baekdu volcanic disaster, Journal of the Korean Association of Geographic Information Studies, Vol. 17, No. 1, pp. 13-23.
KMA, 2011. Comprehensive countermeasures for anticipative volcano response aiming volcanic disaster prevention and mitigation, Korea Meterological Administration, http://web.kma.go.kr/notify/information/publication_depart_list. jsp?bid=depart&mode=view&num=17&page=1&field=&text= &schGrp=3.
KRILI, 2011. Library and archives canada file format guidelines for preservation and long-term access, KRILizine, Vol. 70, pp.1-11.
Maes, K., Vandenbussche, S., Klüser, L. and Kumps N., 2016. Vertical profiling of volcanic ash from the 2011 Puyehue Cordón Caulle eruption using IASI, Remote Sensing , Vol. 8, No. 2, pp. 1-22.
MPSS, 2015. Development of IT-based response system for volcanic disaster, Ministry of Public Safety and Security, pp. 186-241.
MPSS, 2015-1. Development of IT-based response system for volcanic disaster, Ministry of Public Safety and Security, pp. 240-241.
Park, C. and Choi, H., 2013. Real-time volcanic ash diffusion model visualization based level of detail, Proc. of the 2013 KSHM Conference, Vol. 12, pp. 165-165.
Scaini, C. and Folch, A., 2013. A GIS-based tool for the estimation of impacts of volcanic ash dispersal on European air traffic, http://www.sesarinnovationdays.eu/files/SIDs/2013/SID-2013-16.pdf.
Simmon, R., 2011. A data visualization case study: ash from Eyjafjallajökull volcano, 34th International Symposium on
Remote Sensing of Environment,
http://www.isprs.org/proceedings/2011/ISRSE-34/211104015Final00517.pdf.
Yeo, J., Jo, M., Navastara, D.A., KIm, M. and Cha, E., 2013. A study on computer programs for estimating volcanic ash spreads, Proc. of the 2013 KSHM Conference, Vol. 12, pp. 224-224. The International Archives of the Photogrammetry, Remote Sensing and Spatial Information Sciences, Volume XLI-B8, 2016