Fast Digital Measurement of
Low Frequencies in a Narrow Band
Prof Dr T S Rathore Dean R&D, Head ET Department St Francis Institute of Technology,
Mt Poinsur, S V P Road, Borivali (W), Mumbai 400 103, India
Abstract— Conventional digital method for low frequency measurement based on counting the pulses over a fixed amount of time requires abnormally large time. On the other hand, if the reciprocal of the time period is measured, the time is reduced to one period only. Based on this principle, a method is presented for low-frequency measurement with reasonable accuracy over a narrow band of frequencies. The method is verified experimentally. This will find many applications such as measurement of power frequency changes.
Keywords- Low frequency measurement, fast frequency measurement, inverse period measurement, power frequency measurement
I. INTRODUCTION
For low frequency measurement, analog method [1] can be used. The digital value of the time period is sensed and digitally latched and applied to a multiplying digital to analog converter (DAC). The DAC is reconfigured as a divider by connecting the DAC in the feedback loop of an operational amplifier [2] [3]. The other input (Reference input) is –1 V dc. Thus, the output voltage is proportional to the reference voltage multiplied by the reciprocal of digital input, and, hence, proportional to the instantaneous rate of the signal. To achieve good accuracy, the analog circuit needs a careful adjustment, and with very low frequency signals the sample and hold droop is a serious source of error.
The conventional digital method of cycle counting requires a long time for low frequency measurement. For example, a signal of 1 Hz frequency requires 100 s for an accuracy of
±
1%. One possible alternative is to multiply the signal frequency by a known factor 10k (k is a positive integer) and then measure this high frequency. Frequency multiplication can be accomplished with a PLL or a suitable frequency multiplier.The circuit proposed by Smallwood [4] uses digital techniques, and the accuracy is, therefore, independent of the input signal frequency, but there is a limit on the ratio of the upper to the lower frequency for a given accuracy.
Commercial digital instruments which produce a digital output once per cycle, measure the period of the signal and then find its reciprocal using an IC calculator chip.
In this paper, we propose a simple, accurate and fast low-frequency measurement for narrow band around a nominal frequency. It is based on measuring the reciprocal of period measurement. A practical example for need of such a measurement is the power frequency, 50 Hz with ± 5% variation. Many sensors give output as frequency. Hence small variations in the non-electrical quantities such as pressure, temperature, can be measured with this device.
II. MEASUREMENT OF LOW FREQUENCY Up counting method
Let fo be the nominal frequency and To = 1/f0 be the corresponding time period. If the clock pulses of frequency
. 0 o C C o f f f f
T = = (1)
This requires the clock frequency
. 2 o
C f
f = (2)
At any other frequency f, the counter reading follows the straight line passing through origin and (T0, f0)., i.e., the relation
. 2
T f
f = o (3)
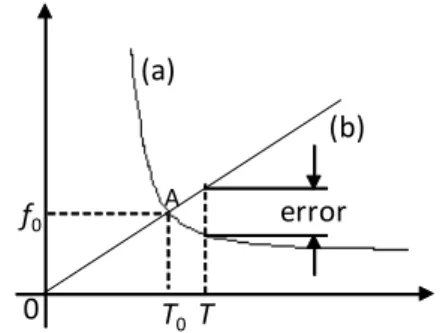
The plots of actual and displayed readings against period T are shown as curves (a) and (b), respectively, in Fig. 1. Note that, as f increases above fo, reading decreases and vice-versa. Hence, the error goes on increasing on either side of fo. Two methods to circumvent this problem are given below.
(a) T f0 0 error T0 (b) (a) A
Figure 1. Plots of actual reciprocating and practical curves
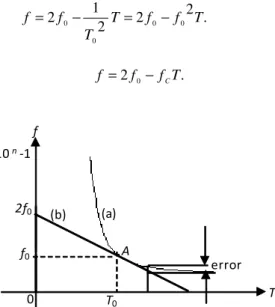
Method 1: Complementary counting
Instead of displaying the actual counter reading, its complement is displayed. This can be accomplished by initially setting the counter at its full value, i.e., 10n - 1, where n is the number of digits displayed, and by using the counter in the down count mode. Thus, the actual curve has the equation (a straight line passing through the points (f0, T0) and (10n-1,0)
. 2 ) 1 10 ( ) 1 10
( f0 f0 T
n n f − − − − = Also . ) 1 10 ( T C f n
f = − − (4)
Comparing the two equations, we get
=
C
f (10 1)f0 f02. n
−
− (5)
Note the following:
1.
In the vicinity of fo, reading is close to f. Thus, the method is reasonably accurate only over a narrow band around f0.. 0 )
1 10 ( 2
= + −
− C
n f f
f
As we know that one of the roots is f0, the other has to be (10n −1)− fo. Thus the meter can be used for the nominal frequency f0 or its complement. The displayed reading is less for lower frequencies and more for higher frequencies for nominal frequency f0 and vice versa for the complementary frequency.
f
f
0error
T
T
0T
0
A
(a)
(b)
10
n-1
B
Figure 2. Plots of actual reciprocating and practical curves
Method 2: Down counting
A more accurate solution is to simulate the actual period reciprocating curve f = 1/T by a straight line approximation such that the value fo and the slope -1/To2 at the point (To, fo) of the actual reciprocating curve are the same for the straight line. Thus, the straight line will have the equation
. 2 2 2 1
2 0 0
0
0 T f f T
T f
f = − = −
Also f =2f0− fCT.
(6)
10n -1
f0 f
T0
0
A
(a) (b)
2f0
error
T
Figure 3. Plots of actual reciprocating and practical curves when 2fo < (10n - 1)
Comparing the above two equations, we get
. 2 0
f
fC = (7)
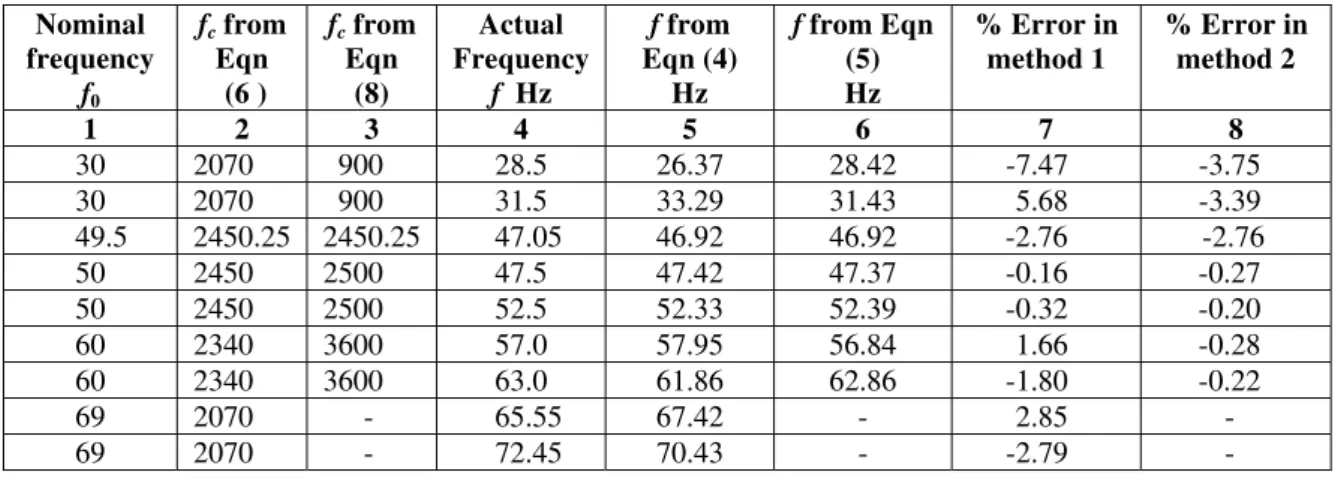
Table 1 gives the error at frequencies±5% of nominal frequencies of 30, 50, 60 by the above two methods. Also for the method 1, we have also given the readings for complement of nominal frequency 30 Hz, i.e., 69 Hz. The case when the nominal frequency is half the full counter reading, i.e, 49.5 Hz is also included.
TABLE I. :ERRORS AT DIFFERENT FREQUENCIES
Nominal frequency
f0
fc from Eqn (6 )
fc from Eqn
(8)
Actual Frequency
f Hz
f from Eqn (4)
Hz
f from Eqn (5) Hz
% Error in method 1
% Error in method 2
1 2 3 4 5 6 7 8
30 2070 900 28.5 26.37 28.42 -7.47 -3.75
30 2070 900 31.5 33.29 31.43 5.68 -3.39
49.5 2450.25 2450.25 47.05 46.92 46.92 -2.76 -2.76
50 2450 2500 47.5 47.42 47.37 -0.16 -0.27
50 2450 2500 52.5 52.33 52.39 -0.32 -0.20
60 2340 3600 57.0 57.95 56.84 1.66 -0.28
60 2340 3600 63.0 61.86 62.86 -1.80 -0.22
69 2070 - 65.55 67.42 - 2.85 -
69 2070 - 72.45 70.43 - -2.79 -
From Table 1, we note the following.
1.
Unlike in method 1, the errors in method 2 are all negative. This is because the reading is always less than the actual value of the frequency (see Fig. 3). It is, therefore, possible to reduce the spread in error by adjusting the intercept of the straight line (b) in Fig. 3 slightly higher than 2fo.2.
In method 1, the sign of the errors is governed by whether the nominal frequency is at point A or at B and higher or lower than the nominal frequencies. For the nominal frequency of 30 Hz the point is A and for 50, 60, 69 Hz the point is at B. For 49.5 Hz both points A and B coincide.3.
As expected, the error in method 2 is less than that in method 1, except in the case of nominal frequency 50 Hz when the frequency measured is lower (47.5) than the nominal frequency. This is because the slope of the straight line (b) in method 2 is greater than that of the line (b) in method 1 and the actual frequency measured is below point A.4.
For the nominal frequency equal to half the counter reading = 49.5 Hz, the two errors are the same.5.
We have calculated the errors at a very large variation in frequencies (5%). Better accuracies will be obtained if the variations are within 2% as in the case of power supply.To increase the accuracy in display, the clock frequency can be increased. For example for a resolution of 0.01, the clock frequency can be increased by 100 times.
In method 2, if 2fo > (10n - 1), one additional most significant digit will be required to store the initial value of 2fo. Alternatively, the counting can be carried out from 2[(10n - 1) - fo] (as e as shown in Fig. 4) in the up mode
T
10n -1
f0
f
T0
0
A
(a)
(b)
2f0 b
c d
e
with a frequency fC. When the counter becomes full, the counting should be switched to the down mode with the same frequency. Else, counting may be in the down mode from initially set value of 10n – 1 (as b as shown in Fig. 4) with a frequency fC. When the count reaches the value 2[(10n - 1) - fo, the counter is again set the full value 10n – 1 and allowed to continue in the down count mode with the same frequency fC. The two modes of operation are shown as edA and bcdA in Fig. 4. One more alternative is that the counter is initially reset to 00…00 and start counting upward with a clock frequency f’ till the counter is full and then switched over to the down counting with frequency fC. However, this will require an additional clock of frequency f’ > fC. Thus one has to trade off between the increase in cost due to additional components for one more bit or this arrangement. Note that we cannot measure the frequencies above half of the full range of the counter (10n-1)/2.
Accuracy can be increased by including further k-bit counter and increasing the clock frequency by a factor of 10k. This in effect makes the meter an (n + k) bit device, with the k least significant bits discarded.
III. PRACTICAL VERIFICATION
Frequency meters are designed for the nominal frequencies of 30, 50 and 60 Hz and fabricated for a resolution of 0.01. For 60 Hz, we have used the method 2 with the path edA shown in Fig. 4. The result obtained were within ±8% accuracy for method 1 and -4% for method 2, for a variation of ±5% in the nominal frequency. The range of errors in method 2 can be reduced by slightly increasing the intercept of the curve (b) so that it would become positive for some values and negative for other values.
IV. CONCLUSION
A method for low-frequency measurement with reasonable accuracy over a narrow band of frequencies around the nominal one in one cycle period has been presented. The method has been verified experimentally. This will find applications such as in the measurement of power frequency variations. This device, coupled with sensors whose output is a low frequency, can measure the changes faster and with better accuracy.
REFERENCES
[1] T S Nelsen & T M Vallace, “An instrument system for on line processing and statistical analysis of electroenterographic and electrogastrograpic data”, Digest of 6th Int. Conf. on Medical Electronics and Biomedical Engg., Tokyo, pp. 369-370
[2] T S Rathore, “Inverse active networks”, Electron. Lett., vol 13, pp. 303-304, 1977
[3] T S Rathore & B M Singhi, “Network transformations”, IEEE Trans. Circuits Syst., vol. CAS-27, pp. 57-59, 1980 [4] R H Smallwood, “An instantaneous rate meter”, Electron. Engg., vol. 50, pp. 27, 1978
AUTHORS PROFILE
T S Rathore was born in Jhabhua (M P, India) on Oct. 29, 1943. He received the B Sc (Electrical Engineering), M E (Applied Electronics & Servomechanisms), and Ph D (by research on Passive and Active Circuits) degrees in Electrical Engineering from Indore University, Indore, India in 1965, 1970 and 1975, respectively.
He served SGSITS, Indore from 1965 to 1978 before joining the EE Department of IIT Bombay from where he retired as a Professor on superannuation in June 2006. Currently, from July 2006, he is the Dean (R&D) and Head of Electronics & Telecommunication Department at St. Francis Institute of Technology, Borivali.
He was a post-doctoral fellow (1983-85) at the Concordia University, Montreal, Canada and a visiting researcher at the University of South Australia, Adelaide (March-June 1993). He was an ISTE visiting professor (2005-2007). He has published and presented over 200 research papers in various national/international journals and conferences. He has authored the book Digital Measurement Techniques, New Delhi: Narosa Publishing House, 1996 and Alpha Science International Pvt. Ltd., U K, 2003 and translated in Russian language in 2004. He was the Guest Editor of the special issue of Journal of IE on Instrumentation Electronics (1992). He is a member on the editoral boards of ISTE National Journal of Technical Education and IETE Journal of Education. He has witnessed, organized and chaired many national/international conferences and in some he was also the Chief Editor of the proceedings.
Prof. Rathore is a Senior MemberofIEEE (USA),FellowofIETE (India),Fellow ofIE(India),Memberof ISTE(India),Member of Instrument Society of India, Member of Computer Society of India. He has been listed in Asia’sWho’s Who of Men and Womenofachievement (1991). He has played a very active role as Fellow of IETE and has served its Mumbai Centre as Volunteer member (1997-98), Co-opted member (1998-99), Secretary (1999-2000), Chairman (2001-02), Vice Chairman (2003-06) and Chairman (2006-08).