High-Resolution Mutation Mapping Reveals
Parallel Experimental Evolution in Yeast
Ayellet V. Segre`, Andrew W. Murray, Jun-Yi Leu
*¤Department of Molecular and Cellular Biology, Harvard University, Cambridge, Massachusetts, United States of America
Understanding the genetic basis of evolutionary adaptation is limited by our ability to efficiently identify the genomic
locations of adaptive mutations. Here we describe a method that can quickly and precisely map the genetic basis of
naturally and experimentally evolved complex traits using linkage analysis. A yeast strain that expresses the evolved
trait is crossed to a distinct strain background and DNA from a large pool of progeny that express the trait of interest is
hybridized to oligonucleotide microarrays that detect thousands of polymorphisms between the two strains. Adaptive
mutations are detected by linkage to the polymorphisms from the evolved parent. We successfully tested our method
by mapping five known genes to a precision of 0.2–24 kb (0.1–10 cM), and developed computer simulations to test the
effect of different factors on mapping precision. We then applied this method to four yeast strains that had
independently adapted to a fluctuating glucose–galactose environment. All four strains had acquired one or more
missense mutations in
GAL80,
the repressor of the galactose utilization pathway. When transferred into the ancestral
strain, the
gal80
mutations conferred the fitness advantage that the evolved strains show in the transition from
glucose to galactose. Our results show an example of parallel adaptation caused by mutations in the same gene.
Citation: Segre` AV, Murray AW, Leu JY (2006) High-resolution mutation mapping reveals parallel experimental evolution in yeast. PLoS Biol 4(8): e256. DOI: 10.1371/journal. pbio.0040256
Introduction
Characterizing the genetic changes that underlie
evolu-tionary adaptation is important for understanding the
emergence of new phenotypes. Experimental evolution
makes it possible to follow the evolutionary history of
populations exposed to known selective pressures. Moreover,
the reproducibility of evolutionary paths can be explored by
comparing identical, independent experiments. Such studies
are beginning to shed light on the genetic basis of
evolu-tionary adaptation [1–4], but many questions remain open,
such as how rare gain-of-function mutations are relative to
loss-of-function ones, and how often similar phenotypic
adaptations are the result of similar genetic changes. A major
challenge is finding the adaptive (beneficial) mutations
without having to make prior assumptions about their type
or site.
Several strategies have been used to search for mutations
associated with evolved traits. These include sequencing
candidate genes [5–7], tracking the insertion sites of mobile
genetic elements [8–10], partial- or whole-genome sequencing
[1,11–13], gene expression profiling [2,14], identifying large
chromosomal rearrangements [8,15], and linkage analysis
[16–18]. Some of these approaches rely on the assumption
that mutations found repeatedly in several independently
evolved populations are likely to be beneficial. Ultimately, the
effects of the mutations on the evolved phenotypes have to be
verified experimentally [3,4,19].
Linkage analysis is the least biased and most general
method for finding adaptive mutations in a background of
neutral ones. It relies on linkage between the mutations that
produce the phenotype of interest and neutral genetic
markers (DNA polymorphisms) that can be easily followed,
and thus makes no assumptions about the nature or locations
of the adaptive mutations [20,21]. Such analyses are often
applied to progeny (segregants) from a cross between two
strains that differ for both the selected trait and the genetic
markers. Advances in genome technology have enabled
simultaneous genotyping of thousands of DNA
polymor-phism markers by hybridizing genomic DNA to
oligonucleo-tide arrays [22,23]. This has led to better genome coverage
and mapping resolution, as demonstrated on several traits in
budding yeast, including growth at high temperature and
sporulation efficiency [22,24,25]. However, such quantitative
trait mapping methods are laborious and expensive for
mapping multiple traits or multiple strains (e.g., strains
evolved in parallel experiments), as they usually require the
genotyping of multiple individual segregants for each strain
or trait being mapped. One solution is to mix DNA from
many individuals expressing the trait of interest, and
genotype it as a pool (selective DNA pooling; [26]). A variety
of pooled DNA genotyping methods have been used in
association studies in humans [27–30], as well as in
quanti-tative trait locus (QTL) mapping in plants and animals, where
experimental crosses are possible [31–36].
Here we map mutations in the budding yeast,
Saccharomyces
cerevisiae,
which we use as a model organism to study the
genetic basis of experimentally evolved traits ([37]; see also
Academic Editor:Kenneth Wolfe, University of Dublin, Ireland
ReceivedFebruary 7, 2006;AcceptedMay 31, 2006;PublishedJuly 25, 2006
DOI:10.1371/journal.pbio.0040256
Copyright:Ó2006 Segre` et al. This is an open-access article distributed under the terms of the Creative Commons Attribution License, which permits unrestricted use, distribution, and reproduction in any medium, provided the original author and source are credited.
Abbreviations:FDR, false discovery rate; GFP, green fluorescent protein; LLR, linkage likelihood ratio; LMS, linkage map score; MM, Mismatch; PM, Perfect Match; QTL, quantitative trait locus; SFP, single-feature polymorphism
* To whom correspondence should be addressed. E-mail: [email protected]
[4]). To overcome the limitations described above, we used
high-density oligonucleotide arrays to genotype a single large
pool of segregants that express the trait of interest, an
approach also used in plants [33]. This strategy reduces the
number of microarrays needed for mapping, and increases
mapping resolution due to the wide variety of recombination
breakpoints present in a large pool of segregants. We tested
and optimized our method on five known genetic loci and
developed computer simulations to test the effect of various
factors on mapping precision. We then applied it to four
yeast strains that have been evolved in an environment where
they were exposed to a regular alternation of carbon sources.
The adaptive phenotype was mapped to the same locus in all
four strains. We identified the adaptive mutations in the
mapped regions and experimentally verified their
contribu-tion to the evolved trait.
Results
A Bulk Segregant Mapping Method
A schematic description of the mapping method is
presented in Figure 1. Briefly, a haploid yeast strain that
expresses the trait of interest (the target strain) is crossed to a
reference strain that lacks the trait and differs from the target
strain at thousands of polymorphic sites (Figure 1A). The
hybrid diploid is then sporulated (undergoes meiosis), giving
rise to a diverse pool of recombinant haploid progeny
(segregants) that contain different combinations of their
parents’ genomic DNA. A large pool of segregants that
express the trait of interest is selected from the progeny (the
selected pool); as a control, a random pool of similar size is
collected without selecting for the trait (the control pool).
DNA from each pool is hybridized to an oligonucleotide
microarray that detects the polymorphic sites. If it is difficult
to select simultaneously for multiple segregants that express
the trait, single progeny can be screened individually for the
phenotype and later pooled for the linkage analysis. For each
locus, the extent of hybridization reveals the fraction of the
DNA that is derived from the target strain (Figure 1B);
regions where the target strain’s genotype is overrepresented
in the selected pool relative to the control pool are predicted
to contain mutations that contribute to the trait of interest
(target loci).
Genetic Map Construction for Linkage Analysis
The first step in mapping is finding loci that are
polymorphic between the target and reference strains. We
identified these by hybridizing the genomic DNA of the target
and reference strains separately onto high-density
oligonu-cleotide arrays. Oligonuoligonu-cleotides (features) that hybridized
significantly more strongly to DNA of the target strain than to
that of the reference strain were the polymorphic features
considered in this study (single-feature polymorphisms
[SFPs]). We identified SFPs with a detection algorithm that
uses a one-tailed two-sample
t
test (see Materials and
Methods) and estimated its sensitivity and specificity using
Figure 1.Schematic Description of the Pooled Mapping Method Applied to a Single Pool of Segregants in Budding Yeast
(A) A strain expressing the trait of interest (target strain) is crossed to a highly polymorphic strain that lacks the trait (reference strain). The DNA polymorphisms between the strains, represented by yellow squares for the target strain’s genotype and blue squares for the reference’s genotype, are the genetic markers used for the linkage analysis. After mating, the hybrid diploid is sporulated, yielding a pool of haploids (segregants) that are genetically diverse due to random recombination along the chromosomes. A large pool of segregants that express the trait of interest (cells with red background) is selected, enriching for segregants that carry the alleles that give rise to the trait of interest (target locus; represented by red circle). As a control, a pool of segregants of comparable size is randomly collected. For simplicity, only a single chromosome is shown.
(B) The location of the target locus is inferred by a genome-wide comparison of the fraction of the target strain’s genotype (yellow squares) within the selected pool to that within the control pool. The genomic DNA of the selected and control pools are extracted and their patterns of polymorphisms along the genome are analyzed. At polymorphic sites that are unlinked to the target locus, half of the segregants in the selected pool are expected to display the target strain’s genotype and half the reference strain’s genotype. However, at linked polymorphic sites, the fraction of selected segregants that carry the target strain’s genotype (black line) should be higher than 50% and inversely proportional to the distance between the polymorphic site (squares) and the target locus (red circle). For the control pool, the genotype of both parental strains should be equally represented throughout the entire genome (orange line). The target loci lie in chromosome regions where the target strain’s genotype is significantly overrepresented in the selected pool relative to the control pool.
two strains (S288c and YJM789) whose genomic DNA
sequences are known (see Materials and Methods). We
identified 4,438 S288c/YJM789 SFPs out of 12,602 true SFPs
at a
p
value of 10
6, yielding a true-positive rate of 35.22%
(fraction of the true polymorphic features that are scored as
polymorphic) at an estimated false discovery rate (FDR) of
6.74% (fraction of detected SFPs that are not truly
polymorphic) (Figure S1). At this
p
value, we detect 45% of
the SFPs where the sequence difference between the two
strains lies in the central 15 bases of the 25-base
oligonucleo-tide on the array. We chose a
p
value cutoff of 10
6for SFP
identification as it gave the highest true-positive–to–false
discovery rate ratio of the cutoffs tested.
Mapping Method Tested on Five Known Genes
We asked whether we could use pools of segregants from
single crosses to map known genetic loci. We chose W303 and
SK1 as the target and reference yeast strains as they are
widely used in laboratory studies and a high level of
polymorphism was reported between them [23]. Using our
SFP detection algorithm, we identified 10,330 W303/SK1 SFPs
at an estimated FDR of 2.9%, resulting in an average marker
density of 1 SFP per
;
1.1 kb or
;
0.4 cM (the distribution of
distances between SFPs is shown in Figure S2). These SFPs
made up the genetic map used for the linkage analyses in this
work.
We tested the performance of our method by mapping one
metabolic and four drug resistance genes whose
chromoso-mal locations are known (details in Materials and Methods).
The target strain was a derivative of W303 that carries alleles
that confer resistance to four drugs, canavanine
(can1),
geneticin
(KAN
R),
hygromycin
(HYG
R),
and nourseothricin
(NAT
R),
and that can produce lysine
(LYS5).
It was crossed to
the reference strain, a derivative of SK1 that is sensitive to all
four drugs and cannot make lysine
(lys5),
and the hybrid
diploid was sporulated. To simultaneously map
LYS5
and
can1,
we selected approximately 10
7segregants that grew in
liquid medium lacking lysine and containing canavanine. To
map
KAN
R, HYG
R,
and
NAT
R,
we selected a second pool of
approximately 10
7segregants in liquid medium containing
geneticin, hygromycin, and nourseothricin (Clonat). A
con-trol pool of segregants of comparable size was isolated in rich
medium without drugs. The genomic DNA of each selected
and control pool was hybridized to four identical arrays. The
hybridization intensities of the selected and control pools and
the target strain at the W303/SK1 SFPs were converted into a
linkage map score (LMS) by analyzing the intensities across a
moving window along the genome that included 50 SFPs (see
Materials and Methods). This score reflects the probability
that a given chromosomal region is linked to the selected trait
(for further discussion, see Protocol S1). We used simulations
to estimate the minimum LMS that we considered significant.
The order of the SFPs was scrambled 1,000 times, for each
ordering we recorded the highest LMS found across the
genome, and we considered peaks in the unpermuted data
significant only if they exceeded the 99th percentile of the
ranked maximum scores from the permuted simulations (see
Materials and Methods). Figure 2 shows the LMS for the
chromosomes containing the mapped loci, and Figure S3
shows the LMS across the entire genome.
A total of six peaks were found above the cutoff: two for the
can1, LYS5
pool and four for the
KAN
R, HYG
R,
and
NAT
Rpool. Of the six peaks, five corresponded to the five selected
genes (Figure 2). We used mapping deviation, the distance
between the center of a mapped peak and the center of the
linked target gene, as a measure of mapping precision. In
addition, we estimated 95% confidence intervals for each
mapped locus using computer simulations (see Materials and
Methods). The mapping deviations of the five genes, 0.2, 1.7,
Figure 2.Successful Mapping of Known Genes
Two separate pools of ;107W303/SK1 segregants, one resistant to canavanine that grew without lysine(can1, LYS5)and one resistant to geneticin, hygromycin, and nourseothricin (KANR, NATR, HYGR),
were selected for and mapped. The five genes mapped are: (A)can1,centered on Chromosome 5, position 32.6 kb; (B) LYS5, on Chromosome 7, position 215.7 kb; (C)KANR,
on Chromosome 7, position 413.4 kb; (D) HYGR,
on Chromosome 15, position 619.1 kb; andNATR,
on Chromosome 15, position 960.6 kb. The LMS was calculated across the whole genome for each pool (shown in Figure S3) and is plotted here along the chromosomes that carry the five target genes, as a function of chromosome position in 100-kb units. The five peaks that correspond to the five target genes all fell above the significant peak thresholds estimated at 99% confidence for each selected pool (horizontal dashed lines, which are so close to thex-axis as to be invisible in [C] and [D]). The arrows mark the actual center of the target genes, the solid lines within the drawn chromosomes mark the predicted center of the genes, and the grey boxes within the chromosomes mark the 95% confidence intervals estimated with simulations (see Materials and Methods). The peak forLYS5is low relative to the significant peak cutoff, because of the low local SFP density (see Figure S3G–S3I for discussion). Note that the scale of they-axis is different in the four panels (Protocol S1). (E) The mapping deviations of the genes’ predicted centers from their actual centers and their 95% confidence intervals. Their corresponding average genetic distance in cM is written in parentheses. All five genes were found within their 95% confidence intervals.
8.3, 9.5, and 24 kb (
;
0.1–10 cM) for
KAN
R, can1, HYG
R, LYS5,
and
NAT
R,
respectively, all fell within their 95% confidence
intervals, which ranged from
6
10 to
6
44 kb (
6
4 to
6
18 cM).
The mapping deviations are robust to the array
preprocess-ing method used (see Tables S1 and S2, and Figure S4). This
test case demonstrates that genes proximal to the centromere
or telomere
(can1
and
KAN
R)
can be mapped at high
resolution, and that two genes on the same chromosome
arm can be easily separated from each other
(HYG
Rand
NAT
R).
The LMS is influenced by several factors, including
SFP density, local recombination frequency, and the variance
of the hybridization to individual probes on the array. As a
result, the differences between the LMSs of the different
peaks do not reflect the quantitative contribution of the
different loci to the selected phenotype (see Protocol S1).
Aside from one potential false-positive peak found on
Chromosome 10 at position 146.3
6
30 kb, the signal-to-noise
levels of the LMS was high (Figures S3 and S5). One possible
interpretation for the extra peak is that it has uncovered real
DNA differences between the target (W303) and reference
(SK1) strains that contribute to the resistance to one or more
of the drugs used for the selection. The failure to observe this
peak in the
can1, LYS5
pool supports this hypothesis, although
we found no obvious candidates for genes whose
poly-morphisms might contribute to drug resistance in the 95%
confidence interval on Chromosome 10.
To assess the consistency of our mapping precision,
KAN
R,
HYG
R,
and
NAT
Rwere mapped in two additional selected
pools derived from different initial W303/SK1 hybrid
diploids, yielding a total of three completely independent
mapping experiments (unpublished data). The genes’ mean
mapping deviations and their standard deviations are 7.5
6
6.4 kb, 4.1
6
3.6 kb, and 14.9
6
8.6 kb, respectively, with a
total mean mapping deviation of 8.8 kb.
For some organisms or phenotypes, selecting for 10
7segregants that express the trait of interest is impractical.
We therefore asked whether we could map the
KAN
R, HYG
R,
and
NAT
Ralleles with 10
4or 100 segregants. Even with 100
segregants, the three drug-resistance genes were mapped to
within 50 kb of their correct locations (Table 1; see Figure S3
for whole-genome maps). No significant correlation was seen
between the mapping precision of the three genes and pool
size (100, 10
4, and 10
7segregants) (
p
.
0.6,
t
test).
A variety of factors could cause alleles that contribute to a
trait to be absent from some members of a pool that had been
selected to express the trait strongly. To examine the
robustness of our method to such deviations, we tested
whether three drug-resistance genes could be mapped when
their enrichment level in the selected pool is close to 70%–
75% instead of 90%–100% as with our test case. Thus, we
mixed equal amounts of DNA from a pool of segregants
selected for resistance to geneticin, hygromycin, and
nour-seothricin and a control, unselected pool, yielding an
approximately 3:1 ratio of target strain polymorphisms to
reference polymorphisms in regions linked to the drug
resistance genes. Although the LMSs were greatly reduced,
we still observed three peaks that corresponded to the three
selected genes, demonstrating that we can map alleles that are
absent from a substantial fraction of the selected pool (Figure
S3J). In addition, the signal-to-noise ratio of the LMSs was still
substantially high (Figure S5).
Computer Simulations of the Mapping Process
We developed a computer model that simulates the whole
mapping process (see Materials and Methods) to assess the
effect of experimental design (e.g., number of arrays),
intrinsic genetic factors (e.g., recombination rate), and
adjustable statistical parameters (e.g.,
p
value cutoff for SFP
detection) on mapping precision. Figure 3 presents the effect
of the number of array replicates, noise levels between
replicate intensities (coefficient of variation, the standard
deviation divided by the mean), SFP FDR, SFP density
(number of SFPs per 1 kb), and recombination rate on
mapping deviation. Aside from the factor being varied, the
parameters for the simulations were taken from our mapping
experiments. The mapping deviations obtained with
simu-lations are consistent with the experimentally observed
mapping deviations for the five test case genes. Of the factors
tested, SFP density and recombination rate displayed the
strongest effect on mapping precision, with higher SFP
density and higher recombination rate improving mapping
precision. Even in regions with a ten-fold lower SFP density
than average (
;
99% of SFPs lie in denser regions; Figure S2)
or a four-fold lower recombination rate than average, our
simulations suggest that a gene can successfully be mapped,
albeit with lower resolution. We tested the effect of SFP
density in our experiments by excluding varying fractions of
Table 1.
Mapping Precision as a Function of Segregant Pool Size
Gene Pool Size
107Segregants 104Segregants 102Segregants
Mapping Deviation, kb (cM)
95% CI, kb (cM)
Mapping Deviation, kb (cM)
95% CI, kb (cM)
Mapping Deviation, kb (cM)
95% CI, kb (cM)
KANR
0.2 (0.1) 644 (617.6) 0.2 (0.1) 644 (617.6) 4.2 (1.7) 643 (617.2)
HYGR
8.3 (3.3) 626 (610.4) 23.7 (9.5)a 610 (64) 2.7 (1.1) 617 (66.8)
NATR
24.2 (9.7) 644 (617.6) 11.2 (4.5) 645 (618) 51.2 (20.5)a 624 (69.6)
The mapping deviations between the predicted positions of the mapped genes and their actual centers, and the estimated 95% confidence intervals (CI) are given in kb units rounded to the nearest 0.1 kb, and their corresponding genetic distance in cM is given in parentheses.
a
These mapping deviations marked fall outside their estimated 95% confidence intervals. This may be because the local recombination rate is lower than the average rate used for the simulations, which would lead to an underestimation of the confidence intervals.
the SFPs that lay near
KAN
Rfrom our analysis, to create an
SFP density that ranged from 1.8 to 0.2 SFPs/kb. The negative
trend of mapping deviation as a function of SFP density seen
in simulations (Pearson’s correlation coefficient
R
2¼
0.96
for mapping deviation versus logarithm of SFP density)
corresponded closely to that observed in this manipulation of
our experimental data (
R
2¼
0.95). As increased SFP FDR has
little impact on mapping precision, especially in our observed
experimental range (3%–7%), choosing a more liberal cutoff
for identifying SFPs might help to map genes located in
regions with low SFP density. In contrast, the number of array
replicates and coefficient of variation between replicate
intensities show only a weak effect on mapping precision,
in particular in the ranges relevant for our study (two to four
arrays, and coefficient of variation of 8%–15%). The
simulations suggest that duplicate arrays for the selected
and control pools suffice, which is in agreement with our
mapping results of the test genes (see Table S3).
Mapping an Experimentally Evolved Trait in Yeast
We used our mapping method to uncover the genetic basis
of an experimentally evolved trait in yeast. We chose four
W303 populations, derived from the same ancestor, that had
been alternately grown in glucose- and galactose-containing
media for 36 sexual cycles as part of a selection for altered
mating preference [37] (Figure 4A). A single haploid clone
was chosen from each population after the 36th cycle of
selection. After
;
700 generations all four strains had evolved
to resume proliferation more rapidly than their ancestors
when transferred from glucose- to galactose-containing
medium (see below).
GAL3,
which encodes a coinducer of
the galactose pathway [38], was found to be overexpressed
three- to five-fold in the evolved strains compared with the
ancestor when grown in medium with glucose as the sole
carbon source (unpublished data).
We used
GAL3
as a reporter gene to select for segregants
from crosses between the evolved strains and SK1 (Ev/SK1)
that express the adaptive phenotype. For each of the four
evolved strains, about 10
4Ev/SK1 segregants that expressed
high levels of Gal3 fused to a green fluorescent protein (GFP)
were selected using flow cytometry (see Materials and
Methods). The genomic DNA of the control and selected
pools were hybridized onto two or three replicate arrays each
and the LMS was calculated for the entire genome (Figure S6).
In all four strains, the adaptive phenotype was mapped to the
same region on Chromosome 13 with a mean peak center of
173.3 kb and a mean 95% confidence interval of
6
36 kb (
6
14
cM; Figure 4B). An additional peak linked to
GAL3-GFP
on
chromosome 4 was found for strain Ev2 because the Ev2/SK1
hybrid diploid was heterozygous for the
GAL3
-
GFP,
with the
one copy of
GAL3
-
GFP
lying on the chromosome derived
from the evolved strain, while the other strains were
homozygous for
GAL3
-
GFP
(Figure S6).
GAL80,
which encodes the key repressor of the galactose
utilization pathway [39], lies within 1 kb of the mean center of
the linked intervals. We therefore sequenced this gene in the
four evolved strains and in the ancestor. One or two missense
mutations were found in
GAL80
in all four strains (Figure 4C).
Two of the strains carry the same mutation. One of the
mutations, Q392H, has been recently identified in a screen
for
GAL80
mutations that cause loss of the Gal80 inhibitory
activity [40]. Three other mutations, I361M, Q392H, and
H36Y, lie in nuclear localization sequence regions of Gal80
[41]. The transcriptional regulation of the galactose
utiliza-tion pathway, including the role of Gal80, is depicted in
Figure 5A.
To test whether these mutations account for the adaptive
phenotype, the endogenous
GAL80
gene of the ancestral cells
was replaced with the three different mutant genes, and the
growth curves of these haploid strains were compared to
those of the ancestor and a
gal80
D
strain. Compared to the
ancestral allele, all the mutations in
GAL80
conferred a
growth advantage during the transition from using glucose as
Figure 3.Computer Simulations Evaluate the Effect of Different Factors on Mapping Precision
The absolute distance of the predicted position of a simulated target locus from its real position (mapping deviation) is plotted as a function of (A) number of array replicates, (B) coefficient of variation (standard deviation divided by the mean) of hybridization intensities, (C) SFP FDR, (D) SFP density, and (E) recombination rate. Aside from the varying factor, the parameters were set to the values observed in our test case (Figure 2) and are marked on each panel with a red arrow. With the exception of (A), four replicate arrays were used for the selected and control pools, and eight replicates for the target strain. The mean coefficient of variation values of all our test case hybridizations at SFPs varied between 8%–15%. A smoothing window of 50 SFPs was used for all simulations except for SFP density, where a window of constant chromosome size (50 kb) was used. The mean and standard errors were computed from 5 repetitions of 1,000 simulation runs each for every datapoint. Error bars that are not visible are smaller than the dot. Note the logarithmic scale of thex-axis of SFP density.
the sole carbon source to galactose (
;
2-fold increase at 6 h;
Figure 5B–5D). However, no significant growth differences
were observed for cells transferred from to
glucose-containing medium or from galactose- to
galactose-contain-ing medium (Figure S7A–S7H). The ancestral strains carrygalactose-contain-ing
the evolved
gal80
mutations behaved similarly to the
gal80
D
strain, suggesting that the mutations in
GAL80
cause a partial
or complete loss-of-function of Gal80
9
s repressive activity on
the galactose utilization pathway (Figure 5E). Hence, the
gal80
mutations explain the growth advantage observed for the
four evolved stains relative to the ancestor following transfer
from glucose to galactose (
;
1.2–1.9-fold more evolved cells
than ancestral cells 6 h after transfer; Figure 5F–5I). The
slower growth observed for the ancestor compared with the
evolved strains in the transition from glucose to galactose is
likely the result of a growth delay while the ancestral cells
repress Gal80
9
s inhibitory effect and induce the genes
required for galactose uptake and catabolism.
We compared the effects of the mutations in
GAL80
in two
strains: the evolved strains and the strains produced by
transforming these mutations into the ancestral strain.
Ancestral cells carrying only the evolved
gal80
mutations
have a larger growth advantage relative to the ancestral
GAL80
strains than do the evolved strains from which these
mutations were rescued (compare Figure 5B–5D to 5F–5H).
This difference is probably due to one or more other
mutations that accumulated in the evolved strains and have
a fitness cost under the conditions of our experiment. The
slight decrease in fitness observed for the evolved strains (Ev2
and Ev42) relative to the ancestor when transferred from one
glucose-containing medium to another supports this
hypoth-esis (Figure S7E–S7L).
During each cycle of the evolution experiment, diploid
evolving cells were transferred from glucose- to
galactose-containing medium (Figure 4A). This selection prompted us
to ask whether a single copy of the
gal80
mutations conferred
any advantage on a diploid background. We compared the
growth curve of ancestral diploids heterozygous for one of
the three sets of
gal80
mutations to that of an ancestral
diploid, a
gal80
D
/
gal80
D
diploid
,
and a
GAL80
/
gal80
D
diploid,
following transfer from glucose to galactose (Figure 5J–5M).
The intermediate growth levels of the heterozygous
GAL80
/
Ev-gal80
diploid and the
GAL80/gal80
D
diploid compared with
the ancestor and the
gal80
D
/gal80
D
diploid show that all three
sets of
gal80
mutations, similar to
gal80
D
,
are phenotypically
semidominant. In a molecular sense, this argues that the
GAL80
gene is weakly haploinsufficient, most likely because of
Figure 4.Four Evolved Strains That Independently Adapted to Glucose– Galactose Transition Acquired One or Two Missense Mutations inGAL80 (A) A schematic description of the evolution experiment. In each cycle of evolution, haploid cells (light blue) were grown in glucose-containing media for 4 d, mated on YPD plates, and then transferred to galactose-containing media for 2 d. The diploid cells (dark blue) were then put through a sporulation cycle (meiosis) with potassium acetate as their carbon source. Each evolved population was put through 36 such cycles. (B) All four evolved strains were mapped to a single locus on Chromosome 13. The LMS is plotted as a function of chromosome position in 100-kb units for Chromosome 13, where a significant peak was detected in all four strains. The predicted peak centers and estimated 95% confidence intervals are: Ev2, 185.8627 kb (orange); Ev14, 165.8639 kb (red); Ev42, 169.8640 kb (green); and Ev43, 171.8
636 kb (black). The solid cyan line within the schematic chromosome marks the mean of the four predicted peak centers (173.3 kb), and the grey box within the chromosome marks the mean estimated 95% confidence interval (635.5 kb [614.2 cM]). The genes that fall within a 30-kb interval around the mean peak center (cyan dashed line) are
depicted below (black or gray boxes) with theGAL80gene colored in red (centered at 172.2 kb; gene coordinates taken from theSaccharomyces Genome Database). The peak centers of the four evolved strains are marked with lines color-coded according to their LMS plot. Figure S6 shows the LMS across the entire genome for this experiment. (C)GAL80was sequenced in the four evolved strains (Ev2, Ev14, Ev42, and Ev43) and in the ancestor, and the mutations found are presented at the nucleotide and amino acid levels. The mutated nucleotides are underlined. In addition, a deletion of a single T was found 96 nucleotides upstream to the translation start site ofGAL80in Ev42. This mutation is unlikely to have a significant effect on the activity of Gal80, as the mutation in amino acid 222 alone was sufficient to recapitulate the adaptive phenotype (see Figure 5D). The GAL80 sequence of the reference strain, SK1, is identical to that of the ancestor, W303, at the nucleotide level.
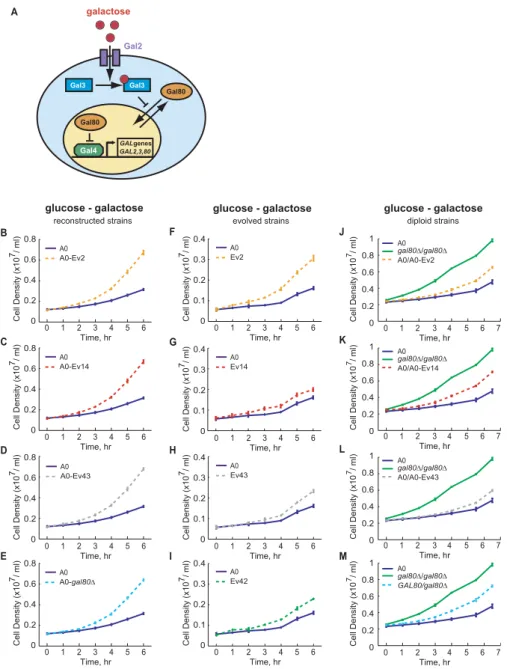
Figure 5.Transformation ofgal80Mutations into the AncestralGAL80Reconstructs the Adaptive Phenotype
(A) A schematic depiction of the regulation of the galactose utilization pathway. In the absence of galactose, Gal80 inhibits the transcriptional activator, Gal4, by binding to Gal4 in the nucleus. When galactose is present it enters the cell through Gal2 transporters and binds Gal3, a coinducer of the pathway, which in turn binds Gal80 in the cytoplasm, sequestering Gal80 away from the nucleus. This relieves the repression of Gal4 allowing it to induce the transcription of genes required for galactose uptake and catabolism (GALgenes), includingGAL2, GAL3, GAL80,and the genes encoding the enzymes of galactose catabolism [38]. A similar phenotype is obtained through loss-of-function of the repressor,GAL80.
(B–E) Thegal80mutations confer a fitness advantage in transfers of exponentially growing haploid cells from glucose- to galactose-containing medium, but not in transfers in which the carbon source does not change (Figure S7). Three different sets ofgal80mutations in the coding region were transformed into the ancestralGAL80gene in an ancestral haploid strain (A0) (Ev2 indicates the mutation is from evolved culture 2, etc.). Ev42 and Ev43 have the same mutation in the coding region. Cell density (OD) was measured for each of these strains and for the ancestor and aGAL80knockout strain following transfer from glucose- to galactose-containing medium.
(F–I) The four evolved strains are more fit than their ancestor (A0) when transferred from glucose- to galactose-containing medium. Cell density (OD) was measured for the haploid evolved strains Ev2, Ev14, Ev43, and Ev42, and their ancestor, following transfer from medium containing only glucose to medium containing galactose.
(J–M) Thegal80mutations have a semidominant effect when present in one copy in the ancestral diploid strain following transfer from glucose- to galactose-containing medium. The cell density (OD) of ancestral diploids carrying one copy of thegal80mutations from either Ev2, Ev14, or Ev43 were compared to that of an ancestral diploid (A0) and a diploid lacking both copies ofGAL80 (gal80D/gal80D),following transfer from glucose- to galactose-containing medium. As a control, an ancestral diploid was made hemizygous forGAL80 (M; GAL80/gal80D).
Mean cell density and a standard deviation from at least three independent cultures were plotted for each datapoint for (B–M). Error bars that are not visible are smaller than the datapoint.
its need to titrate Gal4, the transcriptional activator. In an
evolutionary sense, our observations suggest that the
gal80
mutations could have been initially selected for when only
one copy of the mutation/s was present in the diploid.
Discussion
We present an optimized method that maps adaptive
mutations in yeast with higher precision and less work than
previous linkage-based mapping methods [22,24,25]. One
advantage of our method is the capacity to predict where the
linked locus is most likely to lie within a mapped region,
which helps prioritize sequencing and candidate gene testing.
Therefore, even though our estimated 95% confidence
intervals (20–88 kb [8–35 cM]) are comparable with mapping
intervals identified in previous SFP-based methods that
analyze
;
20 segregants individually in yeast (8–72 kb [3–29
cM]) [22,24,25], the centers of our mapping predictions are
typically much closer to the actual mutations. By pooling at
least 10,000 segregants from a single cross, we obtained
mapping deviations of test genes that ranged from 0.2–24 kb
(0.1–10 cM). In four independently evolved populations,
mutations in the same gene
(GAL80)
were mapped with a
mean mapping deviation of 5.7 kb, and the average position
of the four predicted positions was 1 kb from the center of
the
GAL80
gene. Furthermore, pooling makes mapping easier
and cheaper than analyzing single segregants. We can analyze
more than 10
7selected segregants simultaneously using fewer
arrays (a minimum of four) than are needed to individually
analyze
;
20 single segregants (20 arrays). In both methods,
additional arrays (at least two) are needed for the initial,
one-time prediction of SFPs. If necessary, our method can be
applied to pools that contain as few as 100 segregants. This is
important for organisms that produce few progeny, or for
phenotypes that must be assessed by assaying individually
selected segregants, which are then assembled into pools,
rather than directly selecting on pooled meiotic progeny.
Since our method can simultaneously map multiple genes
with high efficiency, including genes lying on the same arm
(HYG
Rand
NAT
R)
and genes affecting a quantitative
phenotype
(GAL80),
our method could be useful for
multi-genic or QTL mapping. This combination of
high-through-put genotyping with oligonucleotide arrays [22] and pooling
[27] has also been applied in plants [33,34], and should
accelerate QTL detection compared with traditional
single-segregant mapping methods in a wide variety of organisms
[20,21,42,43]. Our method has advantages and disadvantages
compared to other forms of QTL mapping. We do not make
assumptions on the number of contributing QTLs or the
type of interactions between them, as multiple QTL and
composite interval mapping methods must do [21]. By
selecting and genotyping pools with extreme phenotypic
values, we gain mapping power, but we cannot estimate the
relative effect of individual QTLs on a trait. Previous studies
show that QTL effect can be estimated by genotyping pools
with broader phenotypic values from the lower and upper
tails of the phenotypic distribution and associating the
differences in phenotypic means of the two pools to
differences in their marker allele frequencies [35,44,45].
Another issue is that pools lack information on the phase
between genetic markers (e.g., haplotypes) and QTLs, making
it hard to learn about the type of interactions between QTLs
(e.g., additive or epistatic) or to recognize distinct subsets of
QTLs that can independently give rise to the same trait [27].
Since pool genotyping is commonly used in human
association studies [27,30], it would be interesting to explore
whether our method and its statistical framework could be
extended to such studies [46].
We developed a computer model that simulates the
mapping process to better understand the effects of various
factors on mapping precision, and to improve our
exper-imental protocols. The parameters of the model can be
adjusted so that the simulations can be applied to other
experimental designs, such as backcrosses, and to different
organisms. Our simulations suggest that marker density and
recombination rate are the major factors affecting mapping
precision. While we have generated a very dense genetic map
of about 10,300 DNA markers (on average
;
1 SFP/kb), the
model predicts that with tighter genetic marker spacing (two
to four markers per kb) our method could reach even higher
mapping resolutions, corresponding to a few genes in yeast
(
;
1–2 cM). Tiling arrays that contain oligonucleotides that
cover the whole genome and that are available for some
organisms (recently including yeast [47]) will provide such
high SFP coverage. Alternatively, different reference strains
with different polymorphism distributions compared with
the target strain can be used to increase genome coverage
and marker density.
We showed that four independently evolved strains found
the same genetic solution to repeated transitions from
glucose- to galactose-containing medium and two of the
strains independently acquired the same mutation. All three
sets of mutations in
GAL80
reduced its ability to repress genes
involved in galactose metabolism. Thus, we observed parallel
evolution at the genetic level, as has been seen in viruses,
bacteria, and yeast that have been experimentally adapted to
stressful conditions [1,2,4], and in fish with pelvic and armor
plate reduction, and albinism [17,48,49]. Mutations in
GAL3
or
GAL4
have been shown to lead to constitutive expression
of the galactose utilization pathway [50,51]. We did not find
gain-of-function mutations in these genes, most likely
because the target size for loss-of-function mutations in
GAL80
is much larger than that for gain-of-function
mutations in
GAL3
or
GAL4.
All the missense mutations we
found in
GAL80
lie in residues that are highly conserved
across yeast species from
Saccharomyces cerevisiae
to
Kluyver-omyces lactis
(Figure S8). Our results, together with other
studies [2,17], support the notion that mutations in regulatory
genes may lead to large benefits in populations subjected to
changing environments.
Materials and Methods
Yeast strains, techniques, and media.The genotypes of the yeast strains used in this study are listed in Table S4. The target strain for our test mapping (AVS4) was a W303 strain, JYL13(MATa ura3–1 his3–11,15 trp1–1 ade2–1 can1–100) transformed with three drug-resistance genes,KANR, HYGR,andNATR,which had been integrated at the following intergenic locations:KANR on Chromosome 7 at
position 413,409 bp (betweenALG13andRIM8),HYGRon Chromo-some 15 at position 619,115 bp (betweenYOR152candPDR5), and
NATR
at Chromosome 15 at position 960,610 bp (betweenRPA43and
RPA190). The reference strain used for the test case is a derivative of SK1, JYL394(MATaura3 (DSmaI-PstI) trp1::hisG leu2::hisG lys5D::3xHA ho::hisG GAL3)[53]. The YJM789 strain was provided to us by the Ron Davis lab (MATa ho::hisG gal2 lys2) [54], and the S288c strain was BY4742 (Invitrogen, Carlsbad, California, United States). The evolved strains originated from strains isogenic with W303 (JYL243 and JYL246). Yeast transformations were carried out by the lithium acetate procedure [55]. Media, microbial, and genetic techniques were as described [56].
To map known genes, the target and reference strains were mated and single, manually isolated diploids were grown overnight in YEP (yeast extract peptone)þ 2% potassium acetate (KAc) and then sporulated in 2% KAc for 3 d. Haploid segregants from this cross were grown overnight in one of three liquid media: (1) synthetic medium lacking arginine, lysine, and containing canavanine (com-plete synthetic media [CSM] lysine arginine þ 60 lg/ml L-canavanine [Sigma, St. Louis, Missouri, United States]) to select for Lysþ, Canrcells; (2) rich medium containing geneticin, hygromycin, and nourseothricin (YPD [1% yeast extract, 2% peptone, 2% dextrose] þ 400 lg/ml geneticin [G418; Gibco-BRL, Carlsbad, California, United States] þ 300 lg/ml hygromycin B [Roche, Indianapolis, Indiana, United States]þ 100 lg/ml nourseothricin [Clonat; Werner BioAgents, Jena, Germany]) to select for Kanr, Hygr, Natrcells; or (3) rich medium (YPD) to produce the control pool. To select for 100 segregants, the asci of the sporulated hybrid diploid were digested and the spores were immediately plated on selective medium. Colonies (100) representing individual segregants were picked and mixed in equal amounts.
Evolution experiment. The four evolved populations originated from the same ancestral strain in four separate, replicate experi-ments. In each cycle of evolution, haploid cells were grown in glucose-containing media for 4 d, mated on YPD plates and transferred to galactose-containing media for 2 d, and then put through a sporulation cycle. There were 36 such cycles for each population. The primary motivation of this experiment was to evolve mating discrimination (described in [37]). The evolving and ancestral cells were genetically designed so that cycles of exposure to glucose and galactose would contribute to the selection for an altered mating preference in the evolving population. During the whole procedure, the effective population size was maintained at more than 105cells.
Selection for segregants expressing adaptive phenotype.To map the adaptive mutations in the evolved strains, a single representative clone was isolated from each evolved population (see [37]). Since high
GAL3 expression was found in the evolved strains relative to the ancestor (unpublished results), we choseGAL3as a reporter gene for the adaptive glucose-galactose phenotype. The gene encoding green fluorescent protein,GFP,was fused to the C-terminus of GAL3 at
GAL3’s endogenous chromosomal location. The evolved clones and an ancestral clone (as a control) were then mated with a reference SK1 strain (JYL631 and JYL632) and sporulated. Haploid segregants in mid-log growth phase in YPD were sorted by a fluorescence-activated cell sorter (FACS; DakoCytomation MoFlo Cell Sorter, Carpinteria, California, United States) according to Gal3-GFP intensity (using excitation at 488 nm and a 505–555-nm emission filter). The brightest 5% of cells were collected and a total of 104cells were isolated and amplified for genomic DNA extraction. A 1:1 mixture of ancestral cells and ancestral cells transformed with the
gal80 mutations, both carrying Gal3-GFP, showed a bimodal distribution of GFP expression, demonstrating that the ancestral and evolved populations could be cleanly separated.
Genomic DNA hybridizations.For genotyping and linkage analysis, genomic DNA was hybridized onto Affymetrix Yeast S98 arrays (http://www.affymetrix.com/index.affx) that contain 25mer probes designed using the genomic DNA sequence of the S288c strain. Total genomic DNA was extracted using the Qiagen Genomic-Tip 100/G kit (Qiagen, Valencia, California, United States) and brought to a final concentration of 1lg/ll in distilled water. For each sample, 10lg of DNA was digested, labeled, and hybridized onto an array according to standard Affymetrix protocols for RNA hybridization (http://www.
affymetrix.com/support/index.affx). We reduced the concentration of NaCl in the hybridization solution to 0.45 M in order to shift the average hybridization intensity away from saturation to an average of 1,000–3,000 U. Hybridized arrays were scanned using the Affymetrix scanner (GeneChip Scanner 3000) and the .CEL files (version 3) were used for the mapping analyses. The genomic DNA of the target and reference strains was hybridized onto eight array replicates each, and the selected and control pools onto two to four replicates.
Array feature sequence analysis.We refer to the oligonucleotides on microarrays as features. Each of the 136,934 Perfect Match (PM) 25mer probes on the Affymetrix Yeast Genome S98 array were blasted against the S288c genome (ftp://genome-ftp.stanford.edu/pub/ yeast/sequence/genomic_sequence/chromosomes/fasta) from which the probe sequences were designed. Only features that met the following criteria were used in this study: (1) they have a unique perfect match against the S288c genome; (2) they do not lie in repetitive regions, such as telomeres, centromeres, yeast autonomous replication sequences (ARS), or mobile genetic elements (feature positions downloaded from ftp://genome-ftp.stanford.edu/pub/yeast/ sequence/genomic_sequence/other_features/other_features_ge-nomic.fasta.gz); and (3) they do not lie in mitochondrial sequences. In cases where two fully complementary probes were found, only one of the two was kept to avoid probe redundancy. A table with the chromosome locations,xandyarray coordinates, and the sequences of the resulting 120,050 probes is available at http://www.cgr.harvard. edu/MutationMapping.
Array preprocessing and normalization.The raw signal intensities of the PM and Mismatch (MM) features on Affymetrix yeast arrays were extracted from .CEL files (version 3) obtained from array scans. The intensities of the 120,050 features described above were read into a matrix with their array coordinates. All arrays were processed as follows: (1) Probe preprocessing. MM intensities were subtracted from their corresponding PM values [57], as this yielded comparable or slightly better mapping results compared with other probe preprocessing methods (see Tables S1 and S2). Negative values were set to one. (2) Normalization. To normalize between arrays and to correct for spatial hybridization inhomogeneities on the array, the intensity of each feature following MM subtraction was divided by a spatial local median intensity. A local median was calculated for each feature as the median intensity of an invariant set of PM features (nonpolymorphic between the target and reference strains) that fell within a window of 30 by 30 features centered around the given feature. Nonpolymorphic features were identified with a one-tailed two-samplettest at apvalue range of 0.05–0.95. The analysis was implemented in Perl and can be downloaded at http://www.cgr. harvard.edu/MutationMapping. The user has the option of choosing between different preprocessing and normalization methods in the mapping software.
SFP identification. The SFPs considered in this study are array features whose mean hybridization intensities are significantly higher in the target strain relative to the reference strain. SFPs were identified using a one-tailed two-sample t test [58] between eight hybridization replicates of the target strain,W303,and the reference strain, SK1 atp¼106. The test statistictwithmdegrees of freedom for samplebcompared with sampleaat SFP numberi (ti,a,b)is given in
Equation 1 (formequation see [58], p. 129):
ti;a;b¼
IaðiÞ IbðiÞ ffiffiffiffiffiffiffiffiffiffiffiffiffiffiffiffiffiffiffiffiffiffiffiffiffi
S2
aðiÞ
na
þS
2
bðiÞ
nb
s ð1Þ
where a and b refer to the target strain and reference strain, respectively,IkðiÞdenotes the mean intensity of samplekonto SFP numberiacrossnkreplicate arrays, andS2kðiÞdenotes the variance betweennkreplicate hybridization intensities for samplekat SFPi.
The hybridization intensities are assumed to be normally distributed, a reasonable approximation according to our tests (unpublished data). Equal variances are not assumed for the two samples, as SFPs by definition refer to features with distinct intensities between two samples; variances were calculated from the observed replicate intensities.
with a prefect match to a unique sequence in S288c and no perfect match in YJM789. We hybridized the genomic DNA of S288c and YJM789 onto eight arrays each and SFPs were predicted using the array preprocessing and normalization, and SFP identification algorithms described above. The false-positive rate calculated for S288c/YJM789 can be used to estimate an FDR between any two strains at a given significance level and given number of array replicates. For this, an estimated number of false-positive SFPs between the two strains, calculated as the S288c/YJM789 false-positive rate times the estimated number of nonpolymorphic features between the two given strains, is divided by the total number of features scored as polymorphic.
Linkage analysis of a single pool of segregants.The linkage analysis algorithms were implemented in Matlab, and are available at http:// www.cgr.harvard.edu/MutationMapping. A linkage likelihood ratio
LLR(i),which represents the level of linkage of the ith SFP to the selected trait, was calculated for each of the 10,330 W303/SK1 SFPs along the genome (Equation 2). LLR(i) is the ratio between the probability that an SFP indexediis linked to the target locus and the probability that it is unlinked:
LLRðiÞ ¼Pmðt.ti;T;SÞ
Pmðt.ti;S;CÞ
ð2Þ
whereTdenotes the target strain, Sthe selected pool, and C the control pool.Pmðt.ti;a;bÞis the probability of observingt.ti,a,bin thet
test for SFPibetween sampleaand samplebatmdegrees of freedom (see Equation 1), computed as
Pmðt.ti;a;bÞ ¼
Z‘
ti;a;b
fmðtÞdt ð3Þ
wherefm(t) is thetprobability density withmdegrees of freedom. The
working hypothesis is that as the distance between the SFP and the target locus decreases, the mean intensity of the selected pool onto the linked SFP increases and becomes more similar to the mean intensity of the target strain than that of the control pool. For unlinked SFPs, the intensity of the selected pool should be similar to that of the control pool.
Based on the LLR values for all SFPs, we computed an LMS at equally spaced positions along the chromosome. These positions lie on a grid defined by an offsetx0(the position of theqthSFP from the
left-hand end of the chromosome) and an intervalk(in kilobases) (i.e.,
x(j)¼kjþx0[forj¼1,2,3,. . .jfinal]).jfinalis the index on the grid that
corresponds to the qth SFP from the right-hand end of the chromosome. At each grid point x(j), LMS(j) is defined as the geometric mean of the LLR scores of theqfirst SFPs to the left and
qSFPs to the right ofx(j)(i.e., a moving window containing2qSFPs, indicated here asXq(j)):
LMSðjÞ ¼ ½ P
k2XqðjÞ
LLRðkÞ21q ð4Þ
For all our linkage analyses,LMS(j)was plotted as a function ofx(j).
Here we usedk¼1 kb, andq¼25. This moving-window size of 50 SFPs (q¼25) was selected based on our simulations (described below), as this choice gave the lower mapping deviations among the window-size range tested (10–50 SFPs; an upper limit was set due to several considerations, including chromosome length and maintaining the ability to map multiple adjacent loci; see Figure S9). Peaks whose predicted centers lay within 50 kb from a telomere were resmoothed with a window of 36 SFPs, which we found to be optimal for telomeric regions using simulations. Our simulation model can be used to find the optimal range of smoothing window size for different exper-imental designs, such as backcrosses, or other organisms that display different recombination rates.
Identifying significant peaks.The significant peaks, representing the linkage regions, were identified at a 99% confidence level using permutation analysis [59]. Briefly, the chromosome positions of all SFPs were randomly assigned to the observed hybridization inten-sities of the selected and control pools, while the coordinates of the target strain intensities remained in place. No shuffling was done between replicate array intensities or between the intensities of the selected and control pools. For each shuffling, the LMS was calculated across the entire genome and the maximum LMS value was recorded. This process was repeated 1,000 times, and the maximum LMS values from each shuffling were ranked. The 99th percentile of the ranked values was taken as the significant peak threshold.
Estimating significant peak center. The boundaries of each significant peak were determined using an LMS cutoff that equals
10% of the maximum height of the given peak. The center of a significant peak is defined as the position midway between two SFPs that best divide the area under the peak into two equal halves or into two areas that are closest to an equal split of the peak area. The peak area is calculated as the area under the peak between its two boundaries. To avoid false-positive spikes, peaks that were narrower than 25 kb were discarded. A 95% confidence interval around the predicted peak’s center was estimated for each peak using computer simulations as described below.
Mapping simulations and 95% confidence intervals.We developed a computer model that simulates the entire linkage mapping process of a single selected locus. The linkage disequilibrium–based model assumes that recombination rate is proportional to the distance between two loci, and that two loci that are more than 50 cM apart are unlinked. The simulations are done at the level of the array hybridization intensities. The replicate hybridization intensities of the target strain and control pool,Ia(i),onto an SFP indexedi are
sampled from a normal distribution with a mean intensity,la(i) and
standard deviation, ra(i). These values are taken from observed
intensity data of sampleaat SFPi(Equation 6).
IaðiÞ ¼NðlaðiÞ;raðiÞÞ ð6Þ
The mean intensity of the selected pool onto SFPiis calculated according to Equation 7:
lSðiÞ ¼lCðiÞ þ ð1di;tÞ3ðlTðiÞ lCðiÞÞ;
di;t¼
jXiXtj
U ; ifd.1)d¼1
ð7Þ
wheredi,tis the relative genetic distance between an SFP at position Xiand a simulated target locus at position Xt, andUdenotes the
average unlinked physical distance. We assumedi,tis proportional to
the recombination rate between two loci, andU¼125 kb (;50 cM) based on an average recombination rate of 1 cM per 2.5 kb in yeast. A relative distance (di,t) of 1 represents no linkage, while a relative
distance of 0 represents 100% linkage.Trepresents the target strain,
Cthe control pool, andSthe selected pool. The standard deviation of the hybridization intensities of the selected pool onto SFPiis derived from the coefficient of variation (l/r) of the control pool, as shown in Equation 8:
rSðiÞ ¼rCðiÞ
lCðiÞ3lSðiÞ ð8Þ
Finally, the replicate hybridization intensities of the selected pool onto SFP i are sampled from a normal distribution with a mean intensity, lS(i), and a standard deviation, rS(i) (Equation 6). The
linkage analysis procedure described in the previous section is applied to the simulated hybridization intensities of replicate arrays. The absolute value of the distance between the estimated center of the detected significant peak and the actual position of the simulated target locus is recorded for each simulation. The mapping deviation is defined as the 95th percentile of the ranked deviations calculated fromnsimulation runs. In this work,n¼1,000.
Testing the effect of different factors on mapping precision. We used simulations to test the effect of various factors on mapping precision of a target locus positioned in the middle of an average-length yeast chromosome (700 kb; Figure 3). Five repeats of n¼1,000 simulation runs were done for each set of parameters tested. Aside from the varying factor, parameters were chosen according to those used or observed in our mapping test case, including an average recombination rate of 1 cM per 2.5 kb, SFP FDR of 6%, mean SFP density of 0.91 SFP/kb, four array replicates for the selected and control pools and eight replicates for the target strain, smoothing window size of 50 SFPs, and the SFP mean intensities and standard deviations of the target strain and control pool were randomly sampled without replacement from the distribution of replicate SFP intensities from our test case experiments. For each simulation run, a different subset of SFPs was randomly flagged as false positive, and the intensities of the false SFPs were randomly sampled from the observed intensities of the target strain at nonpolymorphic features.