554 www.hrmars.com/journals
Markov Chains Used to Determine the Model of Stock
Value and Compared with Other New Models of Stock
Value (P/E Model and Ohlson Model)
Abbasali Pouraghajan
Department of Accounting, Qaemshahr Branch, Islamic Azad University, Qaemshahr, Iran E-mail: [email protected]
Zeinab Javadiyan Kotenaie
MA student, Department of Accounting, South Tehran Branch, Islamic Azad University, Tehran, Iran
Faramarz Niazi
Member of the faculty, Faculty of Economics and Administrative Sciences, Institute of Higher Education, Allameh Mohaddes Noori, Noor, Iran
E-mail: [email protected]
Milad Emamgholipour
Young Researchers Club, Babol Branch, Islamic Azad University, Babol, Iran E-mail: [email protected]
Abstract
The aim of this study a comparison between the three models for the valuation of stocks in Tehran Stock Exchange. These three names PE, Olson or residual income and a Markov chain (Markov) are. Researchers in their study were to calculate the valuation of shares in the first two terms and then calculate the value of the enamel Markov chain to achieve a comparative mode. Result of research shows that almost in all cases, there is no significant difference between explanatory power of these models in determining shares value and investments in Tehran exchange market can for assessment of shares uses from these 3 models, but in most cases residual income assessment model by considering less standard error of regression can say, partly is better model in determining the company's value which maybe the main reason be have high explanatory power of two dependent profit variable overall, and book value of share holder's salary by using the overall accounting relation in comparison with two other models.
555 www.hrmars.com/journals
Introduction
Now a days with being universal of markets, transformation of competition, demand for new financial sources and ever increasing expectation of investors. Small companies took in to consideration more than last. Almost all of the financial decisions requires to determine the value added that will be reduced with these decisions.
Companies for making value not only compressed of share holders, but also from all the beneficiaries. Owners of small companies should know making maximum of value added needs using effective and useful sources. That requires planning and a careful control on companies operations. Planning and control on operation needs necessary ability to forecast and distinction between owners expectations in present and facture.
Ohlson (1995) that making value for share holders is agreeable with making value for the other beneficiaries and they are in a same way. There are different model of calculating stocks value. Like P.E and Ohlson models. That they have a lot of application because of there is simplicity
ut i these odels the speed of sto ks e efit growth is fi ed, so it’s a asi all weak ess. In markov ripple model the speed of stocks benefit growth is used as a variant.
In residual income model stock holders salaries cost consider clearly. In fact determining the value of stocks with using markov ripple and comparing it with these 2 methods [residual income, P.E] in accepted companies in Tehran stock market is the main purpose of author that it can follow his real purpose in research with replying the following question.
Which model between those 3 models is the best in research?
Research Objective
The purpose of this plan is presenting an assessment model of shares that is main tool in financial analysis for accounting the value of the company. This is the form of collection and usually like a briefed hypothesis and depend on dynamic of shares benefit is fix, but this plan trying to present a model which speed of growing the variable shares is considered of course a disconnected variable since the real rations of shares profit- price changing with passing time, this model have more fitness with fact. Our assessment model can enable the reader to realize the logical basis of stock exchange without involving in confusing scrutiny analysis. Our assessment model adding some new insight to the other methods analysis such as Hurly and Johnson and more specific clear that in long- term can`t scope from bankruptcy and the average time for bankruptcy can be calculate immediately.
Theoretic Framework
556 www.hrmars.com/journals future. By the way shares evaluation models presents buses for comparison and criterion measure men and revel ant factors to share value.
In addition by using some evaluations models when the shares "lover than real value" deals, the range of market efficiency rate can be calculated.
Mean while using the methods and various models for determining shares value can help to communities financial systems too match. Here, a brief description given about this research models.
P.E Model
P.E is briefed (price) p. to corning per share (E.P.S). As if appears from that`s name for calculate P.E the last price of a company`s shares is derided to benefit of per shares.
Mostly P.E calculated on dates which the companies' disclosure data [often 3 months E.P.S]. Sometimes this P.E is called protracted P.E which is based on calculating the last E.P.S, but sometimes for calculating P.E is uses estimating E.P.S, usually this E.P.S expresses next years estimating profit. In this case calculated P.E is called estimated van or P.E guard. Sometimes calculating the P.E has third method which is based on average of 2 past season and estimate 2 remaining season of the year. There is no main difference between these three kinds of methods.
The big problem about calculating P.E is companies that are unprofitable then they negative E.P.S. some people believe in existing the negative P.E, a group of people believe in P.E on zero in this status. Historically in Tehran stock market usually the average of P.E in range of 3.2 to 13.2 is experienced. In this range the swing of P.E is mainly depend on economic condition of per time. At present in Tehran exchange Market the average of all accepted companies P.E about 8.2.
Ohlson Models or Residual Income
The Ohlson `s valuation model is taken from regulated cash profit on base of this model the value of shares is equal by clerical value of shares and present value of expected future revenues.
The general for mullah is as follows:
t t t
t
CSI
BVE
MVE
0
1
2
MVEt: the value of stock market at the end of the year.
557 www.hrmars.com/journals BVEt: the book value of share holders right at the end of the year.
Per shire's residual income is equal to profit of per share minus cost of capacity in per share. The value of per company's share is calculated by:
t I t t t I t t t
r
B
r
ROE
B
r
RI
B
V
)
1
(
)
(
)
1
(
1 0 0 0
In comparison with other rate value, the value is sooner realized in the residual income model.
Markov's Chain Model
In the Gordon and shypro's model the share's profit increasing with fix speed. Of course this have more theoretical aspect to practical applies. A newest hypothesis which presented by harly and Johnson is speed of growing shares as collection of same separated variant distributed and randomly real price. Consider an efficient stock exchange, a markov that the price of share refluxing all of existing information. Suppose that entrepreneurs have same expectation, if t be the time which assessment is currying out, k time index, p shares price. d, shares profit r amount of profit. For haring efficient market shares prices function as this equation:
r P d EP k k k
k
1
1
E is amount of eventual predicted. Samuelson shows that:
1
1 i i
t r r i d E P
That we suppose:
i t r i p E
i
lim
Amount of demanded profit is changing with elapsing time. In condition of shares profit follows as this equation:
k k
k
g
d
d
1
1,... 1 , t t k
g: Growth factor can take one of the quantities condition 0
, 2
1
g g
At the markov fix chain y dynamic breaking out in 2 status which ij is conditional probability i
k g
g 1
Whenever i
k g
g
* ij iz 1
Probability of xki which status of i in time of k happens, follows as various equation:
2 21 1 11 1
1 k k
k x x
558 www.hrmars.com/journals
2 22 1 12 2
1 k k
k x x
X
Literature Review
Pourheydari et al. (2005), by study of in for mat ion content of accounting profit and company's book value indetermination of accepted company's shares value at Tehran stock market during 1995- 2003 concluded that, first remarkable part of company's value change determine by profit, secondly, the main power of total the profit and company's book value explanatory is about profit, third, book value of company in comparison with per shares profit has not suitable explanatory power.
Mahmoudabadi (2006) with study of 102 companies listed in Tehran stock exchange during 1993- 2002 with a combined approach to the valuation model of Ohlson 1995 concluded that the dynamics is known a method to value the company has good predictive ability. Berger et al. (1996) concluded that, compared with a profit to book value in explaining stock price changes are more important.
Brief (2007), concluded that assessment model of profit's unusual growth, more complicated than assessment model of remaining profit. This complicating is for growing and also for inter predation of unusual profit's growth comparing with remaining profit.
Sadeghi Batani (2005) to study of filtering price rules method, amount of dealing, number of dealing, and number of paying buyer analysis and reach to result that we can design for rules of dealing shares based on the volume and buyer's number and number of dealing times, but we can't by using them get more efficiency than purchase and keeping method.
Research Hypothesis
By considering above hypothesis some assumptions is editing and examined by follows:
H1: using the Markov chain model due to better evaluation of shares value. H2: using the P.E model due to better evaluation of shares value.
H3: using the Ohlson`s model due to better evaluation of shares value.
Statistical Society and Sample
Statistics society is the research of accepted companies in Tehran exchange market. A selective sample after bellow restrictions is selected among statistics society this restrictions is:
1. Sample companies financials year be equal with each other and leading to march of each year.
559 www.hrmars.com/journals 3. During the period of studying companies have no pause dealing.
4. No companies except investment and financial mediated and insurance.
5. Necessary information of companies be available.
6. During the period of studying companies have no loss.
Bused on this and after above restrictions 64 companies during (8 years) 2004- 2008 has above conditions and by consider this sampling is done and all companies for studying is selected.
Study Method
For explain the theoretical basic of studied subject, from related financial studying with research topic as told in last section, is used. For analysis and examine research hypothesis solidarity method is selected. In regression analysis for analyzing and studying relation between variables studies, using from a views, spss 16 software and klomogrof Esmirnof (k- s) test, for studying that data's distributing is normal and from description- devotion scale- average of regression analysis (multi variables of regression for comparing models) using for comparing models. Freed man test used for classifying various groups.
Empirical Result
First hypothesis test
Hypothesis: using Markov chain model due to better assessment of shares value.
Hon son's test result for hypothesis about mark of chain is in bellow table. Hon son tested for confirming the guess of exist various regimes. Amount of testing statistics F, P- value assumption zero (absence of non linear or not existing of threshold) rejecting in confidence level of 0/01. Therefore bused on Hon son's test considered period's data have 2 regimes.
Table 1: Result of Hon son's test to Hypothesis about Markov chain
amount of threshold -3/3300
amount of statistics test 9 /57
P- value 3/339
560 www.hrmars.com/journals
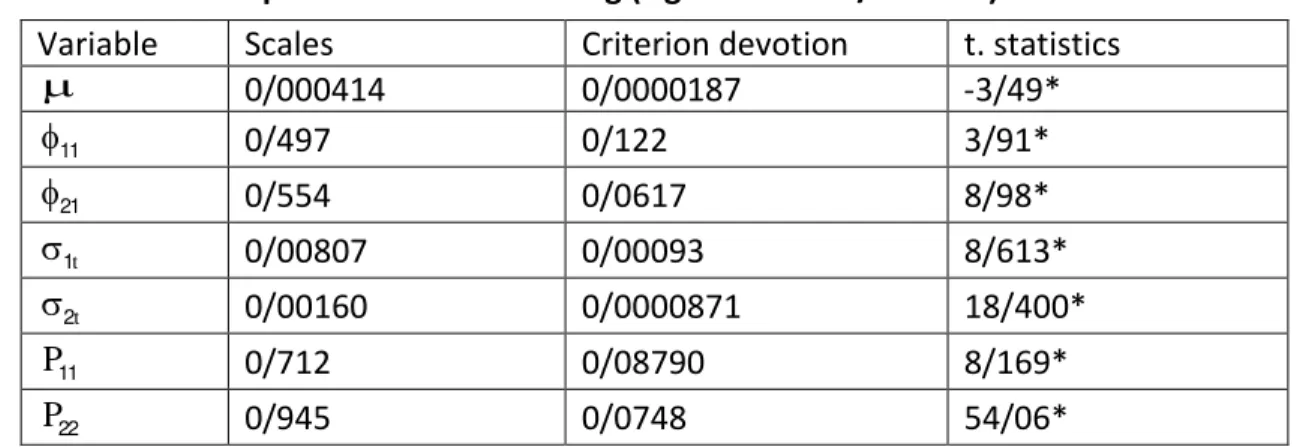
Table 2: Markov`s displacement model fitting (significant in 0/07 level)
The table shows that all of considered statistics in level of 0/01 are significant so Markov`s displacement model with fix average and various variance is good estimate for considered data. By amount of fitted for O1t confirmed that deviation criterion of first regim`s disorders
sentences is greater than O2t deviation criterion of second regim`s disorders sentences. Also the value obtained for transition probability shows that if efficiency of market in past period be
O
St , with probably of %71 will in next period be in previous status again, but the gain result from possibility of supplement is as, if the market in past period be with high variance, with probably %29 to turbulence or status St 1 moving. If the market in past period be with low variance almost with probability of 0/05 more to high variance also. Bused on given formula amounts of day's average in market in high turbulence status 6 days and amount of day's average when efficiency in low turbulence are 20 days. If efficiency diagram design for this period we can tell in the periods which market was high turbulence, average of required days to moving efficiency to regime with lower turbulence as intuitive, almost is that the estimated value in mark of`s displacement model.
Table 3: Markov displacement models recognizing test
Yang statistics, box is also confirmed that the above estimation is suitable for data efficiency and assumption of wrong sentences ran doming is verified. On the other rand mark of`s displacement model clearing for stock dealers some interesting points when the market stands in higher variance. determining the amount of variance as independent functional from pas period variance and shocks whenever market stand in each regime and also predicting amount of days which market in each regime, as known a application tools for stock dealers.
t. statistics Criterion devotion Scales Variable * 9 / 0 -33339 5 / 3 333999 / 3 * 9 / 0 911 / 3 9 5 / 3 11 * / 3195 / 3 779 / 3 21 * 190 / 333 0 / 3 33 35 / 3 t 1 * 933 / 9 3333 59 / 3 33913 / 3 t 2 * 91 / 3 5 3
561 www.hrmars.com/journals
Result
In Markov `s model these points are considerable:
By increasing the number of property, Matrix covariance's volume of accountant be too large. No low or nigh border for per shares of property in total of shares is but in act maybe there are a lot of reason for restriction of property's are in total shares.
General criterion of risk is variance or its second stem, deviation criterion. This criterion, for a property which has normal distribution and dealing in a efficient market is acceptable criterion if these two quality doesn't exist, variance is not good for showing the shares value.
Second hypothesis test
Hypothesis: using the P.E model due to better assessment of shares value. In this step for doing the hypothesis test of research, bused on Dowdel model, classifying company- by assaing both of P.E and P.B ratio done in years. So company's classifying ass follow this table:
Table4: Company's classifying
P/E P/E P/E
7 / 7
P/E< <
3
Low
/5
7
<P/E<
5
medium
5
P/E> or
3
P/E<
High
P/B P/B<1/0 Low
Declining
companies Other companies
Rotational companies
P/B 1/0>P/B>7/0
medium Other companies
Competitive
companies Other companies
P/B P/B>7/0 High
Grown
companies Other companies
Growing companies
562 www.hrmars.com/journals
The table 5: the result of relation between significant P.E with variables in various grouping
Total grouping
P/E Grouping base on
P/B Grouping base on
P/ E Level of confide nt Coefficie nt solidarity Variab le Level of confide nt Coefficie nt solidarity Variab le Level of confide nt Coefficie nt solidarity Variab le % 950 / 3 -RI 7 % 133 / 3 RI High 7 % 109 / 3 -RI
High RI -3/10 % ROE 0.205 %
% 1 1 / 3 -ROE Low 7 % 9 / 3 -RI% Low % 0 5 / 3 -ROE 7 % 199 / 3 RI mediu m % 059 / 3 -RI mediu
m RI -3/109 %
% 7 7 / 3 -ROE Total grouping
P/E Grouping base on
P/B Grouping base on
P/ B Level of confide nt Coefficie nt solidarity Variab le Level of confide nt Coefficie nt solidarity Variab le Level of confide nt Coefficie nt solidarity Variab le % 997 / 3 RI % 9 9 / 3 RI High % 179 / 3 -RI High % 507 / 3 ROE % 79 / 3 ROE 7 % 931 / 3
% RI
% 70 / 3 RI Low % 17 / 3 ROE Low % 597 / 3 ROE % 33 / 3 ROE % 797 / 3 RI Mediu m % 933 / 3 ROE Mediu
m % RI 3/000 %
% 7
/ 3
ROE
In research was observed of that remaining profit changes between 3 P.E groups was different and stability of P.E and P.B in grouping base on various compounds of these ratios is different. Fairfield found that P.B are more stable than P.E and by passing time ROE more stable than rate of remaining shares value's growth.
The result shows that in each grouping according to P.E and P.B, ratio of P.B keeps it's relation with ROE and coefficient of relation with grouping is also get better and this shows that P.B is more stable than P.E. to tally the result of solidarity test in quintet groups which grouping of them base on both P.E and P.B is done, the status of ratios in relation with studied variables better shows, especially in comparison with status which using only one of these ratios.
563 www.hrmars.com/journals of P.E and P.B in company is low (first group) which is called declining companies, shows that in this group by coming down of P.E ratio shares value and it's change and efficient of shares value's owners salary will increase. Then using of this ratio and also P.B ratio can help the investment in predict of shares value and it's changes. Lack of significant relation P.E ratio with percent of shares value's changes
%Rt
and plus solidarity of P.B ratio with this variable- when both of P.B and P.E is in medium level, shows that for predicting the shares value in companies which are competitive, we can use P.B ratio for predict.Result
Everything or the last word is not told about shares value but in comparison the companies of the industry, the whole of market or P.E`s historical process of a company is profitable.
Remember that:
A) P.E is a ratio and getting from dividing the P (price) or day's price shares of E (Eps) or profit of per share.
B) We have 3 kinds of EPS called protracted, future and medium.
C) Historically average of P.E`s stands in efficient of 3/2- 13/2.
D) In theory per share's P.E tell us the investments willing now much Rials pay for per Rial profit.
E) Better analysis from P.E is, that is the reflex of market's optimistic from future growth of a company.
F) P.E in comparison with market's price is better index for share value.
G) Without considering the rate of industry growth, it is meaningless talking about high or low in P.E.
H) Change in base of accounting including several allowed method for profit (Eps), getting difficult in analysis P.E.
I) don't only by relying P.E coefficient deal the shares.
Third Hypothesis Test
Hypothesis: using the Ohlson`s model due to better assessment of shares value.
564 www.hrmars.com/journals acceptable linear relation trying to present a regression model. Then at first Pearson's solidarity coefficient table which between P.E ratios of Ohlson and mark of during the 8 years calculated, with amount of coefficient significant possibility (P- value) presented.
Table 6- Pearson's solidarity coefficient between dependent and independent variables of research
Markov Ohlson
P/E Variable name
01 / 3 19
/ 3 31
/ 3 -
Share value
330 / 3
P =
39 / 3
P =
51 / 3
P =
As observed from above table, Pearson's solidarity coefficient between mentioned variables tells that between shares value with P.E, Ohlson and mark of studied companies has a linear relation, which this relation between shares value and mark of is stronger than other relations. Also between shares value with P.E during above 8 years has no significant relation. In this part for better and more accurate study between relation of shares and Ohlson researchers want to find a model by help of regression for ration of per share's price with remaining profit, so at first in exam followed by this assumption:
H0: price's ratio on book value of per share has no significant linear effect on remaining profit.
H1: price ratio on book value of per share has significant linear effect on remaining profit.
Table 7: Variance's Analysis
Source of
changes
Total of
squares
Free degree
Average of
squares
Statistics testing
P-value
Regression 099/0 9 099/1
13 /
9 3/333
Error 9950/0 11 95/5
total 9799/1
Table 8: Summary of Regression Model
Parameter estimate
Standard error
Statistics testing
Free degree
P-value
Fix regression 90/1 3/ 7 99/07 11 3/333
Slope
regonressi 9/9 3/17 9/0 11 3/333
R=0/47, R2=0/23, 2 adj
R =0/21, ˆ2=4/22
565 www.hrmars.com/journals By considering the above table observes that the queened value probably is equal with 0/000 which is smaller than significant level of test that 0/05 considered.
(P- value = 0/0000 < a= 0/05). So, hypothesis of zero is rejected, and then with coefficient confidence of %95 can say that a significant linear relation is between ratios of price on book value of per share in studied companies with their remaining profit.
X is ratio of price on per share's book value. Also reported in above table the value of regression determination coefficient is equal to %23 and this shows that %23 of shares value's changes can be explain by assist of price ratio's variable on book value of per share.
Now we will find a model by helping regression for efficiency of share holders' salary, so at first this hypothesis is proposed:
H0: efficiency of share holders' salary has no effective significant linear on shares value.
H1: efficiency of share holders' salary has effective significant linear on shares value.
Table 9: Variance's Analysis
Source of
changes
Total of
squares
Free degree
Average of
squares
Statistics testing
P-value
Regression 997/3 9 999/ 5
91 /
15 3/333
Error 931 /1 11 91/19
total 9799/1
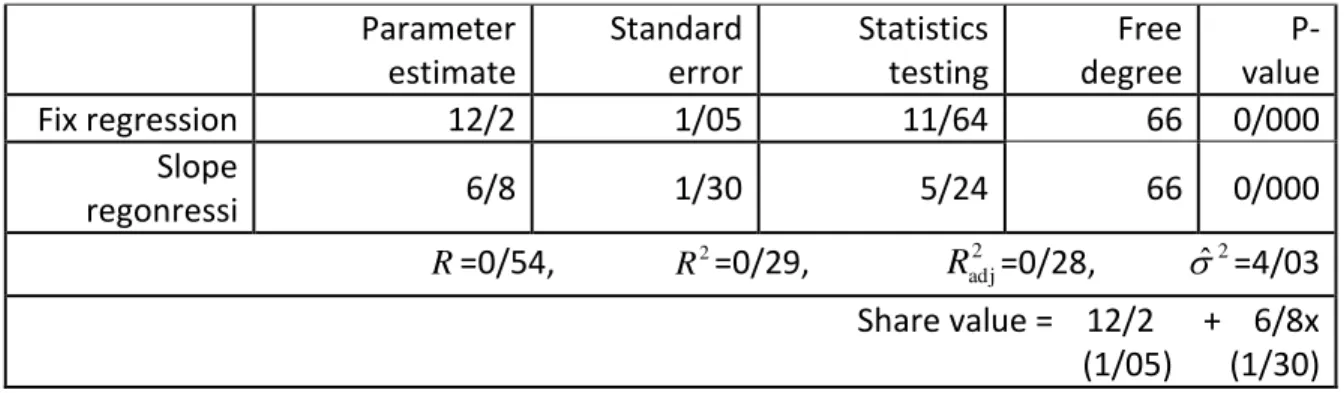
Table 10: Summary of Regression Model
Parameter estimate
Standard error
Statistics testing
Free degree
P-value
Fix regression 91/1 9/37 99/19 11 3/333
Slope
regonressi 1/ 9/03 7/19 11 3/333
R=0/54, R2=0/29, 2 adj
R =0/28, ˆ2=4/03 Share value = 12/2 + 6/8x (1/05) (1/30)
566 www.hrmars.com/journals (P- value = 0/0000 < a= 0/05). So, hypothesis of zero is rejected then with coefficient confidence of %95 can say there is a significant linear relation between efficiency of share holders in studied companies and their shares value.
X is efficiency of share holders' value. Also reported in above table of regression determination coefficient R2 is equal with %29 and this shows that %29 of shares value can be explain by assist of efficiency variable of share holders salary. As observe in table 11, statically there is no significant difference between explanatory powers of these models in determining shares value but we can say that with considering all of criterions, almost the model of residual income assessment is stronger model than P.E and P.B stronger than Markov in determining shares value at Tehran exchange market.
In this research by considering table 12, as P- value in all of tests has been less than 5%, all of independent and dependent variables during research was in stable level.
Table11: Comparison of models explanatory power
Adjustment determining coefficient
Mean square error (MSE)
Regression statistics (F)
Okaic criterion (AIC)
Shwartz criterion (SBIC)
Olson 91/46% 829108 41/75 30/316 31/399
P/E 90/75% 863211 38/62 30/395 31/468
Markov
chain 90/71% 864718 38/48 30/398 31/472
Table12: Stable of research variables with testing the root of consolidated unit
Im and Shin(IPS) Philips pron Augmented Dickey-Fuller
Statistics testing -141/871 819/340 1021/34
P-value 0/0000 0/0000 0/0000
Result
The strong point of Ohlson model and (residual income) are: - Last value forming most part of shares value.
- Entrance of residual income model is accountant information which is not available easily. - This model for pricing companies which don't pay share's profit or their cash flow is negative easily is used.
- When the future cash flow is not predictable is used. - Weak probably point of residual income model is:
567 www.hrmars.com/journals Based on strong and weak point of presented on above, residual income model uses in:
- The company doesn't pay profit or divided share profit in future is not predictable. - Cash flow of company in predictable future is negative.
- Lack of confidence due to high last value estimation.
- We can to tell that residual income rate model suppose that relation between book value of per share in period t (Bt) book value of per share in period t-1 (Bt-1) and divided shares profit in
period t (Dt) is established:
Bt = Bt-1 + EPSt - Dt
In some cases which aren't above equation (like when company to redemption shares or granted the authority of buying the shares to managers and employees) can not use the residua income model.
Conclusion
One of the important information contained in company's financial statement, is accounting profit, most of financial analysis in rate of shares price and assessment of economic enter prices action using it. Residual income model is a practicing method in financial analysis text and shares value's assessment technic. In Markov chain model speed of growing the shares profit consider as variable which in this condition is closer to reality. Result of research shows that almost in all cases, there is no significant difference between explanatory power of these models in determining shares value and investments in Tehran exchange market can for assessment of shares uses from these 3 models, but in most cases residual income assessment model by considering less standard error of regression can say, partly is better model in determining the company's value which maybe the main reason be have high explanatory power of two dependent profit variable overall, and book value of share holder's salary by using the overall accounting relation in comparison with two other models.
Research Suggestions
Attention to be confirmed Third hypothesis (using the Ohlson`s model due to better evaluation of shares value) is suggested to actually and potentially investors use from Ohlson model for price assignment and share value, timely purchase and to sell.
References
Berger, P.G., Ofek, E., & Swary, I., (1996). Investor valuation of the abandonment option. Journal of Financial Economics, Vol. 42, No. 2, pp. 257-287.
Brief, R.P., (2007). Accounting Valuation Models: A Short Primer. Abacus, Vol. 43, No. 4, pp. 429-437.
568 www.hrmars.com/journals Ohlson, J.A., (1995). Earnings, book values, and dividends in equity valuation. Contemporary Accounting Research, (Spring), pp. 661-687.
Pourheydari, O., Soleimani amri, G., & Safajo, M., (2005). investigates the value-relevance of earnings and book values with market value of listed companies in Tehran Stock Exchange. Journal of Accounting and Auditing Review, Vol. 12, No. 4, pp. 3-19.