www.atmos-chem-phys.net/16/2309/2016/ doi:10.5194/acp-16-2309-2016
© Author(s) 2016. CC Attribution 3.0 License.
Simulating secondary organic aerosol in a regional air quality model
using the statistical oxidation model – Part 1: Assessing the influence
of constrained multi-generational ageing
S. H. Jathar1,2, C. D. Cappa2, A. S. Wexler2, J. H. Seinfeld3, and M. J. Kleeman2 1Mechanical Engineering, Colorado State University, Fort Collins CO, USA
2Civil and Environmental Engineering, University of California, Davis CA, USA 3Chemical Engineering, California Institute of Technology, Pasadena CA, USA
Correspondence to:C. D. Cappa ([email protected]) and M. J. Kleeman ([email protected])
Received: 19 August 2015 – Published in Atmos. Chem. Phys. Discuss.: 24 September 2015 Revised: 8 January 2016 – Accepted: 13 January 2016 – Published: 26 February 2016
Abstract. Multi-generational oxidation of volatile organic compound (VOC) oxidation products can significantly al-ter the mass, chemical composition and properties of sec-ondary organic aerosol (SOA) compared to calculations that consider only the first few generations of oxidation re-actions. However, the most commonly used state-of-the-science schemes in 3-D regional or global models that ac-count for multi-generational oxidation (1) consider only functionalization reactions but do not consider fragmenta-tion reacfragmenta-tions, (2) have not been constrained to experimen-tal data and (3) are added on top of existing parameter-izations. The incomplete description of multi-generational oxidation in these models has the potential to bias source apportionment and control calculations for SOA. In this work, we used the statistical oxidation model (SOM) of Cappa and Wilson (2012), constrained by experimental lab-oratory chamber data, to evaluate the regional implications of multi-generational oxidation considering both functional-ization and fragmentation reactions. SOM was implemented into the regional University of California at Davis / Califor-nia Institute of Technology (UCD/CIT) air quality model and applied to air quality episodes in California and the eastern USA. The mass, composition and properties of SOA pre-dicted using SOM were compared to SOA predictions gen-erated by a traditionaltwo-productmodel to fully investigate the impact of explicit and self-consistent accounting of multi-generational oxidation.
Results show that SOA mass concentrations predicted by the UCD/CIT-SOM model are very similar to those predicted by a two-product model when both models use parameters that are derived from the same chamber data. Since the two-product model does not explicitly resolve multi-generational oxidation reactions, this finding suggests that the chamber data used to parameterize the models captures the majority of the SOA mass formation from multi-generational oxida-tion under the condioxida-tions tested. Consequently, the use of low and high NOxyields perturbs SOA concentrations by a
fac-tor of two and are probably a much stronger determinant in 3-D models than multi-generational oxidation. While total predicted SOA mass is similar for the SOM and two-product models, the SOM model predicts increased SOA contribu-tions from anthropogenic (alkane, aromatic) and sesquiter-penes and decreased SOA contributions from isoprene and monoterpene relative to the two-product model calculations. The SOA predicted by SOM has a much lower volatility than that predicted by the traditional model, resulting in better qualitative agreement with volatility measurements of ambi-ent OA. On account of its lower-volatility, the SOA mass pro-duced by SOM does not appear to be as strongly influenced by the inclusion of oligomerization reactions, whereas the two-product model relies heavily on oligomerization to form low-volatility SOA products. Finally, an unconstrained con-temporary hybrid scheme to model multi-generational oxida-tion within the framework of a two-product model in which
parameterization is considered. This hybrid scheme formed at least 3 times more SOA than the SOM during regional simulations as a result of excessive transformation of semi-volatile vapors into lower volatility material that strongly partitions to the particle phase. This finding suggests that thesehybridmulti-generational schemes should be used with great caution in regional models.
1 Introduction
Organic aerosol (OA) is generally the dominant compo-nent of submicrometer-sized atmospheric particulate matter (Jimenez et al., 2009), which plays an important role in the energy budget of the earth (Pachauri et al., 2014) and the health effects of air pollution (Bernstein et al., 2004). De-spite its prominence, OA is the least understood component of atmospheric aerosol. Large-scale chemical transport mod-els are the essential tool to simulate concentration distribu-tions, which are needed to form strategies to mitigate, the climate and health impacts of atmospheric aerosols.
OA is a complex mixture of thousands of different com-pounds that have a wide range of properties (Goldstein and Galbally, 2007). OA can be directly emitted to the atmo-sphere in particulate form (so-called primary organic aerosol; POA) or it can be formed in situ by the oxidation of volatile organic compounds (VOCs) to yield lower volatility products that condense into the aerosol phase, so-called secondary or-ganic aerosol (SOA). This latter route is generally the pre-dominant one to form OA. Continuous oxidation of VOCs and their oxidation products yields a broad range of prod-ucts, including those that have intermediate and low volatil-ity. The importance of suchmulti-generational oxidationon SOA production has been widely established in laboratory chamber experiments (Chacon-Madrid et al., 2010, 2013; Yee et al., 2013; Donahue et al., 2012; Chhabra et al., 2011; Henry and Donahue, 2012). Multi-generational oxidation in-cludes the initial formation of oxidized products of lower volatility as well as the loss of SOA mass after initial for-mation owing to fragmentation reactions. For example, ex-periments performed with the potential aerosol mass (PAM) reactor, which aims to simulate prolonged VOC oxidation, are always associated with formation followed by destruction of OA mass (Lambe et al., 2012). Simulations that capture this behavior require inclusion of multi-generational oxida-tion. In addition to altering predicted SOA mass, inclusion of multi-generational oxidation is expected to alter the ox-idation state of OA, which has important repercussions for OA properties (e.g., water uptake, toxicity) (Jimenez et al., 2009).
Traditionally, models of SOA formation in chamber ex-periments have represented SOA formation from VOCs us-ing two to four surrogate products per VOC, the yields for which have been parameterized to reproduce observed levels
In this work, we use the statistical oxidation model (SOM) of Cappa and Wilson (2012) to model the multi-generational oxidation reactions inherent in SOA formation. The SOM provides an efficient framework to track the experimentally constrained chemical evolution and gas–particle partition-ing of SOA uspartition-ing a carbon and oxygen grid. In Jathar et al. (2015), we detailed the coupling of the SOM with the gas-phase chemical mechanism SAPRC-11 (Carter and Heo, 2013) within the UCD/CIT regional air quality model and used the new model to make predictions over the South Coast Air Basin (SoCAB) in California and the eastern United States. Here, we use the UCD/CIT-SOM model to investi-gate the influence of constrained multi-generational oxida-tion on the mass concentraoxida-tions and properties of SOA and contrast those results against predictions from a traditional two-product model and an unconstrained multi-generational oxidation model.
2 Model description and simulations 2.1 Air quality model
The UCD/CIT air quality model is a regional chemical trans-port model (CTM) (Kleeman and Cass, 2001) used here to simulate SOA formation for two geographically distinct do-mains and time periods: (1) the state of California simulated at a grid resolution of 24 km followed by a nested simu-lation over the SoCAB at a grid resolution of 8 km from 20 July to 2 August 2005, and (2) the eastern half of the USA simulated at a grid resolution of 36 km from 20 Au-gust to 2 September 2006. Details about the latest version of the UCD/CIT model are provided in Jathar et al. (2015) and summarized in Table S1 in the Supplement. Briefly, an-thropogenic emissions for California were based on the Cal-ifornia Regional PM10/PM2.5 Air Quality Study (CRPAQS) inventory of 2000 but scaled to match conditions in 2005. FINN (Fire Inventory for National Center for Atmospheric Research) (Wiedinmyer et al., 2011) and MEGAN (Model of Emissions of Gases and Aerosols from Nature) (Guen-ther et al., 2006) were used to calculate wildfire and bio-genic emissions in California. Anthropobio-genic and wildfire emissions for the eastern USA were based on the 2005 Na-tional Emissions Inventory (NEI), and biogenic emissions were estimated using BEIS (Biogenic Emissions Inventory System) version 3. Hourly meteorological fields were gen-erated using the Weather Research and Forecasting (WRF) v3.4 model (www.wrf-model.org). National Center for En-vironmental Protection’s NAM (North American Mesoscale) analysis data were used to set the initial and boundary con-ditions for WRF. Gas- and particle-phase initial and hourly varying boundary conditions were based on the results from the global model MOZART-4/NCEP (Emmons et al., 2010). Gas-phase chemistry was modeled using SAPRC-11. In all simulations, POA was treated as non-volatile, yet
absorp-tive, as per the treatment in the regulatory Community Mul-tiscale Air Quality (CMAQ) version 4.7 model (Carlton et al., 2010). As such, contributions of semi-volatile and inter-mediate volatility organic compound emissions (which are commonly assumed to originate from the evaporation of and co-emitted with POA) to the SOA burden were not consid-ered in this study.
2.2 SOA models
Four types of SOA models are compared in this work: (1) a
Basetwo-product model that is equivalent to the SOA model used in CMAQ and representative of SOA models used in most chemical transport (Carlton et al., 2010) and global climate models (Henze et al., 2008); (2) a modified ver-sion of the Base model,BaseM, which uses the two-product framework, but in which the SOA formation parameters were determined using newer chamber data; (3) a SOM model (Cappa and Wilson, 2012) in which multi-generational ox-idation is accounted for through semi-explicit representa-tion of progressive generarepresenta-tions of gas-phase oxidarepresenta-tion of the products and precursors of SOA, and which was parameter-ized based on the same data set as the BaseM model; (4) a
cascadingoxidation model, wherein ageing of semi-volatile products was accounted for a posteriori using ageing rates derived from separate experiments. All of the SOA models utilize fully dynamic gas–particle partitioning for OA species as in Kleeman and Cass (2001). The following sub-sections describe the four SOA models. To aid the reader, a conceptual schematic comparing various SOA models (e.g., 2-product, SOM, VBS) is provided in Fig. S1.
2.2.1 Base
The Base model simulated SOA formation as per the path-ways and parameters in the CMAQ model version 4.7 (Carlton et al., 2010) from the following gas-phase pre-cursors: long alkanes (ALK5), benzene (BENZENE), low-yield aromatics (ARO1), high-low-yield aromatics (ARO2), iso-prene, monoterpenes (TRP1) and sesquiterpenes (SESQ). The species in parentheses are the model species represent-ing those compounds in SAPRC-11 (the gas-phase chem-ical mechanism used here). The pathways considered in-clude (1) oxidation of the above-mentioned precursors to form non-reactive semi-volatile products that partition into the particle-phase (Odum et al., 1996) (the so-called two-product model, where model parameters were previously de-termined from fitting chamber data); (2) acid enhancement of isoprene SOA (Surratt et al., 2007). SOA formation from aromatics is NOx dependent; low levels of NOx result in
higher SOA formation and vice-versa. The Base model was extended to include particle-phase oligomerization (Kalberer et al., 2004), for which particle-phase semi-volatile com-ponents were converted to non-volatile comcom-ponents with
koligomer=9.6×10⁻⁶
run in two configurations, with and without oligomerization reactions: Base and Base-OLIG.
2.2.2 Base modified
Themodifiedversion of the Base model, termed BaseM was created to facilitate a true evaluation of multi-generational oxidation in a two-product model framework. The BaseM model: (1) used recent chamber data (Jathar et al., 2015) from California Institute of Technology to determine alter-nate two-product model parameters; and (2) did not include acid-catalyzed enhancement of isoprene SOA and oligomer-ization reactions. The two-product fit parameters and data sources are listed in Table S2. Note that the long alkane
BaseM parameterization has been developed using experi-mental results for SOA formation fromn-dodecane (Loza et
al., 2014).
2.2.3 Statistical oxidation model
The SOM parameterizes multi-generational oxidation us-ing a two-dimensional carbon-oxygen grid to track the evo-lution of gas- and particle-phase organic products arising from the oxidation of SOA precursors (Cappa and Wilson, 2012; Cappa et al., 2013; Zhang et al., 2014). This evolu-tion through the SOM grid is VOC-specific and defined by six parameters: (P1–P4) yields of the four products that add 1, 2, 3 and 4 oxygen atoms, without fragmentation; (P5) the probability of fragmentation; and (P6) the decrease in vapor pressure (or volatility) of the species per addition of oxy-gen atom. Details of the implementation and parameteriza-tion of the SOM model in the UCD-CIT are presented in Jathar et al. (2015). Briefly, six SOM grids with precursor-specific parameter sets were used to represent SOA forma-tion from the same precursor classes in the Base model. Pa-rameter sets were separately determined from high NOx(low
yield) and low NOx (high yield) chamber data as the SOM
in its current configuration cannot yet account for continu-ous variation in NOx. The SOM parameters were completely
determined from explicit fitting to chamber data where the number of fit data points greatly exceeded the number of fit-ting parameters (6). Thus, the SOM model will be referred to as constrained multi-generational oxidation. The SOM pa-rameters and data sources are listed in Table S3.
The SOM model parameters used in the present study were determined without accounting for losses of vapors to cham-ber walls, which can lead to a substantial underestimation of the actual SOA formation potential of a given precursor (Matsunaga and Ziemann, 2010; Zhang et al., 2014). A com-panion paper evaluates vapor wall-loss effects on the SOM results (Cappa et al., 2015). The SOM parameter fits were derived using dynamic gas-particle partitioning assuming an accommodation coefficient of unity, which tends to mini-mize the influence of vapor wall loss (McVay et al., 2014), and thus represents a conservative lower bound of SOA
for-mation. The SOM model was additionally extended to con-sider the influence of oligomerization reactions by allowing irreversible conversion of particle-phase SOM species into a single non-volatile species using the samekoligomer as in
the Base model, referred to as SOM-OLIG. Oligomerization reactions were added a posteriori to the SOM model, i.e., oligomerization reactions were not included as part of the data fitting and parameter determination and are included in the present study only as a sensitivity case.
2.2.4 Cascading oxidation model
Additional simulations were performed using a contempo-rary multi-generational oxidation scheme, the cascading ox-idation model (COM). The COM builds on the two-product Base model but allows for additional reaction of the semi-volatile products using the scheme of Baek et al. (2011). Briefly, the two semi-volatile products from a given pre-cursor react with OH, with the highest volatility product converted into the lowest volatility product and the lowest volatility product converted to a non-volatile product (see Supplement section on Cascading Oxidation Model). Like most other schemes that have thus far been used to represent multi-generational oxidation of SOA from traditional VOCs in 3-D models (Lane et al., 2008), COM does not consider fragmentation reactions, is not fit or constrained to experi-mental data and adds these ageing reactions on top of an ex-isting parameterization. The COM model will be referred to asunconstrainedmulti-generational oxidation.
2.3 Simulations
Table 1 lists the simulations performed in this work. We per-formed two simulations with the Base model (with and with-out oligomerization), two with the BaseM model (low and high yield), four with the SOM model (low and high yield and with oligomerization accounted for) and one with the COM model. These nine simulations were performed for both domains: SoCAB and the eastern USA. Simulations were performed for 19 days with the first 5 days used for spin-up. For the SoCAB, each simulated day using the SOM required approximately 4 h of elapsed time (on 40 Intel i5-3570 processor cores) so a 19-day episode was simulated in less than 4 days. For the eastern USA, each simulated day re-quired approximately 9 h of elapsed time so a 19-day episode was simulated in about 8 days. The SOM simulations were approximately 4 times slower than the BaseM simulations on account of the large number of model species.
3 Results
3.1 Base vs. BaseM
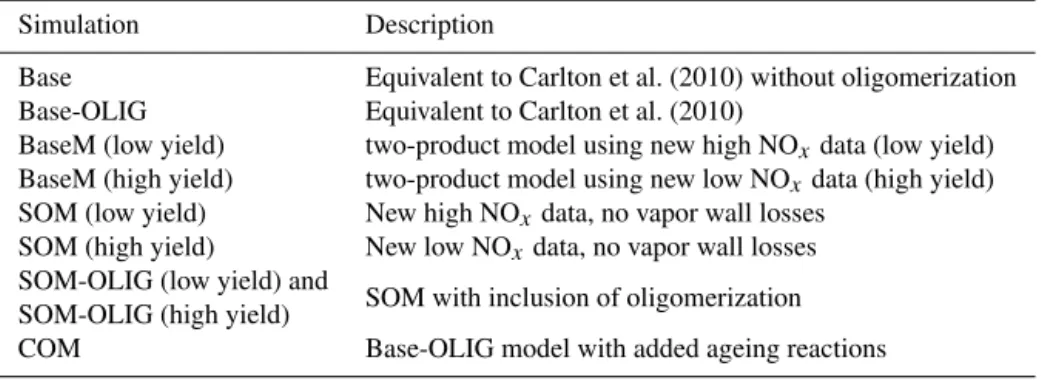
Table 1.Simulations performed in this work.
Simulation Description
Base Equivalent to Carlton et al. (2010) without oligomerization Base-OLIG Equivalent to Carlton et al. (2010)
BaseM (low yield) two-product model using new high NOxdata (low yield) BaseM (high yield) two-product model using new low NOxdata (high yield) SOM (low yield) New high NOxdata, no vapor wall losses
SOM (high yield) New low NOxdata, no vapor wall losses SOM-OLIG (low yield) and
SOM with inclusion of oligomerization SOM-OLIG (high yield)
COM Base-OLIG model with added ageing reactions
models, it is useful to begin by considering differences be-tween the predictions from Base and BaseM (two-product parameters fit to more recent data sets). The 14-day aver-aged, precursor-resolved SOA concentrations at two sites in the SoCAB (Los Angeles: urban; Riverside: urban outflow) and at two sites in the eastern US (Atlanta: urban; Smoky Mountains: remote) from Base and BaseM are compared in Fig. 1. Base model predictions of total semi-volatile SOA concentrations (i.e., SOA exclusive of oligomers) at all four sites are similar to the BaseM (low-yield) model predictions that were parameterized using high-NOxchamber data. This
outcome is perhaps not surprising at Los Angeles, River-side and Atlanta since these urban areas have higher NOx
levels and, correspondingly, the Base simulations effectively used high-NOxparameters. While there are slight increases
in SOA from some precursors and decreases from others, BaseM, in comparison to Base, predicted negligible contri-butions from alkane SOA. The general agreement between Base and BaseM (low yield) in rural/remote areas like the Smoky Mountains (where more than three-quarters of the SOA comes from terpene oxidation) also resulted from in-creases in SOA from some precursors and dein-creases from others. These precursor-specific differences are a result of slight differences between the two-product yields for these species in Base (Carlton et al., 2010) and BaseM. The com-parison between Base and BaseM suggests that while the newer data might not dramatically affect the SOA concen-trations in high-NOx (or urban) areas – at least those that
still have marginal biogenic contributions – the newer data could increase SOA concentrations (factor of ∼2) in low-NOx(or rural/remote) areas. One important difference is that
the BaseM parameterizations for mono- and sesquiterpenes indicate a NOxdependence, whereas the Base
parameteriza-tions have no NOx dependence for these compounds. This
has implications for the assessment of anthropogenic influ-ences on biogenic SOA and whether biogenic SOA can, to some extent, be controlled (Carlton et al., 2007). Further, the substantial decrease in alkane SOA concentrations in BaseM compared to Base suggests that the Base alkane parameter-ization might be over-predicting SOA formation from
alka-0 2 4 6 8
0 2 4 6 8 0
0.2 0.4 0.6 0.8 1
0 0.2 0.4 0.6 0.8 1
Base
Base M (lo
w yi eld)
Base M (h
igh yiel
d)
(a) Los Angeles (b) Riverside
(c) Atlanta (d) Smoky Mtns
Alkane SOA! Aromatic SOA! Isoprene SOA! Terpene SOA! Sesquiterpene SOA
SO
A
(µ
g
m
-3)
SO
A
(µ
g
m
-3)
SO M (lo
w yi eld)
SOM (hig
h yi eld) Base
Base M (lo
w yi eld)
Base M (h
igh yiel
d)
SO M (lo
w yi eld)
SOM (hig
h yi eld)
Figure 1.14-day averaged SOA concentrations at Los Angeles(a), Riverside(b), Atlanta(c)and Smoky Mountains(d)for the Base, BaseM, and SOM simulations resolved by the precursor/pathway.
nes, at least those that make up ALK5, making it an even smaller fraction of the total SOA mass.
3.2 Effect of constrained multi-generational oxidation 3.2.1 SOA concentrations
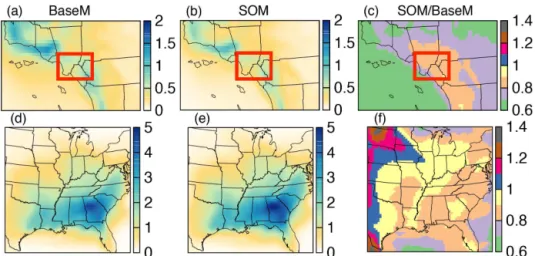
Figure 2. (a, b)14-day averaged SOA concentrations in SoCAB for the BaseM and SOM simulations.(c)Ratio of the 14-day averaged SOA concentration from the SOM simulation to that from the BaseM simulation. The BaseM and SOM results are averages of the low-yield and high-yield simulations. Red box indicates urban areas surrounding Los Angeles.
shown in Fig. 2. The SOA concentrations presented are av-erages of the low-yield and high-yield simulations. Consid-eration of either the low-yield or high-yield simulations in-dividually affects the details, but not the general conclusions about multi-generational oxidation below, even though the SOA mass concentrations from the high-yield simulations are typically 2–4 times larger than from the low-yield simula-tions (see Fig. S2). In both the SoCAB and the eastern USA, the predicted spatial distribution of SOA is generally simi-lar between BaseM and SOM, with only minor differences evident in some locations. For the SoCAB, the SOA concen-trations in SOM are somewhat lower everywhere compared to BaseM, by 10–20 % in the Los Angeles metropolitan area (marked by a red box) and by about 20–30 % in regions dom-inated by biogenic SOA (e.g., Los Padres National Forest located in the northwest corner of the simulated domain). Similarly, the SOM predictions for SOA concentrations in the eastern USA are 0–20 % lower than BaseM predictions over most of the domain. The urban vs. biogenic difference was not evident, probably owing to a coarser grid resolution (36 km for the eastern USA vs. 8 km for the SoCAB). It ap-pears that multi-generational oxidation does not dramatically increase (from additional functionalization reactions) or de-crease (from additional fragmentation reactions) the total SOA concentrations formed from the precursor compounds considered in either region.
In Fig. 1, at all sites, the SOM SOA concentrations are roughly the same or slightly higher than the BaseM SOA concentrations for the low-yield simulations but consistently lower for the high-yield simulations, by 18–25 %. When av-eraged, the SOM SOA concentrations are slightly lower than the BaseM simulations, largely due to the lower predictions of SOA from mono-terpene and sesquiterpenes in the SOM high-yield simulations. The low- vs. high-yield distinction suggests that the SOM-predicted SOA is probably similar
to BaseM-predicted SOA in urban areas (low yield or high NOx) but lower in rural/remote areas (high yield or low
NOx).
The seemingly limited influence of multi-generational ox-idation on total SOA concentrations runs counter to the find-ings from previous work that suggests multi-generational ox-idation is an important source of SOA (Robinson et al., 2007; Murphy and Pandis, 2009; Baek et al., 2011; Fast et al., 2014; Dzepina et al., 2009). However, these previous efforts accounted for multi-generational VOC oxidation by adding ageing reactions for semi-volatile products on top of an ex-isting parameterization, similar to the COM model, and thus may suffer from double counting to some extent (we will return to this point later). These results also indicate that the two-product model parameterization inherently captures some of the influence of multi-generational oxidation, at least over the timescales and conditions relevant for the SoCAB and the eastern USA. This can be understood by considering that, although the two-product model assumes non-reactive products, the chamber-observed SOA formation is dependent on production from all reaction generations, even at short ox-idation lifetimes (half to a full day of photochemistry); the extent to which multi-generational oxidation influences the two-product fit parameters will depend on the extent to which later generation products are responsible for the actual SOA formation in a given experiment. In summary, it is possible that the chamber-observed SOA formation accounts for the majority of the multi-generational oxidation reactions that contribute to SOA mass, and hence a two-product approach to model SOA formation would already include the mass-enhancement associated with multi-generational oxidation. However, such a two-product model may not necessarily ac-curately represent the chemical composition of SOA.
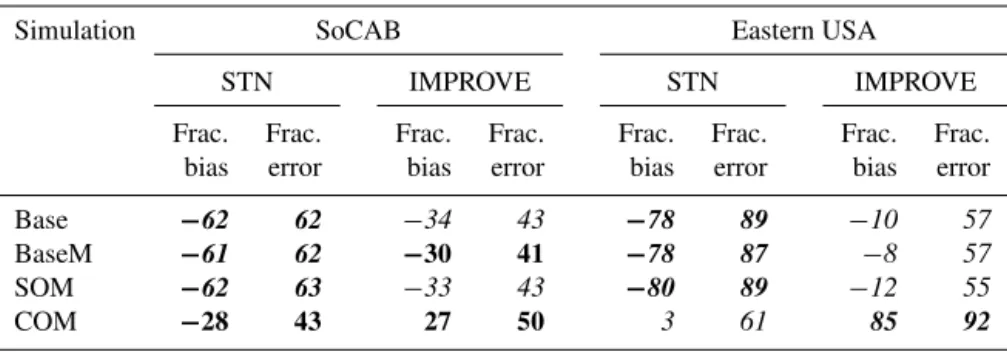
differ-Table 2.Fractional bias and fractional error at STN and IMPROVE sites for the SoCAB and the eastern USA for the Base, BaseM (average of low- and high-yield), COM and SOM (average of low- and high-yield) simulations. Bold, italics, and bold-italics representgood,average andpoormodel performance (Boylan and Russell, 2006).
Simulation SoCAB Eastern USA
STN IMPROVE STN IMPROVE
Frac. Frac. Frac. Frac. Frac. Frac. Frac. Frac.
bias error bias error bias error bias error
Base −62 62 −34 43 −78 89 −10 57
BaseM −61 62 −30 41 −78 87 −8 57
SOM −62 63 −33 43 −80 89 −12 55
COM −28 43 27 50 3 61 85 92
ences likely related to the size of the domain and the aver-age atmospheric lifetime of the simulated SOA, differences in the evolution of SOA from the various precursors, and the dominance of certain precursors in different domains. These precursor-specific SOA concentrations are visualized in Fig. 1 and listed as domain-wide averages in Table S4. These results indicate that SOM typically produced more SOA from alkanes (although very little overall) but less from terpenes and isoprene in both the SoCAB and the east-ern USA, compared to BaseM. For aromatics and sesquiter-penes the concentrations are generally similar between the two models, although slightly greater for sesquiterpenes for the eastern USA SOM simulations. The use of the SOM model that inherently accounts for multi-generational oxi-dation leads to more SOA mass for some compounds (due to enhanced functionalization) but less SOA mass for others (due to fragmentation) compared to a static representation of the semi-volatile products. SOA concentrations in chamber photooxidation experiments have been observed to decrease at longer times for some VOCs, notably isoprene (Chhabra et al., 2011) andα-pinene (Henry and Donahue, 2012). Such
behavior is captured by SOM but not by BaseM, which does not account for fragmentation. Consequently, SOA concen-trations in BaseM can never decrease from reactions. The general similarity in the total simulated SOA from BaseM and SOM results in large part from offsetting trends asso-ciated with different SOA precursors. This suggests that the use of constrained multi-generational oxidation SOA mod-els, such as SOM, over two-product models may help to pro-vide a clearer picture of the sources of SOA in a given region, even if the different modeling approaches lead to similar total SOA mass concentrations.
The simulated total OA concentrations (POA+SOA) are compared to ambient OA measurements made at the STN (Speciated Trends Network) and IMPROVE (Interagency Monitoring of Protected Visual Environments) air quality monitoring sites in the SoCAB and the eastern USA. (IM-PROVE sites tend to be remote and with lower OA concen-trations compared to STN sites, which tend to be more ur-ban.) Table 2 lists statistical metrics of fractional bias and
fractional error that capture model performance for OA for all simulations for both domains at the STN and IMPROVE sites. The simulated SOA fraction of total OA differs greatly between the SoCAB (∼10 %) and the eastern USA (∼80 %). Consequently, changes in the amount of SOA simulated will have a larger influence on the total OA in the eastern USA, and thus on the comparison with observations. Despite these differences, there is no substantial change in model perfor-mance between Base, BaseM and SOM in either domain, with all simulations under-predicting the total OA. In con-trast, COM, which leads to substantial increases in the sim-ulated SOA mass concentrations within both domains (see Sect. 3.3), improved model performance at the STN and IM-PROVE sites for the SoCAB and at the STN sites for the eastern USA.
3.2.2 SOA volatility
The effective volatility of the SOA was characterized for the Base, BaseM and SOM simulations. SOA volatility influ-ences the sensitivity of the SOA to dilution and temperature changes. Since Base, BaseM and SOM use model species that have very different volatilities, as characterized by the species saturation concentration,C∗
, volatility distributions were developed in which individual species are grouped into logarithmically spaced bins of effectiveC∗
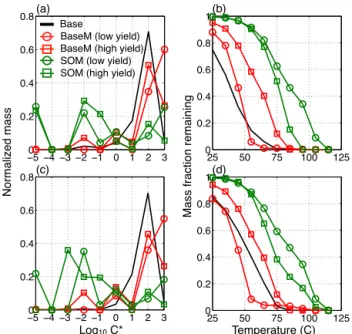
, referred to as volatility basis set-equivalent (VBSeq) distributions (Don-ahue et al., 2006). In Fig. 3a and c, we show the normalized, episode-averaged VBSeqdistributions of SOA at Los Ange-les and Atlanta for the Base, BaseM and SOM simulations. Qualitatively, the SOA VBSeq distributions for Base and BaseM are similar, with the bulk of the gas+particle mass being in the C∗=1 to 1000 µg m−3 range. In sharp con-trast, the SOA volatility distribution for the SOM simulation had a substantial fraction of SOA mass in theC∗=0.0001
to 1 µg m−3range, much lower than the Base/BaseM simu-lations. At atmospherically relevant OA concentrations (1– 10 µg m−3), the mass in these lowC∗
−5−4−3−2−1 0 1 2 3 0
0.2 0.4 0.6 0.8
25 50 75 100 125
0 0.2 0.4 0.6 0.8 1
−05−4−3−2−1 0 1 2 3 0.2
0.4 0.6 0.8
25 50 75 100 125 0
0.2 0.4 0.6 0.8 1
N
or
m
aliz
ed m
as
s
Log10 C* Temperature (C)
M
a
s
s
fr
a
c
ti
o
n
re
m
a
in
in
g
Base!
BaseM (low yield)! BaseM (high yield)! SOM (low yield)! SOM (high yield)
(a) (b)
(c) (d)
Figure 3. Volatility distributions of the 14-day averaged gas+particle SOA mass at Los Angeles(a)and Atlanta(c)for the Base, BaseM and SOM simulations. Thermograms that capture the volatility of the 14-day averaged gas+particle SOA mass at Los Angeles(b)and Atlanta(d)for the Base, BaseM and SOM simula-tions.
It is not possible to compare the simulated volatility dis-tributions to ambient observations since direct measurement of volatility distributions has not been demonstrated for such lowC∗species. However, the effective volatility of SOA
par-ticles has been experimentally assessed by considering the response of particles to heating in a thermodenuder (Cappa and Jimenez, 2010; Huffman et al., 2009). High volatility species generally evaporate at lower temperatures than low-volatility species. The theoretical response of the predicted SOA mass, expressed as the mass fraction remaining (MFR), to heating in a thermodenuder over the range 25 to 105◦
C was simulated using the model of Cappa (2010). The C∗
values varied with temperature according to the Clausius– Clapeyron equation and the enthalpy of vaporization was assumed to be a function ofC∗
with1Hvap=131−11× log10C∗ (see Supplement section Thermodenuder Model). We plot the results in Fig. 3b and d. At both Los Angeles and Atlanta, differences in the predicted SOA volatility are quite evident. In general, the effective SOA volatility was higher in the Base and BaseM simulations than in the SOM simu-lations. The SOA from the Base and BaseM simulations is almost entirely evaporated when heated to 70◦
C, and some evaporation occurs even at 25◦
C as a response to vapor strip-ping in the denuder. In contrast, the SOA from the SOM simulations did not entirely evaporate until 100◦
C and ex-hibits a more gradual decrease with temperature. The SOM-simulated SOA TD evaporation is much more similar to the behavior observed in both laboratory experiments and field
assessments of SOA volatility (Cappa and Jimenez, 2010; Huffman et al., 2009; Lee et al., 2010). This suggests that SOM is producing SOA with more physically realistic prop-erties even though the Base/BaseM and SOM simulations produced similar SOA concentrations.
3.2.3 Influence of oligomerization
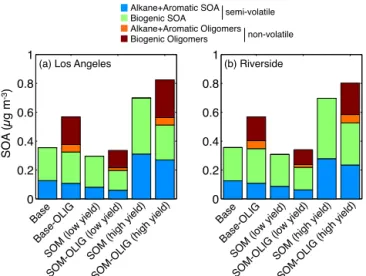
The Base-OLIG model includes an oligomerization pathway in which semi-volatile, condensed-phase material is con-verted to a non-volatile, yet absorptive material on a fixed timescale. This effectivelypumpssemi-volatile vapors to the particle phase and leads to increased SOA concentrations. It has the additional effect of making the SOA less sen-sitive to dilution and changes in temperature. To examine the influence of oligomerization, Fig. 4 shows predictions of the precursor-resolved SOA concentrations from the Base, Base-OLIG, SOM and SOM-OLIG simulations for Los An-geles and Riverside, CA. The total SOA concentrations in Base-OLIG are∼60 % higher than Base but the SOA con-centrations in SOM-OLIG were only ∼14 % higher than SOM. This difference can be understood through the dif-ferences between the SOM and Base volatility distributions for semi-volatile species. For the Base model, a large frac-tion of the oxidafrac-tion products haveC∗
> 1 µg m−3, and thus a sizable fraction is in the gas-phase. This gas-phase mate-rial can be viewed as potential SOA, and as oligomers are formed this material is converted to actual SOA. For SOM, much of the material hasC∗≤
1 µg m−3, and thus most of it is already in the particle phase. Consequently, when it is converted to oligomers only a marginal influence on the to-tal SOA concentration results. Overall, it is evident that the influence of oligomerization on simulated SOA concentra-tions is tightly linked to the semi-volatile product distribu-tion. This may influence the timescales of SOA formation, since in SOM production of lower volatility material is re-lated to the timescales of gas-phase oxidation, whereas in Base, the specified oligomerization rate coefficient, which is largely under-constrained, controls the timescale of low (es-sentially non-) volatile material.
3.3 Comparing constrained multi-generational oxidation to unconstrained schemes
Figure 4.14-day averaged SOA concentrations at(a)Los Angeles and(b)Riverside for the Base, Base-OLIG, SOM, SOM-OLIG simulations resolved by the precursor/pathway.
0 0.2 0.4 0.6 0.8 1
0 0.2 0.4 0.6 0.8 1
Base
SOM (low
yiel d)
SO M (h
igh yield)
SOM-O LIG
(low yiel
d)
SO M-O
LIG (hig
h yi eld)
Base -OLI
G Alkane+Aromatic SOA! Biogenic SOA!
Alkane+Aromatic Oligomers!
Biogenic Oligomers non-volatile
semi-volatile
Base
SOM (low
yiel d)
SO M (h
igh yield)
SOM-O LIG
(low yiel
d)
SO M-O
LIG (hig
h yi eld)
Base -OLI
G
SO
A
(µ
g
m
-3)
(a) Los Angeles (b) Riverside
Figure 5. 14-day averaged SOA concentrations in SoCAB (a–c) and the eastern USA(d–f)for the Base, COM and SOM simula-tions. The SOM results are averages of the low-yield and high-yield simulations.
Baek et al., 2011), lacks fragmentation and adds ageing reac-tions on top of an existing parameterization, and with suffi-cient oxidation all semi-volatile products will be converted into non-volatile SOA. This means that the ultimate SOA mass yield is equal to the sum of the mass yields of the indi-vidual products, independent of their vapor pressures. Given that SOM inherently accounts for multi-generational oxida-tion as part of the model parameterizaoxida-tion, this comparison clearly suggests that the unconstrained schemes used in the COM simulations form too much SOA and that such schemes are not truly representative of multi-generational oxidation in the atmosphere.
Some previous studies have defended the use of a COM-type model because its implementation improved model
4 Discussion
When constrained using the same chamber data, the BaseM (traditional two-product model that does not resolve multi-generational oxidation) and SOM models predict roughly the same SOA mass concentrations and spatial distribution for regional air pollution episodes in the SoCAB and the east-ern USA. This suggests that the chamber data used to con-strain the BaseM and SOM parameterizations presumably already includes a majority of the SOA mass that would be attributable to multi-generational oxidation. The extent to which multi-generational oxidation influences the produc-tion of SOA in a given chamber experiment depends on both the volatility and reactivity of the first-generation products and the timescale of the experiment (Wilson et al., 2012). If SOA formation is dominated by first-generation prod-ucts, then explicit accounting for multi-generational ageing will not be important. Alternatively, if most SOA is formed from second-generation products with little direct contribu-tion from first-generacontribu-tion products, then a static represen-tation (such as with the 2-product model) might be suffi-cient even when multi-generational ageing is, in fact, dom-inant. But if SOA formation is balanced between contribu-tions from first, second and later generation products, then the extent to which a static representation will capture the in-fluence of multi-generational ageing may be highly variable and sensitive to the experimental conditions and number of oxidation lifetimes. Consequently, the appropriateness of ex-trapolating static model parameterizations to longer (global atmospheric) timescales remains unclear. The results pre-sented here indicate that the 2-product model does capture the influence of multi-generational ageing as part of the pa-rameterization in terms of mass concentration, at least for the regional episodes considered, but it is also apparent that the simulated SOA properties (e.g., volatility) and the explicit contributions of various SOA types are not fully captured by such simple models.
The BaseM and SOM simulations show that the SOA con-centrations in the SoCAB and eastern USA vary by a factor of 2 when using parameterizations developed from low vs. high NOx chamber experiments. Hence, we can argue that
for the present simulations NOxdependence is a much more
important factor for SOA production than multi-generational oxidation. While most 3-D models include schemes to simu-late the NOx dependence of SOA formation, these schemes
remain ad hoc as they are based on limited experimental mea-surements and also rely on the ability of the model to accu-rately predict radical concentrations (RO2, HO2) or VOC-to-NOxratios. In this work, the model predictions from the
low-and high-yield simulations bound the NOx-dependent
uncer-tainty in SOA concentrations and we recommend that future work examine this issue in much more detail.
SOM predicts a modestly different composition of SOA than BaseM despite similar total mass concentrations of SOA. The composition predicted by SOM has a slightly
higher contribution from alkanes, aromatics (anthropogenic) and sesquiterpenes and a lower contribution from isoprene and monoterpenes. These modest differences in the predicted composition of SOA have implications for understanding the sources of ambient aerosol and eventually the regulation of these sources to achieve compliance with National Ambient Air Quality Standards (NAAQS). These more accurate SOA predictions resolved by chemical families should be tested in epidemiological studies to determine if they are associated with adverse health effects. Additionally, SOM predicted a much lower-volatility SOA than BaseM, and SOM predic-tions are in better qualitative agreement with ambient ther-modenuder measurements of OA volatility. Since the SOA has a much lower volatility, there is very little enhancement (10–15 %) with the inclusion of oligomerization reactions, implying that while oligomerization might affect composi-tion, it may not be a source of additional SOA formation as the Base model suggests.
better understand the role and contribution of POA, IVOCs and vapor wall-losses to total OA.
Finally, the comparison between the constrained SOM and the unconstrained COM (commonly used in large-scale mod-els) suggests that COM may be double counting SOA forma-tion. These simple ageing schemes should be refit to chamber data where all parameters can be matched to observed trends in a self-consistent manner.
The Supplement related to this article is available online at doi:10.5194/acp-16-2309-2016-supplement.
Acknowledgements. This work was supported by the California Air Resources Board (CARB) under contracts 11-755 and 12-312. Although this work was funded by the CARB, the statements and conclusions are those of the authors and not necessarily those of the CARB.
Edited by: M. Shiraiwa
References
Ahmadov, R., McKeen, S. A., Robinson, A. L., Bahreini, R., Mid-dlebrook, A. M., de Gouw, J. A., Meagher, J., Hsie, E. Y., Edger-ton, E., Shaw, S., and Trainer, M.: A volatility basis set model for summertime secondary organic aerosols over the eastern United States in 2006, J. Geophys. Res.-Atmos., 117, D06301, doi:10.1029/2011JD016831, 2012.
Baek, J., Hu, Y., Odman, M. T., and Russell, A. G.: Modeling sec-ondary organic aerosol in CMAQ using multigenerational ox-idation of semi-volatile organic compounds, J. Geophys. Res.-Atmos., 116, D22204, doi:10.1029/2011JD015911, 2011. Bernstein, J. A., Alexis, N., Barnes, C., Bernstein, I. L., Bernstein,
J. A., Nel, A., Peden, D., Diaz-Sanchez, D., Tarlo, S. M., and Williams, P. B.: Health effects of air pollution, J. Allergy Clin. Immun., 114, 1116–1123, 2004.
Boylan, J. W. and Russell, A. G.: PM and light extinction model performance metrics, goals, and criteria for three-dimensional air quality models, Atmos. Environ., 40, 4946–4959, 2006. Cappa, C. D.: A model of aerosol evaporation kinetics in a
ther-modenuder, Atmos. Meas. Tech., 3, 579–592, doi:10.5194/amt-3-579-2010, 2010.
Cappa, C. D. and Jimenez, J. L.: Quantitative estimates of the volatility of ambient organic aerosol, Atmos. Chem. Phys., 10, 5409–5424, doi:10.5194/acp-10-5409-2010, 2010.
Cappa, C. D. and Wilson, K. R.: Multi-generation gas-phase oxida-tion, equilibrium partitioning, and the formation and evolution of secondary organic aerosol, Atmos. Chem. Phys., 12, 9505–9528, doi:10.5194/acp-12-9505-2012, 2012.
Cappa, C. D., Zhang, X., Loza, C. L., Craven, J. S., Yee, L. D., and Seinfeld, J. H.: Application of the Statistical Oxidation Model (SOM) to Secondary Organic Aerosol formation from photoox-idation of C12 alkanes, Atmos. Chem. Phys., 13, 1591–1606, doi:10.5194/acp-13-1591-2013, 2013.
Cappa, C. D., Jathar, S. H., Kleeman, M. J., Docherty, K. S., Jimenez, J. L., Seinfeld, J. H., and Wexler, A. S.: Simulating secondary organic aerosol in a regional air quality model using the statistical oxidation model – Part 2: Assessing the influence of vapor wall losses, Atmos. Chem. Phys. Discuss., 15, 30081– 30126, doi:10.5194/acpd-15-30081-2015, 2015.
Carlton, A. G., Pinder, R. W., Bhave, P. V., and Pouliot, G. A.: To what extent can biogenic SOA be controlled?, Environ. Sci. Technol., 44, 3376–3380, 2007.
Carlton, A. G., Bhave, P. V., Napelenok, S. L., Edney, E. O., Sarwar, G., Pinder, R. W., Pouliot, G. A., and Houyoux, M.: Model rep-resentation of secondary organic aerosol in CMAQv4.7, Environ. Sci. Technol., 44, 8553–8560, 2010.
Carter, W. P. and Heo, G.: Development of revised SAPRC aromat-ics mechanisms, Atmos. Environ., 77, 404–414, 2013.
Chacon-Madrid, H. J. and Donahue, N. M.: Fragmentation vs. functionalization: chemical aging and organic aerosol forma-tion, Atmos. Chem. Phys., 11, 10553–10563, doi:10.5194/acp-11-10553-2011, 2011.
Chacon-Madrid, H. J., Presto, A. A., and Donahue, N. M.: Function-alization vs. fragmentation: n-aldehyde oxidation mechanisms and secondary organic aerosol formation, Phys. Chem. Chem. Phys., 12, 13975–13982, doi:10.1039/c0cp00200c, 2010. Chacon-Madrid, H. J., Henry, K. M., and Donahue, N. M.:
Photo-oxidation of pinonaldehyde at low NOx: from chemistry to or-ganic aerosol formation, Atmos. Chem. Phys., 13, 3227–3236, doi:10.5194/acp-13-3227-2013, 2013.
Chen, J., Mao, H., Talbot, R. W., and Griffin, R. J.: Application of the CACM and MPMPO modules using the CMAQ model for the eastern United States, J. Geophys. Res.-Atmos. (1984–2012), 111, D23S25, doi:10.1029/2006JD007603, 2006.
Chhabra, P. S., Ng, N. L., Canagaratna, M. R., Corrigan, A. L., Rus-sell, L. M., Worsnop, D. R., Flagan, R. C., and Seinfeld, J. H.: El-emental composition and oxidation of chamber organic aerosol, Atmos. Chem. Phys., 11, 8827–8845, doi:10.5194/acp-11-8827-2011, 2011.
Chirico, R., DeCarlo, P. F., Heringa, M. F., Tritscher, T., Richter, R., Prévôt, A. S. H., Dommen, J., Weingartner, E., Wehrle, G., Gysel, M., Laborde, M., and Baltensperger, U.: Impact of af-tertreatment devices on primary emissions and secondary or-ganic aerosol formation potential from in-use diesel vehicles: re-sults from smog chamber experiments, Atmos. Chem. Phys., 10, 11545–11563, doi:10.5194/acp-10-11545-2010, 2010.
Donahue, N., Robinson, A., Stanier, C., and Pandis, S.: Coupled partitioning, dilution, and chemical aging of semivolatile organics, Environ. Sci. Technol, 40, 2635–2643, doi:10.1021/es052297c, 2006.
Donahue, N. M., Henry, K. M., Mentel, T. F., Kiendler-Scharr, A., Spindler, C., Bohn, B., Brauers, T., Dorn, H. P., Fuchs, H., and Tillmann, R.: Aging of biogenic secondary organic aerosol via gas-phase OH radical reactions, P. Natl. Acad. Sci., 109, 13503– 13508, 2012.
Dzepina, K., Volkamer, R. M., Madronich, S., Tulet, P., Ulbrich, I. M., Zhang, Q., Cappa, C. D., Ziemann, P. J., and Jimenez, J. L.: Evaluation of recently-proposed secondary organic aerosol models for a case study in Mexico City, Atmos. Chem. Phys., 9, 5681–5709, doi:10.5194/acp-9-5681-2009, 2009.
Laepple, T., Orlando, J., Tie, X., Tyndall, G., Wiedinmyer, C., Baughcum, S. L., and Kloster, S.: Description and evaluation of the Model for Ozone and Related chemical Tracers, version 4 (MOZART-4), Geosci. Model Dev., 3, 43–67, doi:10.5194/gmd-3-43-2010, 2010.
Epstein, S. A., Riipinen, I., and Donahue, N. M.: A semiempirical correlation between enthalpy of vaporization and saturation con-centration for organic aerosol, Environ. Sci. Technol., 44, 743– 748, doi:10.1021/es902497z, 2009.
Ervens, B., Turpin, B. J., and Weber, R. J.: Secondary or-ganic aerosol formation in cloud droplets and aqueous parti-cles (aqSOA): a review of laboratory, field and model stud-ies, Atmos. Chem. Phys., 11, 11069–11102, doi:10.5194/acp-11-11069-2011, 2011.
Farina, S. C., Adams, P. J., and Pandis, S. N.: Modeling global secondary organic aerosol formation and processing with the volatility basis set: Implications for anthropogenic secondary organic aerosol, J. Geophys. Res., 115, D09202, doi:10.1029/2009JD013046, 2010.
Fast, J. D., Allan, J., Bahreini, R., Craven, J., Emmons, L., Ferrare, R., Hayes, P. L., Hodzic, A., Holloway, J., Hostetler, C., Jimenez, J. L., Jonsson, H., Liu, S., Liu, Y., Metcalf, A., Middlebrook, A., Nowak, J., Pekour, M., Perring, A., Russell, L., Sedlacek, A., Seinfeld, J., Setyan, A., Shilling, J., Shrivastava, M., Springston, S., Song, C., Subramanian, R., Taylor, J. W., Vinoj, V., Yang, Q., Zaveri, R. A., and Zhang, Q.: Modeling regional aerosol and aerosol precursor variability over California and its sensitivity to emissions and long-range transport during the 2010 CalNex and CARES campaigns, Atmos. Chem. Phys., 14, 10013–10060, doi:10.5194/acp-14-10013-2014, 2014.
Goldstein, A. H. and Galbally, I. E.: Known and unexplored organic constituents in the earth’s atmosphere, Environ. Sci. Technol., 41, 1514–1521, doi:10.1021/es072476p, 2007.
Gordon, T. D., Tkacik, D. S., Presto, A. A., Zhang, M., Jathar, S. H., Nguyen, N. T., Massetti, J., Truong, T., Cicero-Fernandez, P., Maddox, C., Rieger, P., Chattopadhyay, S., Maldonado, H., Maricq, M. M., and Robinson, A. L.: Primary Gas- and Particle-Phase Emissions and Secondary Organic Aerosol Production from Gasoline and Diesel Off-Road Engines, Environ. Sci. Tech-nol., 47, 14137–14146, 2013.
Gordon, T. D., Presto, A. A., May, A. A., Nguyen, N. T., Lip-sky, E. M., Donahue, N. M., Gutierrez, A., Zhang, M., Mad-dox, C., Rieger, P., Chattopadhyay, S., Maldonado, H., Maricq, M. M., and Robinson, A. L.: Secondary organic aerosol for-mation exceeds primary particulate matter emissions for light-duty gasoline vehicles, Atmos. Chem. Phys., 14, 4661–4678, doi:10.5194/acp-14-4661-2014, 2014a.
Gordon, T. D., Presto, A. A., Nguyen, N. T., Robertson, W. H., Na, K., Sahay, K. N., Zhang, M., Maddox, C., Rieger, P., Chat-topadhyay, S., Maldonado, H., Maricq, M. M., and Robinson, A. L.: Secondary organic aerosol production from diesel vehicle ex-haust: impact of aftertreatment, fuel chemistry and driving cycle, Atmos. Chem. Phys., 14, 4643–4659, doi:10.5194/acp-14-4643-2014, 2014b.
Grieshop, A. P., Donahue, N. M., and Robinson, A. L.: Laboratory investigation of photochemical oxidation of organic aerosol from wood fires 2: analysis of aerosol mass spectrometer data, At-mos. Chem. Phys., 9, 2227–2240, doi:10.5194/acp-9-2227-2009, 2009a.
Grieshop, A. P., Logue, J. M., Donahue, N. M., and Robinson, A. L.: Laboratory investigation of photochemical oxidation of or-ganic aerosol from wood fires 1: measurement and simulation of organic aerosol evolution, Atmos. Chem. Phys., 9, 1263–1277, doi:10.5194/acp-9-1263-2009, 2009b.
Guenther, A., Karl, T., Harley, P., Wiedinmyer, C., Palmer, P. I., and Geron, C.: Estimates of global terrestrial isoprene emissions using MEGAN (Model of Emissions of Gases and Aerosols from Nature), Atmos. Chem. Phys., 6, 3181–3210, doi:10.5194/acp-6-3181-2006, 2006.
Hennigan, C. J., Miracolo, M. A., Engelhart, G. J., May, A. A., Presto, A. A., Lee, T., Sullivan, A. P., McMeeking, G. R., Coe, H., Wold, C. E., Hao, W.-M., Gilman, J. B., Kuster, W. C., de Gouw, J., Schichtel, B. A., Collett Jr., J. L., Kreidenweis, S. M., and Robinson, A. L.: Chemical and physical transformations of organic aerosol from the photo-oxidation of open biomass burning emissions in an environmental chamber, Atmos. Chem. Phys., 11, 7669–7686, doi:10.5194/acp-11-7669-2011, 2011. Henry, K. M. and Donahue, N. M.: Photochemical aging ofα
-pinene secondary organic aerosol: effects of OH radical sources and photolysis, J. Phys. Chem. A, 116, 5932–5940, 2012. Henze, D. K., Seinfeld, J. H., Ng, N. L., Kroll, J. H., Fu, T.-M.,
Jacob, D. J., and Heald, C. L.: Global modeling of secondary organic aerosol formation from aromatic hydrocarbons: high-vs. low-yield pathways, Atmos. Chem. Phys., 8, 2405–2420, doi:10.5194/acp-8-2405-2008, 2008.
Heringa, M. F., DeCarlo, P. F., Chirico, R., Tritscher, T., Dommen, J., Weingartner, E., Richter, R., Wehrle, G., Prévôt, A. S. H., and Baltensperger, U.: Investigations of primary and secondary particulate matter of different wood combustion appliances with a high-resolution time-of-flight aerosol mass spectrometer, At-mos. Chem. Phys., 11, 5945–5957, doi:10.5194/acp-11-5945-2011, 2011.
Huffman, J., Docherty, K., Mohr, C., Cubison, M., Ulbrich, I., Ziemann, P., Onasch, T., and Jimenez, J.: Chemically-resolved volatility measurements of organic aerosol fom different sources, Environ. Sci. Technol., 43, 5351–5357, 2009.
Pachauri, R. K., Allen, M. R., Barros, V. R., Broome, J., Cramer, W., Christ, R., Church, J. A., Clarke, L., Dahe, Q., Dasgupta, P., Dubash, N. K., Edenhofer, O., Elgizouli, I., Field, C. B., Forster, P., Friedlingstein, P., Fuglestvedt, J., Gomez-Echeverri, L., Hal-legatte, S., Hegerl, G., Howden, M., Jiang, K., Jimenez Cisneroz, B., Kattsov, V., Lee, H., Mach, K. J., Marotzke, J., Mastrandrea, M. D., Meyer, L., Minx, J., Mulugetta, Y., O’Brien, K., Oppen-heimer, M., Pereira, J. J., Pichs-Madruga, R., Plattner, G. K., Pörtner, H.-O., Power, S. B., Preston, B., Ravindranath, N. H., Reisinger, A., Riahi, K., Rusticucci, M., Scholes, R., Seyboth, K., Sokona, Y., Stavins, R., Stocker, T. F., Tschakert, P., van Vu-uren, D., and van Ypserle, J. P.: Climate Change 2014: Synthe-sis Report. Contribution of Working Groups I, II and III to the Fifth Assessment Report of the Intergovernmental Panel on Cli-mate Change, edited by: Pachauri, R. K., and Meyer, L., IPCC, Geneva, Switzerland, 151 pp., 2014.
Jathar, S. H., Cappa, C. D., Wexler, A. S., Seinfeld, J. H., and Klee-man, M. J.: Multi-generational oxidation model to simulate sec-ondary organic aerosol in a 3-D air quality model, Geosci. Model Dev., 8, 2553–2567, doi:10.5194/gmd-8-2553-2015, 2015. Jimenez, J. L., Canagaratna, M. R., Donahue, N. M., Prevot, A. S.
H., Zhang, Q., Kroll, J. H., DeCarlo, P. F., Allan, J. D., Coe, H., Ng, N. L., Aiken, A. C., Docherty, K. S., Ulbrich, I. M., Grieshop, A. P., Robinson, A. L., Duplissy, J., Smith, J. D., Wil-son, K. R., Lanz, V. A., Hueglin, C., Sun, Y. L., Tian, J., Laak-sonen, A., Raatikainen, T., Rautiainen, J., Vaattovaara, P., Ehn, M., Kulmala, M., Tomlinson, J. M., Collins, D. R., Cubison, M. J., E, Dunlea, J., Huffman, J. A., Onasch, T. B., Alfarra, M. R., Williams, P. I., Bower, K., Kondo, Y., Schneider, J., Drewnick, F., Borrmann, S., Weimer, S., Demerjian, K., Salcedo, D., Cot-trell, L., Griffin, R., Takami, A., Miyoshi, T., Hatakeyama, S., Shimono, A., Sun, J. Y., Zhang, Y. M., Dzepina, K., Kimmel, J. R., Sueper, D., Jayne, J. T., Herndon, S. C., Trimborn, A. M., Williams, L. R., Wood, E. C., Middlebrook, A. M., Kolb, C. E., Baltensperger, U., and Worsnop, D. R.: Evolution of Or-ganic Aerosols in the Atmosphere, Science, 326, 1525–1529, doi:10.1126/science.1180353, 2009.
Johnson, D., Utembe, S. R., Jenkin, M. E., Derwent, R. G., Hay-man, G. D., Alfarra, M. R., Coe, H., and McFiggans, G.: Simu-lating regional scale secondary organic aerosol formation during the TORCH 2003 campaign in the southern UK, Atmos. Chem. Phys., 6, 403–418, doi:10.5194/acp-6-403-2006, 2006.
Kalberer, M., Paulsen, D., Sax, M., Steinbacher, M., Dommen, J., Prevot, A. S. H., Fisseha, R., Weingartner, E., Frankevich, V., Zenobi, R., and Baltensperger, U.: Identification of polymers as major components of atmospheric organic aerosols, Science, 303, 1659–1662, doi:10.1126/science.1092185, 2004.
Kleeman, M. J. and Cass, G. R.: A 3-D Eulerian source-oriented model for an externally mixed aerosol, Environ. Sci. Technol., 35, 4834–4848, 2001.
Koo, B., Knipping, E., and Yarwood, G.: 1.5-Dimensional volatility basis set approach for modeling organic aerosol in CAMx and CMAQ, Atmos. Environ., 95, 158–164, 2014.
Lambe, A. T., Onasch, T. B., Croasdale, D. R., Wright, J. P., Mar-tin, A. T., Franklin, J. P., Massoli, P., Kroll, J. H., Canagaratna, M. R., and Brune, W. H.: Transitions from functionalization to fragmentation reactions of laboratory secondary organic aerosol (SOA) generated from the OH oxidation of alkane precursors, Environ. Sci. Technol., 46, 5430–5437, 2012.
Lane, T. E., Donahue, N. M., and Pandis, S. N.: Simulating sec-ondary organic aerosol formation using the volatility basis-set approach in a chemical transport model, Atmos. Environ., 42, 7439–7451, 2008.
Lee, B. H., Kostenidou, E., Hildebrandt, L., Riipinen, I., Engel-hart, G. J., Mohr, C., DeCarlo, P. F., Mihalopoulos, N., Prevot, A. S. H., Baltensperger, U., and Pandis, S. N.: Measurement of the ambient organic aerosol volatility distribution: application during the Finokalia Aerosol Measurement Experiment (FAME-2008), Atmos. Chem. Phys., 10, 12149–12160, doi:10.5194/acp-10-12149-2010, 2010.
Lee-Taylor, J., Madronich, S., Aumont, B., Baker, A., Camredon, M., Hodzic, A., Tyndall, G. S., Apel, E., and Zaveri, R. A.: Explicit modeling of organic chemistry and secondary organic aerosol partitioning for Mexico City and its outflow plume,
Atmos. Chem. Phys., 11, 13219–13241, doi:10.5194/acp-11-13219-2011, 2011.
Liggio, J., Li, S. M., and McLaren, R.: Reactive uptake of glyoxal by particulate matter, J. Geophys. Res.-Atmos. (1984–2012), 110, D10304, doi:10.1029/2004JD005113, 2005.
Lin, G., Penner, J. E., Sillman, S., Taraborrelli, D., and Lelieveld, J.: Global modeling of SOA formation from dicarbonyls, epoxides, organic nitrates and peroxides, Atmos. Chem. Phys., 12, 4743– 4774, doi:10.5194/acp-12-4743-2012, 2012.
Loza, C. L., Craven, J. S., Yee, L. D., Coggon, M. M., Schwantes, R. H., Shiraiwa, M., Zhang, X., Schilling, K. A., Ng, N. L., Canagaratna, M. R., Ziemann, P. J., Flagan, R. C., and Seinfeld, J. H.: Secondary organic aerosol yields of 12-carbon alkanes, Atmos. Chem. Phys., 14, 1423–1439, doi:10.5194/acp-14-1423-2014, 2014.
Matsunaga, A. and Ziemann, P. J.: Gas-wall partitioning of organic compounds in a Teflon film chamber and potential effects on reaction product and aerosol yield measurements, Aerosol Sci. Tech., 44, 881–892, 2010.
McVay, R. C., Cappa, C. D., and Seinfeld, J. H.: Vapor–Wall De-position in Chambers: Theoretical Considerations, Environ. Sci. Technol., 48, 10251–10258, 2014.
Miracolo, M. A., Hennigan, C. J., Ranjan, M., Nguyen, N. T., Gor-don, T. D., Lipsky, E. M., Presto, A. A., Donahue, N. M., and Robinson, A. L.: Secondary aerosol formation from photochem-ical aging of aircraft exhaust in a smog chamber, Atmos. Chem. Phys., 11, 4135–4147, doi:10.5194/acp-11-4135-2011, 2011. Miracolo, M. A., Drozd, G. T., Jathar, S., Presto, A. A., Lipsky,
E., Corporan, E., and Robinson, A.: Fuel composition and sec-ondary organic aerosol formation: gas-turbine exhaust and al-ternative aviation fuels, Environ. Sci. Technol., 46, 8493–8501, doi:10.1021/es300350c, 2012.
Murphy, B. and Pandis, S.: Simulating the formation of semivolatile primary and secondary organic aerosol in a regional chemi-cal transport model, Environ. Sci. Technol., 43, 4722–4728, doi:10.1021/es803168a, 2009.
Nordin, E. Z., Eriksson, A. C., Roldin, P., Nilsson, P. T., Carlsson, J. E., Kajos, M. K., Hellén, H., Wittbom, C., Rissler, J., Löndahl, J., Swietlicki, E., Svenningsson, B., Bohgard, M., Kulmala, M., Hallquist, M., and Pagels, J. H.: Secondary organic aerosol for-mation from idling gasoline passenger vehicle emissions investi-gated in a smog chamber, Atmos. Chem. Phys., 13, 6101–6116, doi:10.5194/acp-13-6101-2013, 2013.
Odum, J. R., Hoffmann, T., Bowman, F., Collins, D., Flagan, R. C., and Seinfeld, J. H.: Gas/particle partitioning and secondary organic aerosol yields, Environ. Sci. Technol., 30, 2580–2585, 1996.
Platt, S. M., El Haddad, I., Zardini, A. A., Clairotte, M., Astorga, C., Wolf, R., Slowik, J. G., Temime-Roussel, B., Marchand, N., Ježek, I., Drinovec, L., Mocnik, G., Möhler, O., Richter, R., Barmet, P., Bianchi, F., Baltensperger, U., and Prévôt, A. S. H.: Secondary organic aerosol formation from gasoline vehi-cle emissions in a new mobile environmental reaction chamber, Atmos. Chem. Phys., 13, 9141–9158, doi:10.5194/acp-13-9141-2013, 2013.
Marc-hand, N., Hellebust, S., Temime-Roussel, B., Baltensperger, U., and Prévôt, A. S. H.: Two-stroke scooters are a dominant source of air pollution in many cities, Nature communications, 5, 3749, doi:10.1038/ncomms4749, 2014.
Pye, H. O. T. and Seinfeld, J. H.: A global perspective on aerosol from low-volatility organic compounds, Atmos. Chem. Phys., 10, 4377–4401, doi:10.5194/acp-10-4377-2010, 2010.
Robinson, A. L., Donahue, N. M., Shrivastava, M. K., Weitkamp, E. A., Sage, A. M., Grieshop, A. P., Lane, T. E., Pierce, J. R., and Pandis, S. N.: Rethinking organic aerosols: Semivolatile emis-sions and photochemical aging, Science, 315, 1259–1262, 2007. Shiraiwa, M., Yee, L. D., Schilling, K. A., Loza, C. L., Craven, J. S., Zuend, A., Ziemann, P. J., and Seinfeld, J. H.: Size distribu-tion dynamics reveal particle-phase chemistry in organic aerosol formation, P. Natl. Acad. Sci., 110, 11746–11750, 2013. Shrivastava, M. K., Lane, T. E., Donahue, N. M., Pandis, S.
N., and Robinson, A. L.: Effects of gas particle partitioning and aging of primary emissions on urban and regional organic aerosol concentrations, J. Geophys. Res.-Atmos., 113, D18301, doi:10.1029/2007JD009735, 2008.
Simon, H. and Bhave, P. V.: Simulating the degree of oxidation in atmospheric organic particles, Environ. Sci. Technol., 46, 331– 339, 2011.
Surratt, J. D., Lewandowski, M., Offenberg, J. H., Jaoui, M., Klein-dienst, T. E., Edney, E. O., and Seinfeld, J. H.: Effect of acidity on secondary organic aerosol formation from isoprene, Environ. Sci. Technol., 41, 5363–5369, 2007.
Tkacik, D. S., Lambe, A. T., Jathar, S., Li, X., Presto, A. A., Zhao, Y., Blake, D., Meinardi, S., Jayne, J. T., Croteau, P. L., and Robinson, A. L.: Secondary Organic Aerosol Forma-tion from in-Use Motor Vehicle Emissions Using a Potential Aerosol Mass Reactor, Environ. Sci. Technol., 48, 11235–11242, doi:10.1021/es502239v, 2014.
Tsimpidi, A. P., Karydis, V. A., Zavala, M., Lei, W., Molina, L., Ulbrich, I. M., Jimenez, J. L., and Pandis, S. N.: Evaluation of the volatility basis-set approach for the simulation of organic aerosol formation in the Mexico City metropolitan area, Atmos. Chem. Phys., 10, 525–546, doi:10.5194/acp-10-525-2010, 2010.
Utembe, S. R., Cooke, M. C., Archibald, A. T., Shallcross, D. E., Derwent, R. G., and Jenkin, M. E.: Simulating secondary organic aerosol in a 3-D Lagrangian chemistry transport model using the reduced Common Representative Intermediates mechanism (CRI v2-R5), Atmos. Environ., 45, 1604–1614, 2011.
Wiedinmyer, C., Akagi, S. K., Yokelson, R. J., Emmons, L. K., Al-Saadi, J. A., Orlando, J. J., and Soja, A. J.: The Fire INventory from NCAR (FINN): a high resolution global model to estimate the emissions from open burning, Geosci. Model Dev., 4, 625– 641, doi:10.5194/gmd-4-625-2011, 2011.
Wilson, K. R., Smith, J. D., Kessler, S. H., and Kroll, J. H.: The sta-tistical evolution of multiple generations of oxidation products in the photochemical aging of chemically reduced organic aerosol, Phys. Chem. Chem. Phys., 14, 1468–1479, 2012.
Yee, L. D., Kautzman, K. E., Loza, C. L., Schilling, K. A., Coggon, M. M., Chhabra, P. S., Chan, M. N., Chan, A. W. H., Hersey, S. P., Crounse, J. D., Wennberg, P. O., Flagan, R. C., and Seinfeld, J. H.: Secondary organic aerosol formation from biomass burn-ing intermediates: phenol and methoxyphenols, Atmos. Chem. Phys., 13, 8019–8043, doi:10.5194/acp-13-8019-2013, 2013. Ying, Q. and Li, J.: Implementation and initial application of the
near-explicit Master Chemical Mechanism in the 3-D Commu-nity Multiscale Air Quality (CMAQ) model, Atmos. Environ., 45, 3244–3256, 2011.
Zhang, X., Cappa, C. D., Jathar, S. H., McVay, R. C., Ensberg, J. J., Kleeman, M. J., and Seinfeld, J. H.: Influence of vapor wall loss in laboratory chambers on yields of secondary organic aerosol, P. Natl. Acad. Sci., 111, 5802–5807, 2014.