Economia Aplicada, v. 14, n. 2, 2010, pp. 183-198
THE PERCEPTION OF CORRUPTION IN A
CROSS-COUNTRY PERSPECTIVE: WHY ARE SOME
INDIVIDUALS MORE PERCEPTIVE THAN OTHERS?
Natalia Melgar* Máximo Rossi† Tom W. Smith‡
Abstract
We examine the foundations of corruption perception at the micro-level. Using micro and macro data, we focus on the incidence of personal characteristics and country effects. We extend previous researches by
es-timating sub-models taking into account differences in the countries of
residence. Our database comes from the 2004 International Social Survey Program survey that includes more than 35 countries. Ordered probit models were estimated in order to study the impact of independent vari-ables on the perceived level of corruption. This article argues that there are socio-demographic variables that play a relevant role in determining corruption perception (such as: gender, education, etc.). We find that country of residence matters and the model shows some relevant patters of behavior. Finally, we find a strong relationship between our ranking of countries and the Corruption Perception Index computed by Trans-parency International.
Keywords:Corruption, Microeconomic behavior, Comparative research
JEL classification:D73, K42, O57
1
Introduction
The concept of corruption is employed in several areas and its connotations vary widely depending not only on societies but also on people. Corruption
is interpreted as a cultural phenomenon. Although there are very different
definitions, it is possible to find some elements in common that are connected
to the misuse of public office with the purpose of making private gains. This
paper focuses on this wide concept of corruption.
Our data source is the module on Citizenship of the 2004 International Social Survey Program (ISSP) survey. This survey asks respondents (approxi-mately 1.000 per country) their opinions on a great variety of issues, including international trade, migration, corruption, politics or religion. In addition, it
*Universidad de la República. Address: Constituyente 1502, 11200, Montevideo, Uruguay.
E-mail: [email protected] †Universidad de la República ‡NORC – University of Chicago
184 Melgar, Rossi and Smith Economia Aplicada, v.14, n.2
includes demographic and socio-economic data, such as: age, gender, educa-tion, etc.
Ordered probit models were estimated in order to study the impact of these multinomial variables on the individual’s perception of corruption. We conclude that some socio-demographic variables are significant determinants of the perceived level of corruption (such as: religion, the educational level, the employment sector, among others). Additionally, in almost all cases, the country of residence also has a significant impact. Taking into account eco-nomic and political characteristics, we find some clear pattern of behavior. Finally, we show that there is a strong relationship between our ranking of countries and the Corruption Perception Index computed by Transparency International.
The structure of the paper is as follows. The second section is theoretical in nature, and draws on the definition of corruption and the existing and well-developed theory on the subject. Section three sketches the main features of the econometric methods applied in this analysis, the data source and the description of variables. The forth section deals with results. Finally, the conclusions are presented in section five.
2
The Perception of Corruption as a Cultural Phenomenon: Some
Insights
The first problem of any comparative research on corruption is arriving at a definition which lends itself to cross-cultural and cross-national research. However, there is no consensus on what is understood as a corruption. This is mainly driven by the fact that this concept is influenced by cultural and
social aspects. For example,Marta et al.(2008) point out that there is a set of
background variables and personal characteristics that play a relevant role in shaping ethical perceptions and moral decisions such as religiousness.
In economic terms, there are several ways to define corruption. For
ex-ample,Werlin(1973) characterizes corruption as the use of public office for
private needs andBlackburn et al.(2004, p.5), consider public sector
corrup-tion as the illegal, or unauthorized, profiteering by officials who exploit their
positions to make personal gains. In order to emphasize the corruption at the
public sector,Shleifer & Vishny(1993, p.2), define it as the sale of state assets
by civil servants in order to make gains. Pope(2000) asserts that corruption
may take place where there is a combination of opportunity and inclination.
Those offering bribes may do so either because they want something they are
not entitled to, and bribe the official to bend the rules, or because they believe
that the official will not give them their entitlements without some
induce-ments being offered. On the other hand, officials may refuse to serve clients
unless a bribe is paid.
This paper focuses on a wide concept of corruption: the misuse of public
office with the purpose of making private gains; this definition incorporates
the notions of wrongly getting an advantage, pecuniary or otherwise, in
vio-lation of official duty and the rights of others.
The Perception of Corruption 185
characteristics. Moreover, since the definition of corruption depends on social and cultural factors, the same is true for corruption perception.
Even when corruption perception may differ from the current level of
corruption, these phenomena are related and high levels of corruption
per-ception are enough to cause negative effects in the economy. AsLambsdorff
(1999) shows corruption perception indexes are good indicators of the real
level of corruption and they allow researches to estimate different models
with other macroeconomic or socio-demographic data.
In general terms, the perception of corruption has favored the growth of institutional instability and the deterioration of the relationships among in-dividuals, institutions and States. Moreover, the perception of economic
cor-ruption would have devastating effects; it generates a “culture of distrust”
towards some institutions.
Cábelková (2001) studies the incentives to take corrupt actions and she
holds that this problem is affected by the individual perception about the level
of corruption and the authority’s level of tolerance.
Assuming that the individual is as a rational actor who takes decisions balancing benefits and cost, individual’s perception of corruption will vary depending on their individual characteristics such as values and moral views, which modify the perception of the expected costs and expected benefits. While a person could be against bribery regardless of the perceived level of corruption someone else’s views could depend on the existing level of corrup-tion.
Hence, following previous researches, (Mocan 2004,Seligson 2002,
VanRi-jckeghem & Weder 2001,Swamy et al. 2001,Ades & DiTella 1999,Kaufmann & Wei 2000,Mocan & Rees 2005) we hypothesize that personal characteristics are relevant predictors of the perceived level of corruption, given our data set we include variables such as: age, marital status, labor market activity, edu-cation, social status, gender and the location of the residence, among others.
Finally, according to Nelken & Levi(1996) comparative research should
not be confined to seeking out what there is in common but also in
under-standing the many relevant differences that could be connected to different
political contexts, culture and economic performance. Therefore, in order
to capture these country effects, we added dummies variables representing
country of residence.
For example, regarding democracy, it was found that democratic systems
tend to reduce corruption perception. Montinola & Jackman(2002) find that
political competition matters because the freedom of information helps
mon-itoring of public officials, thereby limiting their opportunities for corrupt
be-havior. Moreover, the possible turnover of power implies that politicians can-not always credibly promise that particular laws and regulations will con-tinue. This minimizes the size of bribes that rent-seekers are willing to pay. In
line with this,Rose-Ackerman(2001) asserts that a competitive electoral
186 Melgar, Rossi and Smith Economia Aplicada, v.14, n.2
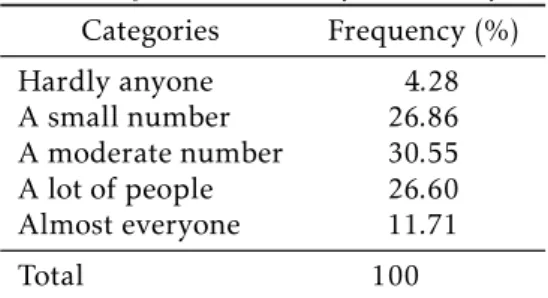
Table 1: Distribution of answers
Taking into account your experience, how widespread do you think corruption
is in the public service in your country?
Categories Frequency (%)
Hardly anyone 4.28
A small number 26.86
A moderate number 30.55
A lot of people 26.60
Almost everyone 11.71
Total 100
3
Data Source and Methodology
As mentioned, the data source is the module on Citizenship of the 2004
In-ternational Social Survey Program(ISSP) survey. The survey asks respondents
their opinions on a great variety of issues, including international trade, mi-gration, politics, taxes and corruption, as well as demographic and socio-economic information, such as age, gender, education, religiosity and others.
The question used in the survey to identify respondent’s perception of cor-ruption is:
Taking into account your experience, how widespread do you think corruption is in the public service in your country?
This question seeks to grasp citizen’s perception of corruption and answers take values between 0 and 4 which correspond to the following categories:
• 0 if respondent answers “hardly anyone”,
• 1 if respondent indicates “a small number”,
• 2 if respondent says “a moderate number”,
• 3 if respondent replies “a lot of people” and
• 4 if respondent responds “almost everyone”.
Table1shows the weighted frequency distribution of the answers to this
question in the whole sample (more than 45,000 respondents).
Our ordered probit models aim at determining how different personal
characteristics and country of residence shape the formation of opinions to-wards the level of corruption among civil servants.
The estimated parameters do not provide direct information on the re-lationship between the independents and dependent variables. Substantive interpretations are based on the prediction of probabilities and functions of
these probabilities. These predictions are made for different groups of
indi-viduals and the marginal effects of the independent variables are calculated.
If the independent variable is binary, the marginal effect is the change from
The Perception of Corruption 187
Table 2: Country abbreviations
Abbreviation Country Abbreviation Country
AT Austria IL Israel
AU Australia JP Japan
BG Bulgaria KR South Korea
BR Brazil LV Latvia
CA Canada MX Mexico
CH Switzerland NL Netherlands
CL Chile NO Norway
CY Cyprus NZ New Zealand
CZ Czech Republic PH Philippines
DEE East Germany PL Poland
DEW West Germany PT Portugal
DK Denmark RU Russia
ES Spain SE Sweden
FI Finland SI Slovenia
FLA Flanders SK Slovakia
FR France TW Taiwan
GB Great Britain US United States
HU Hungary UY Uruguay
IE Ireland VE Venezuela
4
Results
The model includes dummy variables representing individual characteristics
and in order to capture country effects, we include dummy variables that
equal one if respondent lives in that country and zero in other case.
We also compute the marginal effects and their standard errors after
es-timation. Rather than reporting coefficients, tables 4 and 5report the
dis-crete change in the probability for each model and significant variable. The
marginal effects are nonlinear functions of the estimated parameters, so they
cannot generally be inferred directly from the estimated parameters.
As could be seen in table4, the probability of perceiving the highest level
of corruption, for the whole sample, is 5.6%. MI countries registered the high-est probability (20%) and the EU shows the lowhigh-est probability (1.9%).
4.1 The general model
As we hypothesized, several personal characteristics play a relevant role in determining the perception of corruption at the micro level.
Firstly, the model shows that there is a significant gender bias and that women are more likely to perceive a higher level of corruption than men.
Secondly, findings indicate that the variables reflecting age are not
signif-icant; this result implies that there are no significant differences among age
groups or life course adjustment that significantly change the perception of corruption.
188 Melgar, Rossi and Smith Economia Aplicada, v.14, n.2
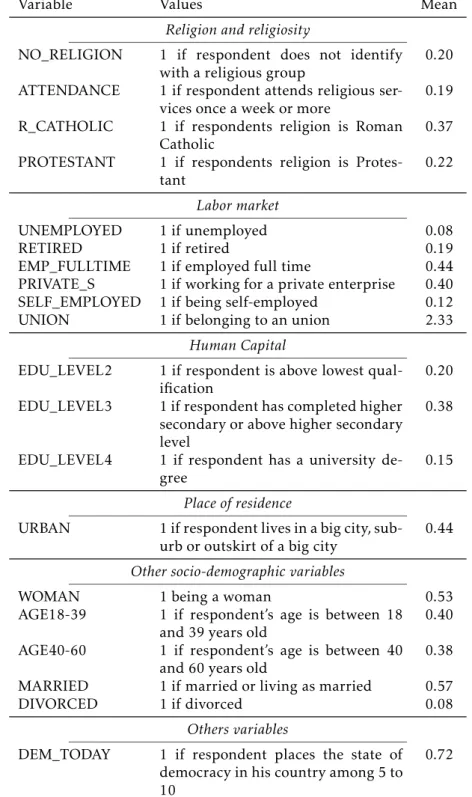
Table 3: Description of independent variables
Variable Values Mean
Religion and religiosity
NO_RELIGION 1 if respondent does not identify
with a religious group
0.20
ATTENDANCE 1 if respondent attends religious
ser-vices once a week or more
0.19
R_CATHOLIC 1 if respondents religion is Roman
Catholic
0.37
PROTESTANT 1 if respondents religion is
Protes-tant
0.22
Labor market
UNEMPLOYED 1 if unemployed 0.08
RETIRED 1 if retired 0.19
EMP_FULLTIME 1 if employed full time 0.44
PRIVATE_S 1 if working for a private enterprise 0.40
SELF_EMPLOYED 1 if being self-employed 0.12
UNION 1 if belonging to an union 2.33
Human Capital
EDU_LEVEL2 1 if respondent is above lowest
qual-ification
0.20
EDU_LEVEL3 1 if respondent has completed higher
secondary or above higher secondary level
0.38
EDU_LEVEL4 1 if respondent has a university
de-gree
0.15
Place of residence
URBAN 1 if respondent lives in a big city,
sub-urb or outskirt of a big city
0.44
Other socio-demographic variables
WOMAN 1 being a woman 0.53
AGE18-39 1 if respondent’s age is between 18
and 39 years old
0.40
AGE40-60 1 if respondent’s age is between 40
and 60 years old
0.38
MARRIED 1 if married or living as married 0.57
DIVORCED 1 if divorced 0.08
Others variables
DEM_TODAY 1 if respondent places the state of
democracy in his country among 5 to 10
T h e P er ce p tio n of C or ru p tio n 1 8 9
Table 4: Impact of significant personal characteristics
ALL BIG SMALL EU NOEU HI MI
PROBABILITY (%) 5.6 8.5 3.6 1.9 9.2 2 20
WOMAN 0.005
(0.002) ∗∗∗
− 0.003
(0.002)
∗ 0.005
(0.001) ∗∗∗
− 0.003
(0.001) ∗∗∗
−
MARRIED −0.004
(0.002) ∗∗∗
−0.007
(0.003) ∗∗∗
−0.003
(0.002) ∗
−0.002
(0.001) ∗∗
−0.006
(0.003) ∗∗
−0.002
(0.001) ∗∗∗
−
DIVORCED 0.007
(0.003) ∗∗
− 0.006
(0.003)
∗∗ 0.003
(0.002) ∗
− 0.005
(0.002) ∗∗∗
−
EDU_LEVEL3 −0.010
(0.003) ∗∗∗
−0.014
(0.005) ∗∗
−0.007
(0.002) ∗∗∗
−0.008
(0.002) ∗∗∗
−0.008
(0.004) ∗
−0.007
(0.002) ∗∗∗
−
EDU_LEVEL4 −0.028
(0.004) ∗∗∗
−0.038
(0.009) ∗∗∗
−0.020
(0.003) ∗∗∗
−0.014
(0.003) ∗∗∗
−0.033
(0.007) ∗∗∗
−0.015
(0.002) ∗∗∗
−0.028
(0.014) ∗
EMP_FULLTIME −0.004
(0.002) ∗
− − − − − −
UNEMPLOYED − − − − − 0.006
(0.003) ∗∗
−
PRIVATE_S 0.011 (0.002)
∗∗∗ 0.017
(0.004)
∗∗∗ 0.007
(0.002)
∗∗∗ 0.003
(0.002)
∗∗∗ 0.017
(0.003)
∗∗∗ 0.005
(0.001)
∗∗∗ 0.018
(0.007) ∗∗
SELF_EMPLOYED 0.016 (0.003)
∗∗∗ 0.023
(0.006)
∗∗∗ 0.011
(0.002)
∗∗∗ 0.005
(0.002)
∗∗∗ 0.025
(0.005)
∗∗∗ 0.008
(0.002)
∗∗∗ 0.034
(0.009) ∗∗∗
UNION − − − −0.001
(0.000) ∗∗
− − −
ATTENDANCE −0.005
(0.002)
∗∗ − −0.007
(0.002)
∗∗∗ −0.006 (0.001)
∗∗∗ − −0.003
(0.001)
∗∗∗ −
DEM_TODAY −0.070
(0.007) ∗∗∗
−0.084
(0.011) ∗∗∗
−0.056
(0.007) ∗∗∗
−0.040
(0.009) ∗∗∗
−0.090
(0.009) ∗∗∗
−0.043
(0.006) ∗∗∗
−0.118
(0.012) ∗∗∗
URBAN − − − − − − 0.021
(−0.012) ∗
Observations 37681 17673 20008 13211 24470 24333 13348
PseudoR2 0.136 0.128 0.138 0.082 0.13 0.103 0.055
1 9 0 M elg ar , R os si an d Sm ith E co n om ia A p lic ad a, v.1 4 , n .2
Table 5: Country effects
Model 1 Model 2 Model 3 Model 4 Model 5 Model 6 Model 7
all countries big countries small countries EU countries non-EU countries HI countries MI countries
BR 0.392
(0.008)
∗∗∗ VE −0.086
(0.005)
∗∗∗ BG 0.036
(0.002)
∗∗∗ PT 0.063
(0.003)
∗∗∗ VE −0.095
(0.004)
∗∗∗ IL 0.090
(0.004)
∗∗∗ VE −0.077
(0.009)
∗∗∗
VE 0.294
(0.011)
∗∗∗ MX −0.115
(0.005)
∗∗∗ SI −0.082
(0.002)
∗∗∗ ES −0.002
(0.000)
∗∗∗ MX −0.123
(0.004)
∗∗∗ PT −0.015
(0.002)
∗∗ MX −0.118
(0.007)
∗∗∗
MX 0.271
(0.009)
∗∗∗ PL −0.155
(0.006)
∗∗∗ CZ −0.086
(0.002)
∗∗∗ FLA −0.007
(0.001)
∗∗∗ BG −0.155
(0.006)
∗∗∗ JP −0.023
(0.001)
∗∗∗ BG −0.162
(0.012)
∗∗∗
BG 0.232
(0.013)
∗∗∗ RU −0.172
(0.008)
∗∗∗ PT −0.094
(0.002)
∗∗∗ SE −0.015
(0.002)
∗∗∗ PL −0.170
(0.005)
∗∗∗ US −0.043
(0.001)
∗∗∗ PL −0.164
(0.008) PL 0.223
(0.010)
∗∗∗ PH −0.211
(0.008)
∗∗∗ CL −0.096
(0.002)
∗∗∗ AT −0.016
(0.002)
∗∗∗ RU −0.191
(0.006)
∗∗∗ FR −0.073
(0.002)
∗∗∗ SK −0.196
(0.007)
∗∗∗
RU 0.194
(0.013)
∗∗∗ KR −0.288
(0.009)
∗∗∗ UY −0.096
(0.002)
∗∗∗ NL −0.025
(0.003)
∗∗∗ IL −0.204
(0.006)
∗∗∗ IE −0.073
(0.002)
∗∗∗ RU −0.198
(0.011)
∗∗∗
IL 0.189
(0.011)
∗∗∗ JP −0.305
(0.009)
∗∗∗ LV −0.097
(0.002)
∗∗∗ GB −0.027
(0.003)
∗∗∗ SK −0.207
(0.005)
∗∗∗ ES −0.073
(0.002)
∗∗∗ PH −0.211
(0.008)
SK 0.184
(0.008)
∗∗∗ US −0.334
(0.010)
∗∗∗ HU −0.121
(0.002)
∗∗∗ FI −0.030
(0.003)
∗∗∗ PH −0.222
(0.006)
∗∗∗ CA −0.074
(0.002)
∗∗∗ CL −0.297
(0.009)
∗∗∗
PH 0.174
(0.009)
∗∗∗ TW −0.346
(0.011)
∗∗∗ IE −0.157
(0.003)
∗∗∗ DK −0.030
(0.003)
∗∗∗ CZ −0.289
(0.007)
∗∗∗ DEW −0.074
(0.002)
∗∗∗ LV −0.307
(0.009)
∗∗∗
SI 0.102
(0.007)
∗∗∗ DEE −0.365
(0.011)
∗∗∗ FLA −0.162
(0.003)
∗∗∗ IE † SI −0.289
(0.007)
∗∗∗ DEE −0.075
(0.002)
∗∗∗ UY −0.309
(0.009)
∗∗∗
CZ 0.102
(0.007)
∗∗∗ DEW −0.366
(0.011)
∗∗∗ SE −0.170
(0.004)
∗∗∗ DEE ‡ LV −0.302
(0.007)
∗∗∗ FLA −0.076
(0.002)
∗∗∗ HU −0.330
(0.009)
∗∗∗
KR 0.093
(0.007)
∗∗∗ FR −0.366
(0.011)
∗∗∗ AT −0.171
(0.003)
∗∗∗ DEW ‡ KR −0.303
(0.007)
∗∗∗ SE −0.082
(0.002)
∗∗∗ TW −0.366
(0.012) ∗∗∗
LV 0.089
(0.006)
∗∗∗ ES −0.368
(0.012)
∗∗∗ CH −0.178
(0.004)
∗∗∗ FR ‡ UY −0.305
(0.007)
∗∗∗ AT −0.084
(0.002)
∗∗∗ BR †
CL 0.086
(0.007)
∗∗∗ CA −0.371
(0.011)
∗∗∗ NO −0.179
(0.004)
∗∗∗ CL −0.306
(0.007)
∗∗∗ AU −0.087
(0.002) ∗∗∗
UY 0.086
(0.005)
∗∗∗ AU −0.389
(0.013)
∗∗∗ CY −0.180
(0.004)
∗∗∗ JP −0.319
(0.007)
∗∗∗ CH −0.090
(0.002)
∗∗∗
PT 0.086
(0.008)
∗∗∗ NL −0.395
(0.013)
∗∗∗ NZ −0.181
(0.004)
∗∗∗ HU −0.328
(0.008)
∗∗∗ NO −0.090
(0.002)
∗∗∗
JP 0.073
(0.007)
∗∗∗ GB −0.396
(0.012)
∗∗∗ FI −0.183
(0.004)
∗∗∗ US −0.346
(0.008)
∗∗∗ NL −0.091
(0.002)
∗∗∗
continues robust standard errors in parentheses
†indicates omitted variable
T h e P er ce p tio n of C or ru p tio n 1 9 1
Table 5: Country effects (continued)
Model 1 Model 2 Model 3 Model 4 Model 5 Model 6 Model 7
all countries big countries small countries EU countries non-EU countries HI countries MI countries
HU 0.062
(0.006)
∗∗∗ BR † DK −0.183
(0.004)
∗∗∗ TW −0.356
(0.009)
∗∗∗ CY −0.092
(0.002)
∗∗∗
US 0.049
(0.005)
∗∗∗ IL † CA −0.378
(0.009)
∗∗∗ GB −0.093
(0.002)
∗∗∗
TW 0.036
(0.006)
∗∗∗ SK ‡ AU −0.394
(0.009)
∗∗∗ NZ −0.093
(0.002)
∗∗∗
FR 0.019
(0.003)
∗∗∗ CH −0.397
(0.009)
∗∗∗ FI −0.095
(0.002)
∗∗∗
ES 0.018
(0.004)
∗∗∗ NO −0.398
(0.009)
∗∗∗ DK −0.095
(0.002) ∗∗∗
DEW 0.018
(0.004)
∗∗∗ CY −0.400
(0.009)
∗∗∗ KR †
IE 0.018
(0.004)
∗∗∗ NZ −0.401
(0.010)
∗∗∗ SI ‡
DEE 0.017
(0.004)
∗∗∗ BR † CZ ‡
CA 0.016
(0.003)
∗∗∗
FLA 0.015
(0.003)
∗∗∗
SE 0.006
(0.003)
∗∗∗
AT 0.005
(0.002)
∗∗∗
CH −0.003
(0.001)
∗∗∗
NO −0.004
(0.002)
∗∗∗
NL −0.005
(0.001)
∗∗∗
CY −0.006
(0.003)
∗∗∗
GB −0.006
(0.002)
∗∗∗
NZ −0.007
(0.002)
∗∗∗
FI −0.010
(0.003)
∗∗∗
DK −0.011
(0.003) ∗∗∗
AU †
robust standard errors in parentheses †indicates omitted variable
192 Melgar, Rossi and Smith Economia Aplicada, v.14, n.2
Moreover, as it was expected, the educational level is a relevant determi-nant of the perceived level of corruption. It is found that people who have completed, at least, secondary are more prone to perceive a lower level of corruption. This result could imply that the access to the information and the capability to process this information matter. More educated people have more information and better capabilities to process it. This fact shapes the perception of corruption at the micro level.
Regarding religion and religiosity, the models also confirms our
hypoth-esis. Firstly, there are no significant differences among religious groups
(Ro-man Catholic, Protestant and others) and the same happens if we compare people who identifies with some religious group and atheists. On the other hand, the degree of religiosity does influence corruption perception; the prob-ability of perceiving the highest level of corruption declines 0.5 percentage points if the person attends to religious services frequently.
Concerning labor market, we provide evidence on the significant impact of being self-employed. Specifically, this group of people tends to perceive a higher level of corruption. It might be possible that they are exposed to more incidents of corruption. The opposite is true in the case of full-time workers; these people tend to perceive a lower level of corruption.
Additionally, the sector of employment is a relevant determinant of cor-ruption perception. Those who are working in a private enterprise are more likely to perceive a higher level of corruption than those who are employed in the public sector. It is worth noting that those people who are on the de-mand side of the “bribes market” tend to perceive lower level of corruption than those people who are on the supply side of this market. The model also shows that other characteristics such as being unemployed, being retired and
belonging to a union make no relevant differences.
Connected to democracy, we find that those who have a favorable opinion on democracy are more likely to perceive a lower level of corruption. Hence, favorable opinions towards the political systems positively contribute to the
opinions about the level of corruption. In line with this finding, Goldsmith
(1999) andSandholtz & Koetzle(2000) argue that people living in countries
with democratic systems tend to perceive lower levels of corruption and citet-Treisman2000 shows that the same is true in the case of long exposure to democracy.
Taking into account the place of residence, results indicate that on one
hand, there is no significant difference among people living in urban areas and
others but on the other hand, it is worth noting that all country dummies are significant. This result means that there are significant cultural and political
differences that influence the perception of corruption. While most of them
show a positive sign, there is a small group of countries that register a negative
sign. We will explain this difference later.
Given the mentioned results we estimated six additional models by
con-sidering different groups of countries. We take into account the following
The Perception of Corruption 193
4.2 The sub-models
We find that there is a set of results that are maintained in all sub-models, in other words, they do not depend on the specific country’s characteristics.
In all sub-sample models, results indicate that: 1) the variables reflecting individual’s age are not significant, 2) the education level has a relevant and negative role in determining corruption perception, 3) there are no significant
differences among religious groups, 4) self-employed people tend to perceive
a higher level of corruption and as before the sector of employment is a deter-minant of corruption perception and 5) those who have a favorable opinion on democracy are more likely to perceive a lower level of corruption.
Additionally, the sub-models also show various relevant specificities. Firstly, the gender bias remains significant in three models (small coun-tries, EU countries and HI countries) and as before, that women are more likely to perceive a higher level of corruption than men.
Secondly, even when five sub-models show that married people tend to perceive a lower level of corruption, this is not true in the case of those living in MI countries. Moreover, those who are divorced are likely to perceive a higher level of corruption in small countries, EU countries and HI countries.
Thirdly, religiosity seems to play a relevant role only in the following cases: small countries, EU countries and HI countries and as before, it decreases the probability of perceiving the higher level of corruption.
Moreover, it is worth noting that only in HI countries, there is a significant
difference among people who are unemployed and those who are employed.
Moreover, only in the case of EU countries, those people who belong to a union are more likely to perceive a lower level of corruption.
When considering the place of residence, findings indicate that only in one
case, MI countries, there is a significant difference between those who live in
urban areas who are less likely to perceive a higher level of corruption than people living in rural areas.
Finally, it is worth noting that when examining country dummies, almost all variables are significant. This result might mean that significant cultural
and political differences that influence the perception of corruption remain
even when the countries have some characteristic in common.
4.3 Country effects
Firstly, we examine model 1 that includes all countries. However, sub-samples
models show that country effects remain significant. This finding indicate that
even when we consider groups of countries that have some characteristic in common, there are cultural, economic, political etc. influences that makes
significant differences in the perceived level of corruption.
The general model
The biggest impacts are found in Latin American countries: Brazil, Venezuela and Mexico. In these cases, the probability raises 39.2, 29.4 and 27.1 percent-age points respectively. In other words, Brazilians, Venezuelans and Mexicans tend to perceive a higher level of corruption.
194 Melgar, Rossi and Smith Economia Aplicada, v.14, n.2
Something similar happens in the case of Asia, with the exemption of Tai-wan, all countries are found in the first half of the table. On the contrary, with the exemption of Portugal, EU countries rank in the second half of the table. Similarly, Canada and United States, which belong to America but with
very different economic performance and cultural characteristics than Latin
American countries, show lower values (1.6 and 4.9 percentage points, respec-tively). Additionally, all Anglo-settlement colonies (Canada, New Zealand and United States) fall in the bottom half as do the majority of rich countries. As mentioned, our sample included 37 countries and only in eight cases,
we find a negative impact on the probability: Switzerland (−0.3 percentage
points), Norway (−0.4 percentage points), Cyprus (−0.6 percentage points),
Netherlands (−0.5 percentage points), Great Britain (−0.6 percentage points),
New Zealand (−0.7 percentage points), Finland (−1 percentage points) and
Denmark (−1.1 percentage points). It is worth noting that all of these
coun-tries are rich, small and four of them belong to the EU.
These results are in line withSandholtz & Koetzle(2000) andTreisman
(2000) who show that higher economic development is a good predictor of
lower perceived corruption. Moreover,Mauro(1995) argue that higher
per-ception of corruption is associated with a slower rate of economic growth. Analyzing political characteristics, we find another clear pattern of be-havior. The former Socialist states of Eastern Europe are located in the first half of the table showing impacts to 23.2 percentage points from 6.2 percent-age points, countries ranked as follow: Bulgaria, Poland, Russia, Slovakia, Slovenia, Czech Republic, Latvia and Hungary. This result could be related to the past experiences of corruption at the governmental level than to present events.
Regarding others characteristics such as whether the country was a colony
or official language, we do not find a clear pattern of behavior.
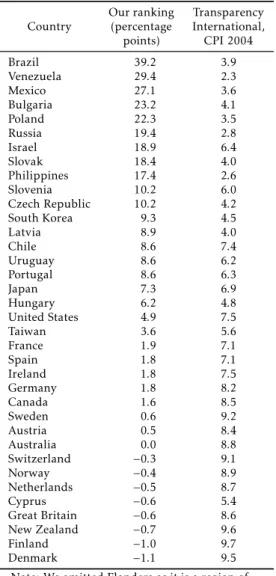
Given our previous results, we examine whether there is a relationship among our ranking of countries and the Corruption Perception Index (CPI, 2004) computed by Transparency International. As could be seen in table 6, the rankings seem to be related. In order to prove this, we employed the Spearman’s rank correlation test. The null hypothesis established that the variables are independent.
As expected we find that these rankings are correlated; the correlation
coefficient is 88.13 and the null hypothesis was rejected at 1%.
The sub-models
Firstly, it should be noted that almost all country dummies remain significant and the ranking of countries also remains. Hence, even when all countries in a
sub-sample have some element in common, the significant differences among
them remain. The marginal effects and the positions should be reinterpreted
by considering that the omitted variable has changed.
Secondly, the sub-models add some elements to the discussion. When con-sidering big countries (model 2), we find that Anglo-settlement colonies show
a different pattern of behavior: while United States is found in the first half
of the table, Canada and Australia registered larger changes that imply much
greater differences with Brazil (the omitted variable). Small countries model
The Perception of Corruption 195
Table 6: Corruption Perception Rankings
Our ranking Transparency Country (percentage International, points) CPI 2004 Brazil 39.2 3.9
Venezuela 29.4 2.3
Mexico 27.1 3.6
Bulgaria 23.2 4.1
Poland 22.3 3.5
Russia 19.4 2.8
Israel 18.9 6.4
Slovak 18.4 4.0
Philippines 17.4 2.6
Slovenia 10.2 6.0
Czech Republic 10.2 4.2
South Korea 9.3 4.5
Latvia 8.9 4.0
Chile 8.6 7.4
Uruguay 8.6 6.2
Portugal 8.6 6.3
Japan 7.3 6.9
Hungary 6.2 4.8
United States 4.9 7.5
Taiwan 3.6 5.6
France 1.9 7.1
Spain 1.8 7.1
Ireland 1.8 7.5
Germany 1.8 8.2
Canada 1.6 8.5
Sweden 0.6 9.2
Austria 0.5 8.4
Australia 0.0 8.8
Switzerland −0.3 9.1
Norway −0.4 8.9
Netherlands −0.5 8.7
Cyprus −0.6 5.4
Great Britain −0.6 8.6
New Zealand −0.7 9.6
Finland −1.0 9.7
Denmark −1.1 9.5
Note: We omitted Flanders as it is a region of Belgium
negative impacts are found in European countries (such as Denmark and Fin-land.
196 Melgar, Rossi and Smith Economia Aplicada, v.14, n.2
Considering HI countries (model 6), findings indicate that with the ex-emption of Israel, all people perceive a lower level of corruption that those liv-ing in South Korea. It is important to notice that Czech Republic and Slovenia (ex-Socialist states of Eastern Europe) are not significant and that, there is no Latin American country in this sub-sample. Regarding EU countries, Portu-gal shows the smaller negative impact. Once again, Anglo-settlement colonies present a heterogeneous behavior: while Canada and United States rank in the first half of the table, New Zealand is situated in the second half. Regarding MI countries (model 7) all country variables show a significant negative im-pact in the assessed probability with respect to Brazil. While Venezuela and Mexico ranked first, Uruguay and Chile are found in the second half of the ta-ble. This sub-sample includes European countries and all of them are former Socialist states of Eastern Europe. While Bulgaria, Poland, Slovakia and Rus-sia are situated in the first half of the table; Latvia and Hungary are founded in the second half.
5
Conclusions
This study’s main contributions are threefold and we extend previous litera-ture and previous public opinion research examining not only personal
char-acteristics but also country effects.
Firstly, by employing a large dataset and estimating by country groups, we present econometric evidence that verify previous findings. Being a woman, the education level, the marital status, the attendance to religious services, being self-employed and the opinions towards the political system, among others, are factors that modify the probability of perceiving corruption.
Secondly, new evidence was provided about the effects of the sector of
employment. In all models, those who work in the private sector are more likely to perceive higher corruption than civil servants. This means that those people who are on the demand side of the “bribes market” tend to perceive lower corruption than those people who are on the supply side of this market.
Thirdly, taking into account country-effects, as expected; in almost all
cases country dummies are significant. Findings indicate that country effects
are linked to past experiences of corruption or the lack of them as well as to economic development, well-being and cultural factors. We find that all Latin American countries show changes which are higher than the average and the same is true for ex-Socialist states and the majority of East Asian countries. On the contrary, with the exemption of Portugal, European coun-tries showed lower changes than the average. We also find that all Anglo-settlement colonies fall in the bottom half as do the majority of rich countries. Finally, we find that our ranking of countries is correlated with Trans-parency International Corruption Perception Index (2004); the correlation
co-efficient is−88.13.
Bibliography
Ades, A. & DiTella, R. (1999), ‘Rents, competition and corruption’,American
Economic Review89, 982–993.
The Perception of Corruption 197
Cábelková, I. (2001), Perceptions of corruption in ukraine: Are they correct?, Technical report, CERGE-EI.
Goldsmith, A. (1999), ‘Slapping the grasping hand: correlates of political
corruption in emerging markets’,American Journal of Economics and Sociology
53, 865–883.
Kaufmann, D. & Wei, S. J. (2000), Does “grease money” speed up the wheels of commerce?, Technical report, International Monetary Fund.
Lambsdorff, J. G. (1999), The Transparency International Corruption
Percep-tions Index, Transparency International Newsletter.
Marta, J., Heiss, C. & DeLugio, S. (2008), ‘An explanatory comparison of
ethical perceptions of Mexican and U.S. marketers’,Journal of Business Ethics
82, 539–555.
Mauro, P. (1995), ‘Corruption and growth’, Quarterly Journal of Economics
110, 681–712.
Mocan, N. (2004), ‘What determines corruption? international evidence
from micro-data’,Economic Inquiry46, 493–510.
Mocan, N. & Rees, D. (2005), ‘Economic conditions, deterrence and
juve-nile crime: evidence from micro data’,American Law and Economics Review
7, 319–349.
Montinola, G. & Jackman, R. W. (2002), ‘Sources of corruption: a
cross-country study’,British Journal of Political Science32, 147–170.
Nelken, D. & Levi, M. (1996), ‘The corruption of politics and the politics of
corruption: an overview’,Journal of Law and Society23, 1–17.
Pope, J. (2000),Transparency International, Confronting Corruption: The
Ele-ments of a National Integrity System, Transparency International Source Book.
Rose-Ackerman, S. (2001), ‘Trust, honesty and corruption: reflection on the
state-building process’,European Journal of Sociology42, 27–71.
Sandholtz, W. & Koetzle, K. (2000), ‘Accounting for corruption: economic
structure, democracy and trade’,International Studies Quarterly44, 31–50.
Seligson, M. (2002), ‘The impact of corruption on regime legitimacy: a
comparative study of four latin american countries’, The Journal of Politics
64, 408–433.
Shleifer, A. & Vishny, R. (1993), ‘Corruption’,Quarterly Journal of Economics
108, 599–617.
Swamy, A., Knack, S., Lee, Y. & Azfar, O. (2001), ‘Gender and corruption’,
Journal of Development Economics64, 25–55.
Treisman, D. (2000), ‘The causes of corruption: a cross-national study’,
198 Melgar, Rossi and Smith Economia Aplicada, v.14, n.2
VanRijckeghem, C. & Weder, B. (2001), ‘Bureaucratic corruption and the rate
of temptation: do wages in the civil service affect corruption and by how
much?’,Journal of Development Economics65, 307–331.
Werlin, H. (1973), ‘The consequences of corruption: The ghanaian