Perceived Health
Jordi Alonso1,2,3*, Gemma Vilagut1, Nu´ria D. Adroher1,3, Somnath Chatterji4, Yanling He5, Laura Helena Andrade6, Evelyn Bromet7, Ronny Bruffaerts8, John Fayyad9,10, Silvia Florescu11, Giovanni de Girolamo12, Oye Gureje13, Josep Maria Haro14,15, Hristo Hinkov16, Chiyi Hu17, Noboru Iwata18, Sing Lee19, Daphna Levinson20, Jean Pierre Le´pine21, Herbert Matschinger22, Maria Elena Medina-Mora23, Siobhan O’Neill24, J. Hormel25, Jose A. Posada-Villa26, Nezar Ismet Taib27, Miguel Xavier28, Ronald C. Kessler29
1IMIM-Institut Hospital del Mar d’Investigacions Me`diques, Barcelona, Spain,2Pompeu Fabra University, Barcelona, Spain,3CIBER en Epidemiologı´a y Salud Pu´blica, Barcelona, Spain,4World Health Organization, Geneva, Switzerland,5Shangai Mental Health Center, Shangai, People’s Republic of China,6Institute of Psychiatry University of Sa˜o Paulo Medical School, Sa˜o Paulo, Brazil,7State University of New York at Stony Brook, Stony Brook, New York, United States of America,8Universitair Psychiatrisch Centrum - Katholieke Universiteit Leuven, Leuven, Belgium,9Institute for Development Research, Advocacy, and Applied Care, Beirut, Lebanon,10St. George Hospital University Medical Center, Beirut, Lebanon,11National School of Public Health Management and Professional Development, Bucharest, Romania, 12IRCCS Centro S. Giovanni di Dio Fatebenefratelli, Brescia, Italy,13University College Hospital, Ibadan, Nigeria,14Parc Sanitari Sant Joan de De´u, Sant Boi de Llobregat, Barcelona, Spain,15CIBERSAM, Sant Boi de Llobregat, Barcelona, Spain,16National Center for Public Health Protection, Sofia, Bulgaria,17Shenzhen Institute of Mental Health and Shenzhen Kangning Hospital, Guangdong Province, People’s Republic of China,18Hiroshima International University, Higashi-Hiroshima, Japan,19The Chinese University of Hong Kong, Shatin, HKSAR,20Ministry of Health, Jerusalem, Israel,21Hoˆpital Saint-Louis Lariboisie`re Fernand Widal, Paris, France,22Universita¨t Leipzig, Leipzig, Germany, 23Instituto Nacional de Psiquiatria Ramon de la Fuente, Mexico City, Mexico,24University of Ulster, Londonderry, United Kingdom, 25University Medical Center Groningen, Groningen, The Netherlands,26Pontificia Universidad Javeriana, Bogota D.C., Colombia,27Mental Health Center-Duhok, Kurdistan Region, Iraq,28Universidade Nova de Lisboa, Lisbon, Portugal,29Harvard Medical School, Boston, Massachusetts, United States of America
Abstract
Background:We examined the extent to which disability mediates the observed associations of common mental and physical conditions with perceived health.
Methods and Findings: WHO World Mental Health (WMH) Surveys carried out in 22 countries worldwide (n = 51,344 respondents, 72.0% response rate). We assessed nine common mental conditions with the WHO Composite International Diagnostic Interview (CIDI), and ten chronic physical with a checklist. A visual analog scale (VAS) score (0, worst to 100, best) measured perceived health in the previous 30 days. Disability was assessed using a modified WHO Disability Assessment Schedule (WHODAS), including: cognition, mobility, self-care, getting along, role functioning (life activities), family burden, stigma, and discrimination. Path analysis was used to estimate total effects of conditions on perceived health VAS and their separate direct and indirect (through the WHODAS dimensions) effects. Twelve-month prevalence was 14.4% for any mental and 51.4% for any physical condition. 31.7% of respondents reported difficulties in role functioning, 11.4% in mobility, 8.3% in stigma, 8.1% in family burden and 6.9% in cognition. Other difficulties were much less common. Mean VAS score was 81.0 (SD = 0.1). Decrements in VAS scores were highest for neurological conditions (9.8), depression (8.2) and bipolar disorder (8.1). Across conditions, 36.8% (IQR: 31.2–51.5%) of the total decrement in perceived health associated with the condition were mediated by WHODAS disabilities (significant for 17 of 19 conditions). Role functioning was the dominant mediator for both mental and physical conditions. Stigma and family burden were also important mediators for mental conditions, and mobility for physical conditions.
Citation:Alonso J, Vilagut G, Adroher ND, Chatterji S, He Y, et al. (2013) Disability Mediates the Impact of Common Conditions on Perceived Health. PLoS ONE 8(6): e65858. doi:10.1371/journal.pone.0065858
Editor:Wendy Wing Tak Lam, The University of Hong Kong, Hong Kong ReceivedJuly 30, 2012;AcceptedMay 2, 2013;PublishedJune 6, 2013
Copyright:ß2013 Alonso et al. This is an open-access article distributed under the terms of the Creative Commons Attribution License, which permits
unrestricted use, distribution, and reproduction in any medium, provided the original author and source are credited.
Funding:The World Health Organization World Mental Health (WMH) Survey Initiative is supported by the National Institute of Mental Health (NIMH; R01 MH070884), the John D. and Catherine T. MacArthur Foundation, the Pfizer Foundation, the US Public Health Service (R13-MH066849, R01-MH069864, and R01 DA016558), the Fogarty International Center (FIRCA R03-TW006481), the Pan American Health Organization, Eli Lilly and Company, Ortho-McNeil Pharmaceutical, Inc., GlaxoSmithKline, and Bristol-Myers Squibb. Each WMH country obtained funding for its own survey. The Sa˜o Paulo Megacity Mental Health Survey is supported by the State of Sa˜o Paulo Research Foundation Thematic Project Grant 03/00204-3. The Bulgarian Epidemiological Study of common mental disorders EPIBUL is supported by the Ministry of Health and the National Center for Public Health Protection. The Chinese World Mental Health Survey Initiative is supported by the Pfizer Foundation. The Shenzhen Mental Health Survey is supported by the Shenzhen Bureau of Health and the Shenzhen Bureau of Science, Technology, and Information. The Colombian National Study of Mental Health is supported by the Ministry of Social Protection. The ESEMeD project is funded by the European Commission (Contracts QLG5-1999-01042; SANCO 2004123, and EAHC 20081308), the Piedmont Region (Italy), Fondo de Investigacio´n Sanitaria, Instituto de Salud Carlos III, Spain (FIS 00/0028), Ministerio de Ciencia y Tecnologı´a, Spain (SAF 2000-158-CE), Departament de Salut, Generalitat de Catalunya, Spain, Instituto de Salud Carlos III (CIBER CB06/02/0046, RETICS RD06/0011 REM-TAP), and other local agencies and by an unrestricted educational grant from GlaxoSmithKline. The Epidemiological Study on Mental Disorders in India was funded jointly by the Government of India and the World Health Organization (WHO). Implementation of the Iraq Mental Health Survey (IMHS) and data entry were carried out by the staff of the Iraqi MOH and MOP with direct support from the Iraqi IMHS team with funding from both the Japanese and European Funds through United Nations Development Group Iraq Trust Fund. The Israel National Health Survey is funded by the Ministry of Health with support from the Israel National Institute for Health Policy and Health Services Research and the National Insurance Institute of Israel. The World Mental Health Japan Survey is supported by the Grant for Research on Psychiatric and Neurological Diseases and Mental Health (H13-SHOGAI-023, H14-TOKUBETSU-026, H16-KOKORO-013) from the Japan Ministry of Health, Labour and Welfare. The Lebanese National Mental Health Survey is supported by the Lebanese Ministry of Public Health, the WHO (Lebanon), National Institute of Health/Fogarty International Center (R03 TW006481-01), anonymous private donations to IDRAAC, Lebanon, and unrestricted grants from Janssen Cilag, Eli Lilly, GlaxoSmithKline, Astra Zeneca, Hikma Pharm and Novartis. The Mexican National Comorbidity Survey is supported by The National Institute of Psychiatry Ramon de la Fuente (INPRFMDIES 4280) and by the National Council on Science and Technology (CONACyT-G30544- H), with supplemental support from the PanAmerican Health Organization (PAHO). The Nigerian Survey of Mental Health and Wellbeing is supported by the WHO (Geneva), the WHO (Nigeria), and the Federal Ministry of Health, Abuja, Nigeria. The Northern Ireland Study of Mental Health was funded by the Health & Social Care Research & Development Division of the Public Health Agency. The Portuguese Mental Health Study was carried out by the Department of Mental Health, Faculty of Medical Sciences, NOVA University of Lisbon, with collaboration of the Portuguese Catholic University, and was funded by Champalimaud Foundation, Gulbenkian Foundation, Foundation for Science and Technology and Ministry of Health. The Romania WMH study projects ‘‘Policies in Mental Health Area’’ and ‘‘National Study regarding Mental Health and Services Use’’ were carried out by National School of Public Health & Health Services Management (former National Institute for Research & Development in Health, present National School of Public Health Management & Professional Development, Bucharest), with technical support of Metro Media Transilvania, the National Institute of Statistics – National Centre for Training in Statistics, SC. Cheyenne Services SRL, Statistics Netherlands and were funded by Ministry of Public Health (former Ministry of Health) with supplemental support of Eli Lilly Romania SRL. The Ukraine Comorbid Mental Disorders during Periods of Social Disruption study is funded by the US National Institute of Mental Health (RO1-MH61905). The US National Comorbidity Survey Replication is supported by the National Institute of Mental Health (NIMH; U01-MH60220) with supplemental support from the National Institute of Drug Abuse, the Substance Abuse and Mental Health Services Administration, the Robert Wood Johnson Foundation (RWJF; Grant 044708), and the John W. Alden Trust. All the funders had no role in study design, data collection and analysis, decision to publish, or preparation of the manuscript.
Competing Interests:Dr. Kessler has been a consultant for AstraZeneca, Analysis Group, Bristol-Myers Squibb, Cerner-Galt Associates, Eli Lilly & Company, GlaxoSmithKline Inc., HealthCore Inc., Health Dialog, Hoffman-LaRoche, Inc., Integrated Benefits Institute, John Snow Inc., Kaiser Permanente, Matria Inc., Mensante, Merck & Co, Inc., Ortho-McNeil Janssen Scientific Affairs, Pfizer Inc., Primary Care Network, Research Triangle Institute, Sanofi-Aventis Groupe, Shire US Inc., SRA International, Inc., Takeda Global Research & Development, Transcept Pharmaceuticals Inc., and Wyeth-Ayerst. Dr. Kessler has served on advisory boards for Appliance Computing II, Eli Lilly & Company, Mindsite, Ortho-McNeil Janssen Scientific Affairs, Johnson & Johnson, Plus One Health Management and Wyeth-Ayerst. Dr. Kessler has had research support for his epidemiological studies from Analysis Group Inc., Bristol-Myers Squibb, Eli Lilly & Company, EPI-Q, GlaxoSmithKline, Johnson & Johnson Pharmaceuticals, Ortho-McNeil Janssen Scientific Affairs., Pfizer Inc., Sanofi-Aventis Groupe, Shire US, Inc., and Walgreens Co. Dr. Kessler owns 25% share in DataStat, Inc. This study was partly funded by Eli Lilly and Company, Ortho-McNeil Pharmaceutical, Inc., GlaxoSmithKline, and Bristol-Myers Squibb. The ESEMeD project is partly funded by an unrestricted educational grant from GlaxoSmithKline. The Lebanese National Mental Health Survey is partly supported by unrestricted grants from Janssen Cilag, Eli Lilly, GlaxoSmithKline, Astra Zeneca, Hikma Pharm and Novartis. The Romania WMH study projects ‘‘Policies in Mental Health Area’’ and ‘‘National Study regarding Mental Health and Services Use with technical support of SC. Cheyenne Services SRL. Statistics Netherlands and were partly funded by supplemental support of Eli Lilly Romania SRL. There are no patents, products in development or marketed products to declare. This does not alter the authors’ adherence to all the PLOS ONE policies on sharing data and materials, as detailed online in the guide for authors.
* E-mail: [email protected]
Introduction
Perceived or self-rated health is widely recognized as an important indicator of health [1,2] and is often used to monitor health trends in the general population [3] as well as to assess patient-centered outcomes in clinical studies [4]. Although the need to go beyond an exclusive focus on perceptions has been pointed out [5,6], perceived health is nonetheless an important indicator variable that has been shown to predict mortality independently of the presence and severity of disease and risk factors [7], as well as to predict health services utilization and health care costs [8], and future disability [9,10].
Chronic conditions are among the most important predictors of perceived health [11–15]. Some conditions, such as those causing pain, are known to be associated with great decrements in perceived health [16]. We previously reported important decre-ments in perceived health associated with neurological conditions, depression and arthritis once the presence of other conditions had
been taken into account [17]. A higher impact of mental conditions (as compared to other medical conditions) on perceived health has also been reported [18].
Prevalent conceptual frameworks and models of health propose that disability mediates the impact of chronic conditions on perceived health [19–21]. A mediation model proposes a causal mechanism of relation between an independent variable (i.e., chronic conditions) which has an effect on a third explanatory variable, the mediator (i.e., disability), which in turn influences an outcome (i.e., perceived health) [22–23]. Consistent with this model, mounting evidence shows that disability is significantly associated with perceived health both cross-sectionally [14,24] and longitudinally [15,24,25]. There is also evidence that chronic conditions are significantly associated with disability [26–28]. A few studies have assessed the mediating role of disability in the association of chronic conditions and mental health [29,30]. However, we are not aware of any systematic attempt to identify the extent to which different dimensions of disability mediate the Disability Mediates Health in Chronic Conditions
overall associations of chronic conditions with perceived health in epidemiological samples. Such an analysis could have value in enhancing our understanding of the pathways that link chronic conditions to perceived health. In turn, this could help customizing condition-specific interventions aimed at ameliorating the disabil-ities that lead to significant decrements in perceived health.
In this paper we explore the extent to which a multidimensional assessment of disability mediates the associations of 19 chronic conditions (9 mental, 10 physical) on perceived health in surveys of the WHO World Mental Health (WMH) surveys initiative [31], a consortium of cross-sectional general population epidemiological surveys carried out in 22 developing and developed countries throughout the world. We focus not only on the extent to which disability mediates the total effects of each condition, but also on the relative importance of individual disability dimensions and how it varies across type of conditions. We had hypothesized that a significant proportion of the decrease in perceived health status associated to mental and physical conditions would be mediated by specific disability dimensions. We also anticipated that the pattern of disability mediation (i.e., the portion of the effect of the chronic condition on perceived health VAS score that was explained by its association with the disability dimensions and the association of the latter with perceived health) could be different for mental and for physical conditions.
Methods
Sample
A total of 23 surveys were carried out in 22 countries, 6 classified by the World Bank (2009), at the time of data collection, as low and lower-middle income (Colombia, India (Pondicherry region), Iraq, Nigeria, Peoples’ Republic of China (cities of Beijing/Shanghai and Shenzhen), and Ukraine), 5 upper-middle income countries (Brazil –Sao Paulo metropolitan area-, Bulgaria, Lebanon, Mexico and Romania) and 11 high income (Belgium, France, Germany, Israel, Italy, Japan, Netherlands, Northern Ireland, Portugal, Spain, and United States of America). Informed consent was obtained before beginning interviews, using proce-dures approved by the institutional review board of the organization coordinating the survey in each country (please, see additional online table). The weighted average response rate across countries was 72.0%, with country-specific response rates ranging from 45.9% (France) to 87.7% (Colombia). All surveys were based on probability samples of the country’s adult household population that were either nationally representative (in the majority of countries) or representative of particular regions of the country (in China, Colombia, India, Japan, and Mexico). The age ranges of the sample varied across participating countries. Most countries had a minimum age of 18 years, while the minimum in Japan and Israel were 20 and 21, respectively. The upper age was unrestricted in most surveys but was 70 in China and 65 in Colombia and Mexico. Additional details about sampling and respondents are available elsewhere.
All interviews were conducted face-to-face by trained lay interviewers either using a computer assisted personal interview (CAPI) or a paper and pencil interview (PAPI). In most of the countries, except Iraq, Romania and Israel, each interview had two parts. All respondents completed Part 1, which contained core mental conditions, while all Part 1 respondents who met criteria for any core mental condition plus a random probability sub-sample of other Part 1 respondents were administered Part 2 (the latter assessing, in detail, correlates, service use, and conditions of secondary interest to the study). Data were weighted to adjust for differential probabilities of selection and to match population
distributions on socio-demographic and geographic data. An additional weight was used for the over sampling of respondents for the Part 2 sample.
Updated WHO guidelines for translation and back-translations focusing on conceptual equivalence were used for all study materials. Pretesting and independent experts’ evaluations indi-cated equivalent measures. Certified lay interviewers were used for data collection, since they tend to achieve highly reliable measures [32]. Standardized procedures for interviewer training were followed in all settings including a certification process and a close supervision of data quality. These procedures are described in more detail elsewhere [33]. Informed consent was obtained from all respondents. Procedures for obtaining informed consent and protecting human subjects were approved and monitored for compliance by the Institutional Review Boards of the organiza-tions coordinating the surveys in each country.
Chronic physical conditions
Physical conditions were assessed with a standard chronic conditions checklist that asked respondents if they had ever suffered from the given physical health condition, if they had the condition in the past 12 months and if they had received any treatment. Such checklists have been shown to provide more accurate and complete self-reports than as compared to open-ended questions. Methodological studies suggest a moderate to good concordance between such reports and medical records [34,35].
The ten conditions considered here are: arthritis, cancer, cardiovascular (heart attack, heart disease, hypertension, and stroke), chronic pain (chronic back or neck pain and other chronic pain), diabetes, frequent or severe headache or migraine, insomnia, neurological (multiple sclerosis, Parkinson’s, and epilepsy or seizures), digestive condition (stomach or intestine ulcer or irritable bowel condition), and respiratory (seasonal allergies like hay fever, asthma, or COPD or emphysema). For the symptom based conditions like arthritis, chronic pain and headache, heart attack or stroke respondents were asked to report whether they had experienced these conditions. For the remaining silent conditions the question was prefaced by the phrase ‘‘have you ever been told by a doctor or health professional that you had any of these conditions?’’The time frames varied across countries and chronic conditions: the western European countries assessed both lifetime and 12-month presence of each condition, while for the rest of the countries that used the CAPI version of the questionnaire some of the chronic conditions were only evaluated lifetime, but for problems that could have remitted, participants were asked if they still had the conditions in the past 12 months. Finally, the PAPI countries used a 12 month time frame for most symptom-based conditions and lifetime (LT) frame for the silent conditions. The 12 month time frame has been used whenever possible but, for some of the conditions inconsistent time frames were used across countries. Generally good agreement between self-report of medical diagnoses and physician or medical record confirmation of those diagnoses [32,33].
Mental conditions
hypomania, bipolar I, bipolar II), panic disorder (Panic disorder, agoraphobia without panic), specific phobia, social phobia, generalized anxiety condition, post-traumatic stress disorder, alcohol abuse with and without dependence, drug abuse with and without dependence.
Only conditions present in the past 12 months are considered in this report. Generally good concordance has been found between CIDI diagnoses of anxiety and depressive conditions and independent clinical assessment [36,37].
Perceived health
Overall perceived health was assessed using a visual analog scale (VAS) approach [17]. Respondents were asked to use a 0 to 100 scale where 0 represents the worst possible health a person can have and 100 represents perfect health to‘‘describe your own overall physical and mental health during the past 30 days’’ taking into consideration all the physical and mental conditions reviewed in the survey.
Disability
Disability was assessed with a modified version of the WHO Disability Assessment Schedule 2.0 (WHODAS) [38,39]. Ques-tions were asked about difficulties in: a) understanding and communication (cognition), b) moving and getting around (mobility), c) attending personal hygiene, dressing and eating, and living alone (self-care) and d) interacting with other people (getting along). In addition, a series of questions about activity limitations days replaced the WHODAS life activities domain questions. In these questions, respondents were asked the number of days out of the past 30 that they were totally unable to carry out their normal activities or work; that they had to cut down in the activities; that they had to reduce their quality; or that they needed to exert an extreme effort to carry out their activities, due to physical or mental health problems (role functioning). Respon-dents were also asked about the extent of embarrassment (stigma) and discrimination or unfair treatment (discrimination) they experienced due to their health condition and, finally, they were asked about the interference of their health condition on the day to day activities of their family members (family burden). Scores on each dimension were computed, ranging from 0 to 100, where 0 indicated no disability and 100 indicated complete disability.
Statistical analysis
We used SUDAAN V10.0 (RTI International, USA) to generate estimates of condition prevalence and descriptive statistics for the distributions of the continuous variables. We then used MPlus 6.0 (Muthe´n and Muthe´n, Los Angeles, CA) to conduct all multivariate analyses in parallel in the total sample and within three subsamples consisting of respondents low and lower-middle, upper-lower-middle, and high income countries.
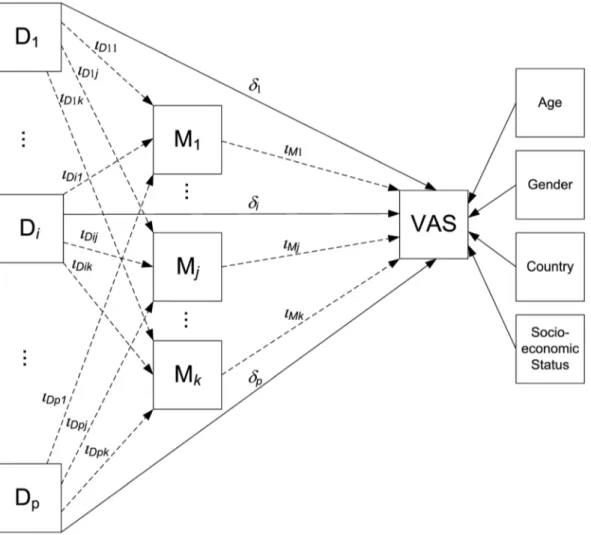
Path analysis was used to estimate, through simultaneous regression mediation submodels, the total, the direct, and the indirect (i.e., mediated by disability) effects of each condition in predicting VAS scores. The direct effect of each condition on perceived health VAS score is that part of its total effect which is not mediated via intervening variables. The indirect effects of each condition on VAS, via WHODAS domains, were generated as the product of regression coefficients (the regression coefficient of VAS score regressed on the WHODAS domain multiplied by the coefficient of the domain regressed on the condition). The submodels of the path analysis were embedded in a single general structural model as detailed inFigure 1(see figure legend). Note that in the general model the effects of each disorder on the mediator variables are controlled by the direct effect of the
remaining disorders (thus adjusting for comorbidity) and the VAS is adjusted by the total effects of all disorders as well as sociodemographic variables (age, gender, employment status and country). The final model took into account 19 disorders and 8 mediating dimensions. For purposes of comparing the relative magnitude of the direct and indirect effects across conditions, the total effect within condition (i.e. the sum of the direct effect plus all indirect effects) was rescaled to sum up 100%. To estimate model parameters, we used the maximum likelihood estimation method. To account for the complex sample design, standard errors and statistical tests were calculated using a sandwich estimator implemented in M-PLUS, which is equivalent to the Taylor series linearization method.
Results
A total of 51,344 respondents (Part 2 respondents) were assessed of which 16,051 were from low/lower-middle income, 10,496 from upper-middle income, and 24,797 from high income countries (Table 1). Individuals had an average of 42 years of age, varying from an average of 37 in low/lower-middle income to an average of 46 in the high income countries. Almost 52% were female and just above a third (35.7%) were not married. The proportion of individuals with completed high school varied from 47.2% in the low/lower-middle income to 71.8% in the high income countries. Overall, 41.6% of the sample was not working (41.9% in low/lower-middle income, 46.5% in upper-middle income and 39.3% in high income countries).
Physical chronic conditions were more prevalent than mental conditions, with 12 month prevalence ranging from a lowest of 30.1% (Shenzhen, China) to a highest of 71.3% in Ukraine and 70.1% in the United States. The prevalence of mental conditions ranged from a lowest of 6% in Beijing/Shanghai (China) to a highest of 27.3% in Sao Paulo metropolitan area (Brazil) and 24.5% in the United States. There was a trend towards higher prevalence of conditions among in higher income countries.
Chronic pain was the most common condition in low/lower-middle income (21.9%), in upper-low/lower-middle income (20.5%), and in high income (21.6%) countries. In the latter, cardiovascular conditions (19.3%) were also very common. Other common physical conditions in all countries were respiratory, cardiovascu-lar, arthritis and headache/migraine. The prevalence of any physical condition ranged from 56% in high income to 45.6% in low/lower-middle income countries. Any mental condition ranged from 15.7% (high income) to 12.1%, (low/lower middle income) (data not shown but available upon request).
Distribution of WHODAS scores
Table 2 shows the proportion of respondents with difficulties on each of the WHODAS dimensions for the overall sample and for each income country category. Over a third of respondents (35.7%) had some difficulty in the WHODAS (score.0), the frequency being considerably higher among respondents from high income countries (46.5%) than for those in other countries (22.2% and 28%). Role functioning dimension was the most frequently affected dimension (31.7%) in all income country categories (from 42% to 18.3%). Mobility and stigma showed the second most frequent difficulties (11.4% and 8.3%, respectively in the overall sample), while self-care was the least frequently affected (3.4%).
Table 2 also shows the mean scores in each WHODAS dimension and the global score. For the latter, mean scores were higher for high income countries (3.6) than for upper-middle and low and lower-middle income countries (2.3). But mean global Disability Mediates Health in Chronic Conditions
WHODAS scores across those with any difficulty tended to be higher for upper-middle income (10.1) and low/lower-middle income (8.2) than for high income countries (7.8).
Distribution of perceived health VAS score
As shown in more detail in a previous WMH report [17], the mean VAS score was 81.0 in the overall sample. Respondents with mental conditions showed lower mean perceived health (72.2) than those with physical conditions (75). As shown in Table 3, these trends are consistent across all country income groups.
Direct and indirect (disability mediated) effects of conditions on perceived health
Table 4 presents the association of mental conditions and chronic physical conditions with VAS score for the overall sample.
Total effects are highest for neurological conditions, with an average decrement of 9.8 points on the VAS, depression (8.2) and bipolar disorder (8.1). There is considerable variation across conditions in the extent to which total effects are mediated by WHODAS scores. The fourth column shows the proportion of overall indirect effects to total effects. Indirect effects tend to represent a lower proportion (among significant percentages in column 4, ranging from 19.4% to 84.0%, with a median of 36.8%, IQR = 31.2 to 51.5) of the total effect of the conditions on the VAS. Of notice some effects are non significant. These proportions can be visualized in Figure 2, where the total effect of each condition on the VAS is broken down into direct (shown in white) and indirect (in black) effects. In general, mental conditions tend to show higher proportions of indirect effects mediated by disability dimensions, with the highest values for PTSD (84.0%), GAD Figure 1. General mediation model used in analyses.The figure displays the general mediation model that has been used to estimate effects according to path-diagrammatic conventions. Squares represent variables.Diis one of thep = 19disorders under consideration,Mjis one of thek = 8
mediating variables (disability dimensions), and VAS is the final outcome. Arrows represent regression slope parameters from independent variables to outcomes. Thedparameters stand for the direct effect regression from disorders to the final outcome. Thei parameters indicate the two regression components of the disorder indirect effects as mediated byM: a)pxkregression parameters fromDtoM(iDij) and b) k regression parameters fromMto VAS (iMj). For each disorder the model can be decomposed in two paths: 1) VAS regressed on disorders, and 2) a causal mediation chain of VAS regressed on mediators which in turn are regressed on disorders. The partial indirect effect of a certain disorderDithrough a
mediatorMjisiDijxiMj, whereas its total indirect effect is the sum of thekproducts across mediators (Ii~P k
i~1
iDij|iMj). Total effects for a disorder are the sum of direct and total indirect effect (di+Ii). Directionality cannot be assumed as a causal association in our study due to its cross-sectional, observational nature. Also notice that in the general model, the effect of each disorder on each mediator is adjusted by the direct effect of the remaining disorders (thus controlling for comorbidity), while the impact of a disorder on VAS is controlled by the total effects of the other disorders. Disability is thus fully taken into account, even though it is decomposed in subscales. The effects on VAS are also controlled for age, gender, employment status and country.
Table 1.Sample Characteristics per country income level. The WMH Surveys.
Country N Females Not Married =.High School Not Working Age Any Mental Any Physical
Any Mental or Physical
% (SE) % (SE) % (SE) % (SE) Mean (SE) % (SE) % (SE) % (SE)
Low and Lower-middle income
Colombia 2381 54.5 (1.5) 43.4 (1.7) 46.4 (2.3) 46.4 (2) 36.6 (0.3) 18.7 (1) 42.7 (1.3) 50.4 (1.5)
India - Pondicherry 1373 50 (1.6) 30.2 (2.1) 47 (1.9) 52.1 (1.5) 38.1 (0.6) 19 (1) 40.7 (2) 47.2 (2.1)
Iraq 4332 49.7 (1) 34.4 (1.2) 35.3 (1.1) 59.2 (1.2) 36.9 (0.4) 10.9 (0.7) 44.5 (1.1) 47.8 (1)
Nigeria 2143 51 (1.5) 39.7 (1.6) 35.6 (1.3) 31.1 (1.4) 35.8 (0.4) 6.3 (0.6) 46.2 (1.6) 49.2 (1.6)
PRC –Beijing/Shanghai 1628 47.7 (1.8) 33.4 (1.7) 55 (1.6) 41.2 (2.2) 41.2 (0.6) 6 (0.8) 53 (1.8) 54.8 (1.8)
PRC – Shenzhen 2475 50.3 (1.6) 46.2 (1.3) 49.4 (1.5) 8.5 (0.6) 29.1 (0.3) 7.8 (0.7) 30.1 (1.2) 33.8 (1.2)
Ukraine 1719 55.1 (1.3) 34.9 (1.4) 81.9 (1.5) 45.6 (2.1) 46.1 (0.8) 20.4 (1.3) 71.3 (1.8) 75 (1.8)
Upper-Middle income
Brazil 2942 52.8 (1.5) 40.2 (1.6) 47.2 (1.3) 35.4 (1.1) 39.1 (0.5) 27.3 (0.8) 68.5 (2) 73.5 (1.7)
Bulgaria 2233 52.2 (1.3) 25.7 (1.6) 64.2 (1.3) 50.4 (1.9) 47.8 (0.6) 10.7 (0.6) 44.3 (1.3) 48.1 (1.4)
Lebanon 602 48.1 (2.6) 39 (3.2) 40.5 (2.8) 48.9 (2.4) 40.3 (0.9) 10 (1.5) 38.8 (2.1) 43.8 (2.5)
Mexico 2362 52.3 (1.9) 32.7 (1.5) 31.4 (1.7) 41.6 (1.6) 35.2 (0.3) 12.7 (0.8) 35 (1.8) 40.7 (1.8)
Romania 2357 52.4 (1.3) 30.4 (1.2) 49.3 (1.7) 60.7 (1.3) 45.5 (0.5) 7 (0.6) 48.1 (1.3) 50.6 (1.3)
High income
Belgium 1043 51.7 (2.4) 30.2 (1.7) 69.7 (3.7) 42.2 (1.4) 46.9 (0.7) 13.8 (1.7) 48.8 (2.2) 54.1 (2.4)
France 1436 52.2 (1.8) 29 (1.8) . (.) 37.9 (1.8) 46.3 (0.7) 18.5 (1.3) 52.7 (2.2) 59.5 (2.3)
Germany 1323 51.7 (1.4) 36.7 (1.7) 96.4 (0.9) 43.5 (2.1) 48.2 (0.8) 10.9 (1.3) 49.7 (2.4) 54.2 (2.4)
Israel 4859 51.9 (0.4) 32.2 (0.7) 78.3 (0.7) 39.8 (0.8) 44.4 (0.2) 10.7 (0.5) 55.5 (0.8) 58 (0.8)
Italy 1779 52 (1.5) 33.3 (1.6) 39.4 (1.8) 46.1 (1.7) 47.7 (0.6) 8.9 (0.7) 50 (1.8) 52.9 (1.7)
Japan 1682 53 (1.9) 31.2 (1.4) 71.6 (1.4) 36.5 (1.8) 51.2 (0.7) 7.6 (0.6) 52.8 (1.8) 55.6 (1.9)
Netherlands 1094 50.9 (2.2) 27.9 (2.6) 69.7 (1.8) 37.7 (2.6) 45 (0.8) 13.5 (1) 48.5 (2.3) 52.8 (2.2)
N.Ireland 1708 51 (1.4) 40.4 (1.8) 88.7 (1) 37.4 (1.9) 45.3 (0.6) 19.1 (1.5) 54.4 (1.9) 60.6 (1.8)
Portugal 2060 51.9 (1.5) 30.4 (1.4) 54.8 (1.7) 40.3 (1.5) 46.5 (0.7) 21.8 (0.9) 55.1 (1.6) 63.1 (1.6)
Spain 2121 51.4 (1.7) 34.7 (1.5) 41.7 (1.5) 49.6 (1.8) 45.6 (0.7) 9.9 (0.9) 42.8 (1.5) 47.1 (1.5)
United States 5692 53.1 (1) 44.1 (1.2) 83.2 (0.9) 33.2 (1.1) 45 (0.5) 24.5 (0.8) 70.1 (1) 75 (1)
All countries 51344 51.8 (0.3) 35.7 (0.3) 58.6 (0.4) 41.6 (0.3) 42.3 (0.1) 14.4 (0.2) 51.4 (0.4) 55.8 (0.4)
comparison among countries 1.2 (0.2) 13.8 (,0.0001) 165.6 (,0.0001) 63 (,0.0001) 187.9 (,0.0001) 59.8 (,0.0001) 38.6 (,0.0001) 40.4 (,0.0001)
High income 24797 52.1 (0.4) 35.4 (0.5) 71.8 (0.5) 39.3 (0.5) 46 (0.2) 15.7 (0.3) 56 (0.5) 60.5 (0.5)
Upper-Middle income 10496 52.1 (0.7) 33.3 (0.7) 47.2 (0.8) 46.5 (0.7) 41.5 (0.2) 14.8 (0.4) 49.3 (0.8) 53.6 (0.7)
Low and Lower-middle income 16051 51.1 (0.6) 37.9 (0.6) 47.2 (0.6) 41.9 (0.6) 37 (0.2) 12.1 (0.3) 45.6 (0.6) 49.8 (0.6)
comparison low, middle, high 1.2 (0.3) 12.6 (,0.0001) 582.2 (,0.0001) 36.9 (,0.0001) 633 (,0.0001) 31.4 (,0.0001) 85.5 (,0.0001) 89.6 (,0.0001)
doi:10.1371/journal.pone.0065858.t001
Disability
Mediates
Health
in
Chronic
Conditions
PLOS
ONE
|
www.ploson
e.org
6
June
2013
|
Volume
8
|
Issue
6
|
(63.7%), panic (53.1%), and bipolar disorder (47.0%). The chronic physical conditions with the highest proportions of total effects mediated by disability include cancer (78.9%), neurological conditions (57.6%), and insomnia (50.0%). Alcohol abuse and drug abuse are the only conditions considered here for which indirect effects through WHODAS scores are not statistically significant. Once adjusted by the remaining WHODAS
dimen-sions and disorders, the dimendimen-sions most often associated with significant mediating effects across the 19 conditions are role functions (89.5%), family burden (84.2%), stigma (79.0%), mobility (73.7%), cognition (68.4%), and self-care (42.1%).
Figure 3 shows the relative importance of each disability dimension (adjusted by the rest of dimensions and comorbidity) in the disorder indirect effects on VAS scores. Thus, the 100% is the
Table 2.Distribution of the WHODAS dimension scores by income level. The WMH Surveys.
Across non-zero % with non-zero
score (SE)
Mean across all
(SE) Mean (SE) p25 median p75
Overall sample
Cognition 6.9 (0.14) 0.8 (0.03) 12 (0.32) 1.7 5 15.6
Mobility 11.4 (0.19) 3.2 (0.07) 28.2 (0.48) 5 16.7 50
Self-care 3.4 (0.1) 1 (0.05) 28.3 (1.12) 5 16.1 50
Getting along 3.9 (0.11) 0.6 (0.03) 15.8 (0.54) 2.3 7.5 22.2
Role functioning 31.7 (0.3) 9 (0.14) 28.5 (0.36) 3.2 10.8 46.7
Family burden 8.1 (0.15) 3.7 (0.08) 45.2 (0.46) 25 50 50
Stigma 8.3 (0.16) 4 (0.08) 48.7 (0.44) 25 50 75
Discrimination 3.5 (0.1) 1.7 (0.05) 47.1 (0.69) 25 50 50
Global Whodas 35.7 (0.3) 2.9 (0.05) 8.2 (0.12) 0.6 2.5 10
High income countries
Cognition 7.9 (0.2) 1 (0.04) 12.5 (0.4) 1.7 5 16.7
Mobility 14.6 (0.3) 4.4 (0.13) 30.3 (0.64) 5 19.4 53.3
Self-care 4.1 (0.15) 1.3 (0.08) 30.3 (1.5) 5 16.7 50
Getting along 4.8 (0.17) 0.8 (0.04) 15.6 (0.59) 2.3 7.5 21.7
Role functioning 42 (0.43) 10.7 (0.21) 25.5 (0.45) 3.2 6.7 37.5
Family burden 8.7 (0.22) 3.9 (0.11) 45.2 (0.65) 25 50 50
Stigma 7.6 (0.19) 3.6 (0.1) 46.8 (0.68) 25 50 50
Discrimination 2.8 (0.11) 1.3 (0.06) 48.2 (1.05) 25 50 75
Global Whodas 46.5 (0.43) 3.6 (0.08) 7.8 (0.15) 0.6 1.7 10
Upper-middle income countries
Cognition 5.8 (0.3) 0.8 (0.06) 13.3 (0.79) 1.9 5 18.3
Mobility 7.8 (0.3) 2.2 (0.11) 28.8 (1.01) 5.6 16.7 50
Self-care 2.1 (0.17) 0.7 (0.06) 31.2 (2.39) 6.7 16.7 50
Getting along 2.2 (0.18) 0.5 (0.06) 22.8 (1.84) 4 15 36.7
Role functioning 18.3 (0.56) 7.1 (0.27) 38.8 (1.21) 8.3 25 60
Family burden 7.7 (0.27) 3.5 (0.14) 45.3 (0.9) 25 50 50
Stigma 9.1 (0.32) 4.8 (0.18) 52.3 (0.76) 25 50 75
Discrimination 4.3 (0.2) 2 (0.11) 47.3 (1.17) 25 50 75
Global Whodas 22.2 (0.58) 2.3 (0.09) 10.1 (0.35) 1.3 5 13.3
Low and lower-middle income countries
Cognition 6.1 (0.27) 0.6 (0.05) 10.4 (0.68) 1.5 4.4 12.5
Mobility 8.7 (0.29) 2 (0.09) 22.4 (0.86) 3.9 11.1 33.3
Self-care 3.2 (0.2) 0.7 (0.09) 22.9 (2.16) 3.3 10 32.5
Getting along 3.5 (0.2) 0.5 (0.05) 13.1 (1.16) 2 5.3 16.7
Role functioning 24.6 (0.46) 7.8 (0.23) 31.6 (0.69) 6.7 16.7 49.2
Family burden 7.4 (0.28) 3.3 (0.15) 45.2 (0.92) 25 50 50
Stigma 8.9 (0.35) 4.3 (0.18) 48.7 (0.82) 25 50 75
Discrimination 4.3 (0.23) 1.9 (0.11) 45.8 (1.26) 25 50 50
Global Whodas 28 (0.48) 2.3 (0.08) 8.2 (0.23) 1.3 3.5 10.3
Table 3.Perceived health visual analogue scale (VAS) scores by country income level.
All countries High Middle Low
Mean (SE) Q25 Median Q75 Mean
(SE) Q25 Median Q75
Mean
(SE) Q25 Median Q75
Mean
(SE) Q25 Median Q75
Overall sample
81 (0.1) 70 90 95 80.7 (0.2) 74.4 89.82 90 81 (0.3) 70 89.85 99.5 81.6 (0.2) 70 90 99.8
Any Mental condition
72.2 (0.3) 59.9 79.94 89.9 72.6 (0.4) 60 79.9 89.9 71.6 (0.7) 59.1 79.94 89.7 71.9 (0.7) 59.8 79.06 89.2
Any Physical condition
75 (0.2) 60 79.96 90 76 (0.2) 69.1 79.95 89.7 73.2 (0.5) 60 79.95 89.9 74.3 (0.4) 59.9 79.87 90
Any Mental or Physical condition
75.5 (0.2) 64.9 79.97 90 76.4 (0.2) 69.2 79.96 89.9 73.8 (0.5) 60 79.96 89.9 74.9 (0.4) 60 79.88 90
The WMH Surveys.
doi:10.1371/journal.pone.0065858.t003
Figure 2. Direct and indirect effects (via WHODAS dimensions) of common chronic conditions on perceived health VAS, overall sample.WMH Surveys.
doi:10.1371/journal.pone.0065858.g002
Disability Mediates Health in Chronic Conditions
Indirect effects via each WHODAS dimension1
Total effects of conditions on VAS
Direct effects of conditions
Indirect effects via WHODAS Scales
Percentage of indirect effects over total
effects Cognition Mobility Self-care Role functioning Family
burden Stigma
Coeff (SE) Coeff (SE) Coeff (SE) % (SE) Coeff (SE) Coeff (SE) Coeff (SE) Coeff (SE) Coeff (SE) Coeff (SE)
Alcohol Abuse 22.94 (0.8)* 23.03 (0.76)* 0.09 (0.25) 23.16 (8.83) 0 (0.02) 0.32 (0.06)* 0.03 (0.02) 20.11 (0.11) 20.04 (0.06) 20.1 (0.08)
Bipolar 28.09 (1.28)* 24.29 (1.01)* 23.8 (0.73)* 47.02 (7.38)* 20.48 (0.13)* 20.26 (0.16) 20.1 (0.08) 21.22 (0.24)* 20.86 (0.19)* 20.77 (0.2)*
Depression 28.17 (0.42)* 25.17 (0.4)* 23 (0.21)* 36.75 (2.6)* 20.27 (0.06)* 20.31 (0.07)* 20.05 (0.02)* 21.08 (0.1)* 20.54 (0.08)* 20.68 (0.09)*
Drug Abuse 23.71 (1.49)* 23.04 (1.37)* 20.67 (0.6) 17.98 (14.74) 20.09 (0.06) 0.13 (0.1) 0.03 (0.02) 20.32 (0.22) 20.28 (0.2) 20.09 (0.17)
Generalized Anxiety 25.25 (0.93)* 21.91 (0.75)* 23.34 (0.55)* 63.66 (9.77)* 20.28 (0.08)* 20.49 (0.15)* 20.06 (0.04) 21.07 (0.2)* 20.73 (0.16)* 20.66 (0.14)*
Panic Disorder 26.3 (0.86)* 22.96 (0.73)* 23.34 (0.45)* 53.06 (7.06)* 20.33 (0.09)* 20.39 (0.11)* 20.05 (0.03) 21.1 (0.17)* 20.61 (0.13)* 20.8 (0.14)*
Posttraumatic Stress 25.16 (0.91)* 20.83 (0.8) 24.33 (0.59)* 84 (13.49)* 20.43 (0.11)* 20.79 (0.16)* 20.1 (0.05) 21.49 (0.22)* 20.78 (0.16)* 20.69 (0.15)*
Social Phobia 23.07 (0.68)* 22.01 (0.62)* 21.06 (0.3)* 34.61 (9.81)* 20.18 (0.06)* 20.01 (0.07) 0.03 (0.02) 20.32 (0.1)* 20.27 (0.09)* 20.26 (0.09)*
Specific Phobia 22.26 (0.48)* 21.67 (0.43)* 20.59 (0.23)* 26.03 (8.92)* 20.03 (0.02) 0 (0.06) 0.01 (0.01) 20.22 (0.09)* 20.19 (0.06)* 20.15 (0.06)*
Headache/Migrane 24.83 (0.34)* 23.31 (0.31)* 21.52 (0.14)* 31.43 (2.91)* 20.12 (0.03)* 20.08 (0.04) 20.03 (0.01)* 20.54 (0.06)* 20.33 (0.05)* 20.39 (0.05)*
Insomnia 26.18 (0.52)* 23.09 (0.47)* 23.09 (0.25)* 49.99 (4.3)* 20.21 (0.06)* 20.64 (0.08)* 20.07 (0.03)* 21.03 (0.11)* 20.56 (0.08)* 20.52 (0.08)*
Neurological 29.82 (1.12)* 24.17 (0.93)* 25.65 (0.78)* 57.55 (6.82)* 20.37 (0.1)* 21.45 (0.29)* 20.24 (0.11)* 21.58 (0.26)* 20.84 (0.18)* 21.06 (0.21)*
Arthritis 25.47 (0.38)* 23.46 (0.34)* 22.01 (0.15)* 36.76 (2.77)* 20.04 (0.01)* 20.65 (0.07)* 20.05 (0.02)* 20.64 (0.07)* 20.24 (0.04)* 20.36 (0.05)*
Back/Neck Pain 26.56 (0.31)* 24.15 (0.28)* 22.41 (0.13)* 36.77 (1.93)* 20.07 (0.02)* 20.62 (0.06)* 20.04 (0.02)* 20.95 (0.07)* 20.32 (0.04)* 20.4 (0.05)*
Cancer 22.67 (0.86)* 20.56 (0.76) 22.11 (0.37)* 78.9 (22.6)* 20.08 (0.05) 20.64 (0.14)* 20.05 (0.03) 20.86 (0.15)* 20.34 (0.09)* 20.12 (0.08)
Cardiovascular 25.8 (0.35)* 23.59 (0.33)* 22.22 (0.15)* 38.17 (2.75)* 20.06 (0.02)* 20.65 (0.07)* 20.07 (0.03)* 20.69 (0.07)* 20.33 (0.05)* 20.39 (0.05)*
Diabetes 25.86 (0.65)* 23.81 (0.57)* 22.05 (0.27)* 35 (4.45)* 20.11 (0.03)* 20.59 (0.1)* 20.07 (0.03)* 20.81 (0.12)* 20.25 (0.06)* 20.21 (0.06)*
Digestive 24.06 (0.59)* 22.8 (0.52)* 21.26 (0.26)* 31.01 (5.79)* 20.01 (0.02) 20.22 (0.08)* 20.02 (0.01) 20.47 (0.11)* 20.24 (0.07)* 20.29 (0.07)*
Respiratory 21.49 (0.31)* 21.2 (0.27)* 20.29 (0.11)* 19.4 (6.72)* 20.02 (0.01) 20.1 (0.04)* 0 (0.01) 20.17 (0.05)* 20.02 (0.03) 0.01 (0.03)
Direct effects of scales Cognition:20.12 (0.03)* Mobility:20.16 (0.01)* Self-care:20.05 (0.02)* Getting along:20.01 (0.03)
Role functioning:20.12 (0.01)* Family burden:20.11 (0.01)* Stigma:20.11 (0.01)* Discrimination:20.02 (0.02)
WMH surveys. p-value,0.05.
1Only dimensions with statistically significant effect are included. Getting along and Discrimination not statistically significant.
doi:10.1371/journal.pone.0065858.t004
Disability
Mediates
Health
in
Chronic
Conditions
ONE
|
www.ploson
e.org
9
June
2013
|
Volume
8
|
Issue
6
|
overall indirect effect of each condition, and the sections correspond to the different disability dimensions. Only the conditions with significant overall indirect effects are considered. It can be observed that role functioning is the most important mediator for all of the conditions with the exception of arthritis. The contribution of role functioning to the overall indirect effects ranges from 29% to 57%, and tends to be a bit more important among physical (median 36.5%, IQR = 32.4 to 39.3) than among mental conditions (median 32.9%, IQR = 32.0 to 35.2).
The differential disability mediation pattern for physical and mental conditions is evident for mobility, with a median of 27.2% of indirect effects for physical conditions versus 10.3% for mental. Conversely, stigma and family burden tend to be more important mediators of perceived health for mental conditions (medians for stigma are 22.7% for mental and 17.2% for physical, and for family burden, 21.7% and 15.0%, respectively). Cognition and self care have a low contribution to the indirect effects (median across all conditions 6.6% and 1.85%, respectively).
Tables S1, S2, and S3 are equivalent to Table 4 but restricting the sample to each of the three income country level groups. While all the total effects are statistically significant in the whole sample, not all of them are significant at the income country level. Posttraumatic stress has the highest proportion of indirect over
total effects across mental conditions in the three groups. Neurological has the highest proportion for low/lower-middle and upper-middle income countries across physical conditions, while the corresponding one for high income countries is cancer. The contributions of overall indirect to total effects among the nineteen conditions are shown in column 4 of each table of supporting information. These contributions range (among significant proportions): for high income countries, from 33.5% to 90.6%, with a median of 42.6% (IQR = 35.2–54.5); for upper-middle income countries, from 16.7% to 61.1%, median 33.2% (IQR = 26.5–48.6), and for low/lower-middle income countries, from 20.5% to 122.6%, median 38.7%, (IQR = 25.8–45.9). Hence, high income countries show the highest indirect, disability meditated, contribution.
Income country level information corresponding to Figure 2 (the proportion of indirect specific over the overall indirect effect) indicate that in all income groups, mobility has a higher contribution in physical conditions, and the indirect effects of family burden and stigma are higher among mental conditions. While role functioning is also the most important dimension for high and low/lower-middle income countries (median percentages and IQRs are 36.2 (32.9–40.8) and 35.9 (30.0–39.0), respectively),
Figure 3. Relative WHODAS dimension contributions to the indirect effect of disability on perceived health VAS for each condition, overall sample.WMH Surveys (Alcohol Abuse and Drug Abuse are not represented because their respective overall indirect effect is not significant). doi:10.1371/journal.pone.0065858.g003
Disability Mediates Health in Chronic Conditions
for middle-income countries it is stigma: median percentage 38.8, IQR = (31.4–45.1). (Data not shown but available on request.)
Discussion
In this international study, we found that over a third (median of 36.8% with an IQR of 31.2% to 51.5%) of the total decrement in perceived health associated with common conditions is mediated by the disabilities assessed in the WHODAS. The magnitude of this mediated effect is exactly the same for mental disorders and for physical conditions. We also found that role functioning is the predominant dimension which indirectly accounts for the associ-ation of all the conditions with perceived health. While mobility is the second most important mediator in the case of chronic physical conditions, for mental conditions stigma and family burden are more important mediators. These results are not only statistically significant, but substantially relevant given the size and the consistency of the associations found. Taken together, these results confirm our a priori hypotheses suggesting that disability dimensions mediate the decrease of perceived health associated to chronic conditions and that the mediating dimensions are different for mental and physical conditions. Of notice these results are very similar across the three levels of country income. The fact that more than one third of perceived health decrements associated with common conditions is attributable to disability dimensions should call attention of the potential interest of assessing disability as well as to try to improve it, to ameliorate the health status of individuals with chronic conditions. That would require a systematic evaluation of disability dimensions in order to identify potential beneficial interventions.
To our knowledge, the mediating role of disability on perceived health has never been reported for samples of the general population representing so many countries worldwide for the large range of conditions and disability dimensions assessed here. Nevertheless, many studies have previously shown an association between particular dimensions of disability and perceived health, in samples of patients with particular diseases. For instance, social functioning is an important determinant of perceived health among heart failure patients [40] while physical ability has an important role on perceived health among spinal cord injury patients [41]. And for individuals with major depressive episode, cognition and embarrassment seem to be more relevant disability dimensions [30]. Our results represent a first systematic attempt to disentangle the association between a range of chronic conditions and perceived health considering a comprehensive range of disability indicators. And they indicate that, on average, the disability mediated effect on perceived health is substantial and similar for the 9 mental conditions and the 10 physical conditions analyzed. Nevertheless, the type of disability dimension which mediates such effect tends to be different for physical and for mental conditions. Moreover, there is variation across individual disorders in the extent to which their impact on perceived health is mediated by disability dimensions. More research is needed for further understanding the underlying process of perceived health and disability evaluations and how they may differ by different levels of health.
Mobility disability is a frequent mediator of the effect of chronic physical conditions on perceived health (median value of 10.2% of the total effect), while this dimension is much less important for mental conditions (3.2%). Many of the physical conditions considered in our study imply either pain (arthritis, back-neck pain) or impairment on the extremities and their functional performance (neurological conditions, cardiovascular, respiratory), or general weakness (cancer and others). All of which have an
impact on the mobility function and modify the perception of health of the individual [13,17][42]. On the other hand, this disability dimension is not a very relevant mediator of the impact of mental conditions on perceived health, while family burden and stigma are. The empirical direct and indirect associations described here provide a textured picture of the ways health conditions impact on health perceptions and the role of functioning and disability. This might be important beyond description and might help guiding therapeutic efforts towards particular disabilities. For instance, in a descriptive study of breast cancer survivors it was estimated that potential interventions including physical mobility could prevent decreases in self-rated health among breast cancer survivors [43]. Also, the use of specific clinical problem-solving tools for physical and rehabilitation medicine could be liaised with assessments of perceived health [44]. Consistent with previous work [30], our data suggest that assessing stigma and family burden and trying to combat them can limit the decrements in perceived health of individuals with mental conditions. The type of relationships described here for the general adult population suggests that a systematic assessment of disability might help identifying areas of needed improvement for individ-uals with chronic conditions. Our results also suggest that effectively addressing disability should have a noticeable positive impact on the overall perception of health of the general population.
One remarkable finding of this study is the consistency of results across income country levels. We did find differences in the prevalence of disability: individuals in high income countries were twice as much likely to endorse any WHODAS disability than those in upper-middle or low and lower-middle income countries. These differences are consistent with previous reports in the literature indicating that cultural and work-related issues as well as differential access to health and social services could cause higher rates of disability in developed countries [45,46]. In contrast, perceived health levels were very similar across countries (see Table 3), both in the general population and among individuals with chronic conditions. The proportion of perceived health accounted by disability is very consistent across income country levels, both for the overall WHODAS and for that of the specific dimensions. Only marginal departures were found in low and lower-middle income countries, with a higher frequency of non statistical significant associations, due in part to a smaller sample size. This substantial homogeneity across countries does not mean, on the other hand, that local culture can be ignored. The need to take into account ethnic, cultural, and social dimensions in combating disability [47–49] is well-established.
referred to the 30 days preceding the interview. Due to different time frames it is not possible to definitively relate either the health status nor the disability reported by the respondents to their underlying mental of physical health condition for the preceding 12 months. Nevertheless, because both, the VAS and the WHODAS use the same recall period, any such bias should not influence our analyses of the intermediating role of disability in the impact of conditions on perceived health. Similarly, we were not able to assess the duration of the disability. It has been suggested that age at disability onset may impact self-reported general health and should be considered when analyzing HRQOL differences within people with disabilities [51]. Finally, an important consideration is the difficulty to differentiate the nature of conditions, symptoms, function and perceptions, as well as the need to refine the mediating and/or moderating nature of the described associations [52].
Implications
Our results, which are basically descriptive, call attention on the need to assess and consider disability to better understand how perceived health is influenced by common mental and physical conditions. More than a third of the decrements in perceived health are mediated by disability dimensions and would not be a direct effect of these conditions. This should call attention to the importance of addressing disability to increase health status among individual with common conditions. While disability can be more or less obviously related with the index condition, a systematic evaluation of disability could be beneficial. While role limitation and mobility are the disability most frequently mediating the effect of chronic physical conditions, stigma is an important mediator dimension for mental disorders. Measuring stigma among individuals with mental disorders should improve understanding of their perceived health reports. If the association of mental disorders and stigma is causal, combating stigma effectively could translate in gains in perceived health of individuals with mental disorders. Taken together, the findings described here suggest that there is need to learn more about the strength and ways of indirect association between chronic conditions and perceived health. In particular, evaluating whether interventions addressed to improve specific disabilities may improve perceived health of individuals with common chronic conditions beyond benefits that would be obtained with the usual treatment for these conditions.
Supporting Information
Table S1 Effects (direct and indirect via WHODAS) of
conditions on perceived health VAS. WMH high income countries.* p-value,0.05.1Only dimensions with statistically significant effect are included. Getting along and Discrimination not statistically significant.
(DOC)
Table S2 Effects (direct and indirect via WHODAS) of
conditions on perceived health VAS. WMH surveys middle income countries.* p-value,0.05,1Only dimensions with statistically significant effect are included. Cognition, Self-care, Getting along and Discrimination not statistically significant. (DOC)
Table S3 Effects (direct and indirect via WHODAS) of
conditions on perceived health VAS. WMH surveys low income countries. * p-value,0.05, 1 Only dimensions with statistically significant effect are included. Self-care, Getting along and Discrimination not statistically significant.
(DOC)
Acknowledgments
We gratefully acknowledge Dr. Carlos Garcı´a-Forero for his invaluable comments on statistical analysis modeling and for producing Figure 1. We thank the staff of the WMH Data Collection and Data Analysis Coordination Centres for assistance with instrumentation, fieldwork, and consultation on data analysis. We also thank Ms. Raquel Go´mez and Carme Gasull for their help in the preparation of the manuscript. A complete list of all within-country and cross-national WMH publications can be found at http://www.hcp.med.harvard.edu/wmh/.
Author Contributions
Conceived and designed the experiments: JA SC RCK. Analyzed the data: JA GV ND SC EB RB JH RCK. Acquisition of data: JA GV YH LHA EB RB JF SF GG OG JMH HH CH NI SL DL JPL HM MEM SO JH JAP NI MX RCK. Drafting the article: JA GV ND SC YH LHA EB RB JF SF GG OG JMH HH CH NI SL DL JPL HM MEM SO JH JAP NI MX RCK. Final approval: JA GV ND SC YH LHA EB RB JF SF GG OG JMH HH CH NI SL DL JPL HM MEM SO JH JAP NI MX RCK.
References
1. Rohrer JE, Young R, Sicola V, Houston M (2007) Overall self-rated health: a new quality indicator for primary care. J Eval Clin Pract 13: 150–153. 2. Perruccio AV, Power JD, Badley EM (2007) The relative impact of 13 chronic
conditions across three different outcomes. J Epidemiol Community Health 61: 1056–1061.
3. Heistaro S, Vartiainen E, Puska P (1996) Trends in self-rated health in Finland 1972–1992. Prev Med 25: 625–632.
4. Alonso J (2000) [The measurement of health related-quality of life in clinical research and practice]. Gac Sanit 14: 163–167.
5. Sen A (2002) Health: perception versus observation. BMJ 324: 860–861. 6. Salomon JA, Tandon A, Murray CJ (2004) Comparability of self rated health:
cross sectional multi-country survey using anchoring vignettes. BMJ 328: 258– 263.
7. Idler EL, Benyamini Y (1997) Self-rated health and mortality: a review of twenty-seven community studies. J Health Soc Behav 38: 21–37.
8. DeSalvo KB, Fan VS, McDonell MB, Fihn SD (2005) Predicting mortality and healthcare utilization with a single question. Health Serv Res 40: 1234–1246. 9. Lee Y, Shinkai S (2003) A comparison of correlates of self-rated health and
functional disability of older persons in the Far East: Japan and Korea. Arch Gerontol Geriatr 37: 63–76.
10. Ashburner JM, Cauley JA, Cawthon P, Ensrud KE, Hochberg MC, et al (2011) Self-ratings of health and change in walking speed over 2 years: results from the caregiver-study of osteoporotic fractures. Am J Epidemiol 173: 882–889. 11. Saarni SI, Harkanen T, Sintonen H, Suvisaari J, Koskinen S, et al (2006) The
impact of 29 chronic conditions on health-related quality of life: a general
population survey in Finland using 15D and EQ-5D. Qual Life Res 15: 1403– 1414.
12. Schultz SE, Kopec JA (2003) Impact of chronic conditions. Health Rep 14: 41– 53.
13. Alonso J, Ferrer M, Gandek B, Ware JE, Aaronson NK, et al (2004) Health-related quality of life associated with chronic conditions in eight countries. Results from the International Quality of Life Assessment (IQOLA) project. Qual Life Res 13: 283–298.
14. Damian J, Pastor-Barriuso R, Valderrama-Gama E (2008) Factors associated with self-rated health in older people living in institutions. BMC Geriatr 8: 5–10. 15. Leinonen R, Heikkinen E, Jylha M (2001) Predictors of decline in self-assessments of health among older people–a 5-year longitudinal study. Soc Sci Med 52: 1329–1341.
16. van Dijk A, McGrath PA, Pickett W, Van Den Kerkhof EG (2008) Pain and self-reported health in Canadian children. Pain Res Manag 13: 407–411. 17. Alonso J, Vilagut G, Chatterji S, Heeringa S, Schoenbaum M, et al (2011)
Including information about co-morbidity in estimates of disease burden: results from the World Health Organization World Mental Health Surveys. Psychol Med 41: 873–886.
18. Ormel J, Kempen GI, Deeg DJ, Brilman EI, van Sonderen E, et al (1998) Functioning, well-being, and health perception in late middle- aged and older people: comparing the effects of depressive symptoms and chronic medical conditions. J Am Geriatr Soc 46: 39–48.
19. Guyatt GH, Feeny DH, Patrick DL (1993) Measuring health-related quality of life. Ann Intern Med 118: 622–629.
Disability Mediates Health in Chronic Conditions
20. Wilson IB, Cleary PD (1995) Linking clinical variables with health-related quality of life. A conceptual model of patient outcomes. JAMA 273: 59–65. 21. Valderas JM, Alonso J (2008) Patient reported outcome measures: a
model-based classification system for research and clinical practice. Qual Life Res 17: 1125–1135.
22. Baron RM, Kenny DA (1986) The moderator-mediator variable distinction in social psycological research: conceptual, strategic, and statistical considerations. J Pers Soc Psychol 51: 1173–1182.
23. Pearl J (2012) The causal mediation formula–a guide to the assessment of pathways and mechanisms. Prev Sci 13: 426–436.
24. Lee HY, Jang SN, Lee S, Cho SI, Park EO (2008) The relationship between social participation and self-rated health by sex and age: a cross-sectional survey. Int J Nurs Stud 45: 1042–1054.
25. Mavaddat N, Kinmonth AL, Sanderson S, Surtees P, Bingham S, et al (2011) What determines Self-Rated Health (SRH)? A cross-sectional study of SF-36 health domains in the EPIC-Norfolk cohort. J Epidemiol Community Health 65: 800–806.
26. Ormel J, Petukhova M, Chatterji S, Aguilar-Gaxiola S, Alonso J, et al (2008) Disability and treatment of specific mental and physical disorders across the world. Br J Psychiatry 192: 368–375.
27. Blain H, Carriere I, Sourial N, Berard C, Favier F, et al (2010) Balance and walking speed predict subsequent 8-year mortality independently of current and intermediate events in well-functioning women aged 75 years and older. J Nutr Health Aging 14: 595–600.
28. Boot CR, Koppes LL, van den Bossche SN, Anema JR, van der Beek AJ (2011) Relation between perceived health and sick leave in employees with a chronic illness. J Occup Rehabil 21: 211–219.
29. Ormel J, Kempen GI, Penninx BW, Brilman EI, Beekman AT, et al (1997) Chronic medical conditions and mental health in older people: disability and psychosocial resources mediate specific mental health effects. Psychol Med 27: 1065–1077.
30. Buist-Bouwman MA, Ormel J, de Graaf R, de Jonge P, van Sonderen E, et al (2008) Mediators of the association between depression and role functioning. Acta Psychiatr Scand 118: 451–458.
31. Kessler RC, Ustun TB (2008) The WHO World Mental Health Surveys: Global Perspectives on the Epidemiology of Mental Disorders. New York: Cambridge University Press.
32. Fowler F, Mangione T (1990) Standardized Survey Interviewing: Minimizing Interviewer-Related Error. Newbury Park, CA: Safe Publications, Inc. 33. Pennell BE, Mneimneh ZN, Bowers A, Chardoul S, Wells JE, et al. (2008)
Implementation of the World Mental Health Surveys. Chapter 3. Part I. Methods. In: Kessler RCUTB, editors. The WHO World Mental Health Surveys: global Perspectives on the Epidemiology of Mental Disorders. New York: Cambridge University Press. pp.33–57.
34. Kriegsman DM, Penninx BW, van Eijk JT, Boeke AJ, Deeg DJ (1996) Self-reports and general practitioner information on the presence of chronic diseases in community dwelling elderly. A study on the accuracy of patients’ self-reports and on determinants of inaccuracy. J Clin Epidemiol 49: 1407–1417. 35. Baumeister H, Kriston L, Bengel J, Harter M (2010) High agreement of
self-report and physician-diagnosed somatic conditions yields limited bias in examining mental-physical comorbidity. J Clin Epidemiol 63: 558–565.
36. Wittchen HU (1994) Reliability and validity studies of the WHO–Composite International Diagnostic Interview (CIDI): a critical review. J Psychiatr Res 28: 57–84.
37. Haro JM, Arbabzadeh-Bouchez S, Brugha TS, de Girolamo G, Guyer ME, et al (2006) Concordance of the Composite International Diagnostic Interview Version 3.0 (CIDI 3.0) with standardized clinical assessments in the WHO World Mental Health surveys. Int J Methods Psychiatr Res 15: 167–180. 38. Ustun TB, Kostanjsek N, Chatterji S, Rehm J (2010) Measuring health and
disability: manual for WHO Disability Assessment Schedule (WHODAS 2.0). Generva: World Health Organization.
39. Von Korff M, Crane PK, Alonso J, Vilagut G, Angermeyer MC, et al (2008) Modified WHODAS-II provides valid measure of global disability but filter items increased skewness. J Clin Epidemiol 61: 1132–1143.
40. Carlson B, Pozehl B, Hertzog M, Zimmerman L, Riegel B (2012) Predictors of Overall Perceived Health in Patients With Heart Failure. J Cardiovasc Nurs. In press.
41. Machacova K, Lysack C, Neufeld S (2011) Self-rated health among persons with spinal cord injury: what is the role of physical ability? J Spinal Cord Med 34: 265–272.
42. Garin O, Ayuso-Mateos JL, Almansa J, Nieto M, Chatterji S, et al (2010) Validation of the World Health Organization Disability Assessment Schedule (WHODAS-2) in patients with chronic diseases. Health Qual Life Outcomes 8: 51.
43. Schootman M, Deshpande AD, Pruitt S, Aft R, Jeffe DB (2012) Estimated effects of potential interventions to prevent decreases in self-rated health among breast cancer survivors. Ann Epidemiol 22: 79–86.
44. Steiner WA, Ryser L, Huber E, Uebelhart D, Aeschlimann A, et al (2002) Use of the ICF model as a clinical problem-solving tool in physical therapy and rehabilitation medicine. Phys Ther 82: 1098–1107.
45. Madan I, Reading I, Palmer KT, Coggon D (2008) Cultural differences in musculoskeletal symptoms and disability. Int J Epidemiol 37: 1181–1189. 46. Sokka T, Kautiainen H, Pincus T, Verstappen SM, Aggarwal A, et al (2010)
Work disability remains a major problem in rheumatoid arthritis in the 2000s: data from 32 countries in the QUEST-RA study. Arthritis Res Ther 12: R42. 47. Imrie R (1997) Rethinking the relationships between disability, rehabilitation,
and society. Disabil Rehabil 19: 263–271.
48. Lefley HP (1990) Culture and chronic mental illness. Hosp Community Psychiatry 41: 277–286.
49. Coggon D, Ntani G, Palmer KT, Felli VE, Harari R, et al (2012) The CUPID (Cultural and Psychosocial Influences on Disability) study: methods of data collection and characteristics of study sample. PloS One 7: e39820. 50. Murray CJ, Lopez AD (1996) Evidence-based health policy. Lessons from the
Global Burden of Disease Study (see comments). Science 274: 740–743. 51. Jamoom EW, Horner-Johnson W, Suzuki R, Andresen EM, Campbell VA
(2008) Age at disability onset and self-reported health status. BMC Public Health 8: 10–16.