Abstract—This paper presents an innovative approach for indicating stock market decisions that the investor should take for minimizing the risk involved in making investments. The system uses Adaptive Neuro-Fuzzy Inference System (ANFIS) for taking decisions based on the values of technical indicators. Among the various technical indicators available, the system uses weighted moving averages, divergence and RSI (Relative Strength Index). Detailed method and the rules defining the ANFIS architecture (which were developed using empirical examinations) are provided.
Index Terms— Hybrid methods, neuro-fuzzy inference system, moving averages, relative strength index (RSI)
I. INTRODUCTION
Prediction of stock market returns is an important issue in finance. However, information regarding a stock is normally incomplete, uncertain and vague, making it a challenge to predict the future economic performance. Accurate predictions of stock markets are important for many reasons. Chief among these is the need for investors to hedge against potential market risks and the opportunities for speculators and arbitrators to make profits by trading indexes. Reliability of traditional analysis methods strongly relying on experience is somewhat being doubted due to the complexity of the mode of stock exchange and the correlated information [1]. Techniques such as Regression models and ARIMA models [2] are also used for stock price forecasting. These models and methods have been used extensively in past. However they failed to give accurate results for some series because of their linear structures and some other limitations. Artificial neural networks (ANN) have been used in stock market prediction during the last decade. Recent research in the area of neural networks has shown that neural networks possess the properties required for relevant applications such as non-linear and smooth interpolations, ability to learn complex non linear mappings and self-adaptation for different statistical distributions. ANN is applied to Tokyo Stock exchange to predict buying and selling signals [2-3]. In Samarth Agrawal is working with KEC International Ltd. Almaty, Republic of Kazakhstan .He was a Bachelor student at Electrical Engineering Department ,Indian Institute of Technology, Roorkee, India (Phone :+77017897741; e-mail: samarthiitr@ gmail.com).
Manoj Jindal is working with Futures First, Hyderabad, India. He was a Bachelor student at Electrical Engineering Department, Indian Institute of Technology, Roorkee, India (Phone: +91-9703630121, e-mail:manoj.iitr@gmail.com).
G. N. Pillai is working as an associate professor in Department of Electrical Engineering, Indian Institute of Technology, Roorkee, India. (e-mail: gnathfee@iitr.ernet.in).
[4] it is concluded that the use of momentum and start of learning at random points may solve the problems that may occur in training process. In [5] neural network with genetic algorithm is applied to the stock exchange market of Singapore and predicted the market direction with an accuracy of 81%.
However the neural networks can’t be used to explain the casual relationships between input and output variables. This is because of the essentially black box like nature of many existing neural network architectures. The fuzzy approach has been applied to different forecasting problems whereby the operator’s expert knowledge is used for prediction [7]. The fuzzy logic forecasting shows promising results but its construction is subjective and somewhat depends on heuristic processes. The choices of member ship functions and rule base have to be developed heuristically for each scenario. The rules developed in this way may not always yield best results. The choice of membership function and its nature depends on trial and error. With these advantages of neural networks and fuzzy logic in mind, the system presented utilizes ANFIS architecture [8] for predicting the momentum in the market.
There are a variety of techniques to predict whether a particular area of investment would be profitable in the future. In this paper, momentum trading, a type of Technical Analysis is used for prediction. Unlike currently used approaches where only one parameter is monitored we plan to develop a system that can combine the information from a variety of different parameters to predict the future steps to be taken. The system was developed and tested for stocks of companies across various sectors of economy like FMCG, Automobiles, IT, Oil.
The organization of the rest of the paper is as follows. Section II describes the procedure for feature extraction. Section III gives an overview of the neural architecture used in the proposed approach. This is followed by the experimental results in Section IV and conclusions in Section V.
II. TECHNICAL ANALYSIS FOR STOCK PREDICTION Financial securities are generally evaluated or observed by two methods. One is known as Fundamental analysis .The other is known as Technical Analysis. Fundamental analysis is studying the company physically in terms of its product sales, man power quality, infrastructure etc. to understand it standing in the market and thereby its profitability as an investment. Technical analysis on the contrary doesn’t study the physical nature of the company .It rather evaluates the securities based on their trends and movement in the market.
Momentum Analysis based Stock Market
Prediction using Adaptive Neuro-Fuzzy
Inference System (ANFIS)
It assumes that the market movement of stock prices or securities is a reflection of the company’s fundamental components.
Therefore to understand the company and its profitability through its stock prices in the market, some parameters need to be evaluated that can guide an investor for making a judicious decision. These parameters are called Indicators and Oscillators. For e.g. RSI, Moving Averages, MFI, MACD etc.
When using Technical analysis for prediction of stock values, few assumptions are made:
• It is assumed that market moves in trends.
• History repeats itself i.e. under similar kinds of inputs the stock values behave in similar manner. • Prices have tendency to go with the trend rather than
against it.
To define the movement of the prices of the stocks we need to understand the concepts of momentum of stocks and the trends that follow. Momentum, as the name suggests, reflects the amount of change experienced by the stock price over the previous period.
ago days N today
close
close
momentum
=
−
(1)Trend however reflects the kind of movement patterns that are observed in the values under similar market conditions. Without the knowledge of these factors predicting the future stock values is very difficult. Broadly speaking there are ‘uptrends’ (when the prices are going up) and down trends (when the prices are going down).
A. Selection of Parameters
In technical analysis of stock market data 52 different parameters, indicators and oscillators have been defined. Even though each indicator provides some additional information about the stock, using each one of them will make the system complex and slow. This would require at least 2^52 rules for the ANFIS structure.
Hence there is a need to identify the parameters (feature vectors of the financial data) that most closely predict the nature of the movement without increasing the system complexity. Based on empirical observations and understanding the extent of information conveyed by an indicator, we zeroed in on Divergence, Weighted Moving Average and RSI (Relative Strength indicator) .These parameters help identify the direction and the extent of movement of prices of stock and thus help predict the decision that should be taken.
Fig. 1: Observing stock movement using Moving Averages
Moving average gives an idea of how the prices are moving in general over an extended period of time. Hence, Moving average gives us an idea of the trends prevailing. Comparing the Moving averages over two periods say 15 days and 50 days as per Fig. 1, gives us an idea of how the momentum is changing. A deeper look at the scenario reflects that the point where the 15 day Moving Average crosses the 50 day Moving Average in an upward direction(Cross over), is actually the point where the stock becomes favorable as it is showing a tendency of rise in price in the future. Similarly, the point where the 15 day Moving Average crosses the 50 day Moving Average in the downward direction (Support), is the point where the stock loses its attractiveness as it is showing signs of decline.
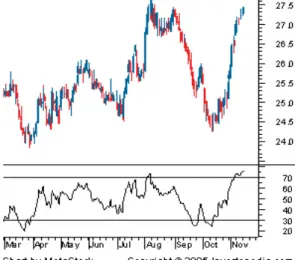
The relative strength index (RSI) is another one of the most used and well-known momentum indicators in technical analysis. RSI helps to signal overbought and oversold conditions in a security. The indicator is plotted in a range between zero and 100. A reading above 70 is used to suggest that a security is overbought, while a reading below 30 is used to suggest that it is oversold.
RSI =100 – (100/ (1+RS)) (2) Where RS =Average of 14 days increments/Average of 14 days decrements.
This indicator helps traders to identify whether a security’s price has been unreasonably pushed to current levels and whether a reversal may be on the way. Fig. 2 depicts the way RSI can help understand the movement of the stock. The standard calculation for RSI uses 14 trading days as the basis, which can be adjusted to meet the needs of the situation. If the trading period is adjusted to use fewer days, the RSI will be more volatile and will be used for shorter term trades.
B. Calculations in MATLAB
After selecting the technical indicators (feature vectors) that will provide the information about the momentum of the stock, the next step is to calculate their values for the given test sample.
In addition to calculation of values of Moving average and RSI, we also need some complimentary values that help create more realistic Fuzzy logic. Firstly, the percentage change in the price of a stock from one data point to next is required to understand the quantum of change occurring. Secondly, it is imperative to know at all points the relative position of the current price of the stock and the prevailing Moving Average value. This value is the Divergence feature vector that shall be used in implementing the fuzzy decision rules.
The technical computing framework of MATLAB is utilized for programming and development of the system. The setup in MATLAB calculates the parameter values using the specific functions available to define them. First of all, linearly weighted moving average corresponding to each point of data set is evaluated on a 5 week period. Also RSI is calculated for 14 day period. Next, to study the trend, percentage change in moving average and percentage change in prices of stocks in calculated. Next we calculate the value of Divergence.
These four inputs to the ANFIS structure help predict the short term decision that should be taken regarding that stock.
RSI = 100 – (100/ (1+RS)) (2) Where RS =Average of 14 days increments/Average of 14 days decrements.
% Price Change = (P(t) – P(t‐2))/P(t‐2) (3)
Where P (t) refers to the price of the stock today and P (t-2) refers to the price of the stock two periods ago.
%MAV Change = (MAV(t)‐MAV(t‐2))/MAV(t‐2) (4)
where MAV(t ) refers to the 5 week Moving Average of the stock today and MAV(t-2) refers to the 5 week Moving average of the stock two periods ago.
To verify divergence a Boolean input is needed to indicate whether price is more than moving average that instant or not. These four parameters calculated based on value of stock and the technical indicators indicate the trend and momentum.
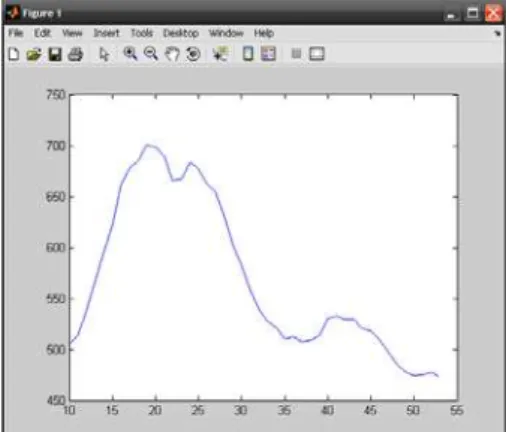
Fig. 3: Moving Average variation for Google stock
Fig. 4: RSI variation for Google stock
C. Development of Rule base and Membership functions
Any fuzzy system works using the rules defined by the expert who knows about the background fundamentals and working mechanism of the system. The system needs a set of rules corresponding to the various combinations of inputs that define a real world situation and must know how to behave in each case.
First, observe a particular input (condition in the market) and see how the market behaved after that .Then try to find the same situation again on the data set and see how the behavior is now. If the behavior is same then there is a relation between the inputs that can be used to generalize the situation. However if the behavior is different under same kind of inputs at different times then it means that either the feature vector is incapable of predicting at this stage or maybe the system itself is behaving randomly and not following trends.
For e.g. Empirical observations into stock prices and the parameters calculated indicated that if the price change is negative and the moving average change is positive and below price, in addition to high RSI then the market goes downward almost each time. Thus, it helped to generate the corresponding rule to “SELL” the share when this condition arises. Set of statements below give an idea about the rules that were implemented:
If (mov_avg_chg is Neg) and (price_chg is Pos)and (pr_mav_diff is Down)and (rsi is Low)then(output1 is Buy)
If (mov_avg_chg is Neg) and (price_chg is Pos)and (pr_mav_diff is Down)and (rsi is high)then(output1 is Buy)
If (mov_avg_chg is Pos) and (price_chg is Neg)and (pr_mav_diff is Up)and (rsi is High)then(output1 is Sell)
x
Σ
xN
N
Layer1
Layer2 Layer3 Layer4
Layer5 x
y
x y x
y
f 1
w
2
w 1
w
2 w
1 1f w
2 2f
w
Knowledge base
Inference
Fuzzifi-cation
Defuzzifi-cation
Input Ouput
Fig. 5: MATLAB ANFIS Model
immediately after 0.Until the price change is about 5 percent we can’t say for sure that the prices are seeing an uptrend. So there is an overlap of “Positive” and “Negative” membership functions.
Triangular and trapezoidal membership functions were used. The MATLAB model of the ANFIS system implemented is shown in Fig. 5
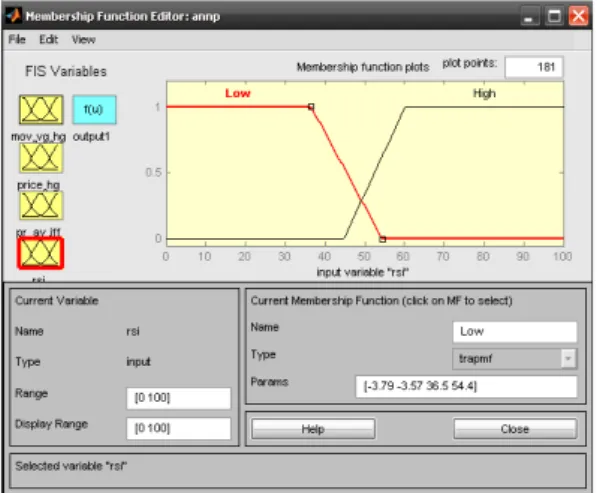
Fig. 6 depicts the trapezoidal membership function implemented for RSI.
III. ADAPTIVE NEURO FUZZY INFERENCE SYSTEM(ANFIS) Real systems like economic systems are complex and their behavior is often nonlinear and non stationary. These considerations make the modeling of such systems difficult. Data driven approaches have been increasingly applied to modeling and prediction of complex systems. These methods can perform nonlinear modeling without priory knowledge, and that are able to learn complex relationships among inputs and outputs. Recent works on hybrid systems aims to overcome the lack of knowledge explanation in artificial neural networks. Fuzzy logic introduced by L. A. Zadeh [7]
Fig. 6: MATLAB Membership Function for RSI
can model the qualitative aspects of human knowledge and reasoning processes without employing precise quantitative analyses. The use of artificial neural network and fuzzy Logic is expected to overcome the limitation due to the ability in mapping the nonlinear and multiple input-output data pairs. A particular architecture of neuro-fuzzy systems is that of the Adaptive Neuro Fuzzy Inference System (ANFIS) introduced by J-S. R. Jang [8]. Fig.7 shows the fuzzy inference system used in ANFIS and it is composed of four functional blocks. The knowledge base block contains database and rule base. Database defines the membership functions and rule base consists of fuzzy if-then rules. A fuzzification interface which transforms the crisp inputs into degrees of match with linguistic values; a defuzzification interface which transform the fuzzy results of the inference into a crisp output. The fuzzy rules used in ANFIS are of Takagi-Sugeno type. This type of fuzzy rule has fuzzy sets involved only in the premise part; the consequent part is described by a nonfuzzy equation of the input variables.
Fig. 7: Fuzzy Inference System
Fig. 8: Architecture of ANFIS Network
The ANFIS architecture describing Takagi-Sugeno fuzzy inference system is shown in Fig. 8. The circular nodes represent nodes that are fixed whereas the square nodes are nodes that have parameters to be learnt. For simplicity, it is assumed that the fuzzy inference system under consideration has two inputs x and y and one output f. The rule base in ANFIS architecture shown in Fig. 8 contains two fuzzy if-then rules of Takagi and Sugeno’s type. To describe the ANFIS architecture briefly, consider two fuzzy if-then rules based on a first order Sugeno model:
membership functions are normally used in this layer. These parameters are called premise parameters (the ‘if’ part of the rule). Layer 4 has also three modifiable parameters (pi1, qi,
and ri) pertaining to the first order polynomial. These
parameters are called consequent parameters (the ‘then’ part of the rule). The nodes in layer 2 are fixed nodes performing a simple multiplication. The nodes in layer 3 are also fixed nodes labeled N, indicating that they play a normalization role in the network. The output of layer 4 is simply the product of the normalized firing strength and a first-order polynomial. The single node in layer 5 is a fixed node labeled Σ, which computes the overall output as the summation of all incoming signals
The task of the training for ANFIS architecture is to tune all the modifiable parameters to make the ANFIS output match the training data. Therefore, a hybrid learning algorithm using both least-squares method and back propagation is used to identify the optimal values for the parameters pi, qi, ri and the parameters of the MF's if required. Detail of this algorithm is described in [8].
IV. EXPERIMENTALRESULTS
The system was tested on a number of stocks from different sectors of the economy for e.g. Automobiles, FMCG, Oil and Gas. The data used for development and testing of system was obtained from the website “moneycentral.msn.com”. It provided the stock prices prevailing at NASDAQ. The data contains the stock prices on current day/week, the highest and lowest values and the volume of the stocks traded on that day/week. Data for the period April 2007 to April 2008 i.e. 53 points data set (one data point for each week), was used for testing the system.
To test the results from the system, a Simulink model was developed to take inputs from available parameter values of various company stocks. The system then generates the suitable numerical output indicating the type of decision that will be suitable for the investor.
A value near 10 indicates “Buy” signal, whereas a value near zero indicates “Sell” signal. In case the value is midway it means that the system is unable to judge the trend and doesn’t suggest any action.
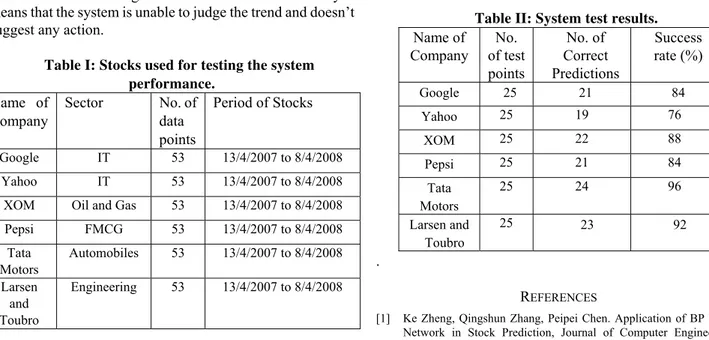
Table I: Stocks used for testing the system performance.
Name of Company
Sector No. of
data points
Period of Stocks
Google IT 53 13/4/2007 to 8/4/2008
Yahoo IT 53 13/4/2007 to 8/4/2008
XOM Oil and Gas 53 13/4/2007 to 8/4/2008
Pepsi FMCG 53 13/4/2007 to 8/4/2008
Tata Motors
Automobiles 53 13/4/2007 to 8/4/2008
Larsen and Toubro
Engineering 53 13/4/2007 to 8/4/2008
V. CONCLUSION
This paper demonstrates the immense capabilities of neuro-fuzzy architecture like ANFIS in implementing complex time series prediction and decision making tasks. It clearly shows its importance in nonlinear system modeling where other conventional methods have not had much success. The short comings of the method developed above include short-time prediction capabilities, non real time data processing and prediction. There is also not complete optimization of profits for the investor. This is because the system waits till it establishes that down trend has started before it signals “Sell”. So the investor looses some money before he sells that particular share.
The next step of development for the system includes development of real time data acquisition and processing capabilities by integrating it with a data source on the internet. By further experimentation and studies, the Membership functions can be modified to improve the test results.Genetically trained moving averages can also be used in the future to follow the price trends more accurately. (We can train the weights using Genetic Algorithm.)
Under the branch of study of technical analysis, there are certain well defined trend patterns that have been observed to occur in the market. Historical data and its analysis have made it possible to predict the future behavior of the stock once these kinds of patterns are observed. Future up gradation of the system presented here will also try to implement this pattern recognition so that maximum aid can be provided to the investor for making judicious decision. One of the most important additions that can be made to the system is that given a set of stocks and their value history, the system should be able to assign “weights or percentages” which will signify the fraction of total investment that should be made in that particular stock so as to minimize risk and maximize profits.
Table II: System test results. Name of
Company No. of test points
No. of Correct Predictions
Success rate (%)
Google 25 21 84
Yahoo 25 19 76
XOM 25 22 88
Pepsi 25 21 84
Tata Motors
25 24 96
Larsen and Toubro
25 23 92
.
REFERENCES
[2] Kimoto, T., Asakawa, K., Yoda, M., and Takeoka, M. (1990), Stock market prediction system with modular neural network, in Proceedings of the International Joint Conference on Neural Networks, 1-6. [3] Mizuno, H., Kosaka, M., Yajima, H. and Komoda N. (1998),
Application of Neural Network to Technical Analysis of Stock Market Prediction, Studies in Informatic and Control, Vol.7, No.3, pp.111-120. [4] Sexton, R. S., R. E. Dorsey and J. D. Johnson (1998), Toward global optimization of neural networks: A comparison of the genetic algorithm and backpropagation, Decision Support Systems 22, 171-185.
[5] Phua, P.K.H. Ming, D., Lin, W. (2000), Neural Network With Genetic Algorithms For Stocks Prediction, Fifth Conference of the Association of Asian-Pacific Operations Research Societies, 5th - 7th July, Singapore.
[6] W.-K. Chen, Linear Networks and Systems (Book style). Belmont, CA: Wadsworth, 1993, pp. 123–135.
[7] L. A. Zadeh, “Outline of a new approach to the analysis of complex systems and decision processes,” IEEE Trans. Syst., Man, Cybern., vol. 3, pp. 28-44, Jan. 1973.
[8] J-S. R. Jang, “ANFIS: Adaptive-Network-Based Fuzzy Inference System”, IEEE Trans. Syst., Man, Cybern., vol. 23, pp. 665-685, 1993. [9] T. Takagi and M. Sugeno, “Fuzzy identification of systems and its