Article
J. Braz. Chem. Soc., Vol. 22, No. 8, 1446-1451, 2011. Printed in Brazil - ©2011 Sociedade Brasileira de Química 0103 - 5053 $6.00+0.00
A
*e-mail: [email protected]
Predicting Partition Coeficients of Migrants in Food Simulant/Polymer Systems
using Adaptive Neuro-Fuzzy Inference System
Parviz Shahbazikhah,*,a Mohammad Asadollahi-Baboli,a Ramin Khaksar,b Reza Fareghi Alamdaria and Vali Zare-Shahabadic
aDeepartment of Chemistry and cYoung Researchers Club, Islamic Azad University, Mahshahr Branch, Mahshahr, Iran
bDepartment of Food Science and Technology, National Nutrition and Food Technology Research Institute, Faculty
of Nutrition Science and Food Technology, Shaheed Beheshti University of Medical Sciences, Tehran, Iran
A contaminação de alimentos pela migração de aditivos de baixo peso molecular em alimentos processados industrialmente pode ser resultado do contato direto entre a embalagem e o alimento. A concentração do aditivo que migra do material da embalagem para o alimento está relacionada com as propriedades estruturais do aditivo, bem como com a natureza do material empregado na embalagem. O objetivo deste estudo é desenvolver um modelo QSPR pela adaptação do sistema de interferência neuro-fuzzy (ANFIS) a im de predizer o valor do coeiciente de partição K, no sistema de estudo, embalagem/alimento. Para tal, foram investigados 44 coeicientes de partição em vários sistemas, assim constituídos: 4 de simuladores alimentares, 6 de migrantes alimentares e 2 de embalagens. Um conjunto de 6 descritores moleculares, representando várias características dos simuladores de alimentos (2 descritores), dos migrantes (3 descritores) e de polímeros (1 descritor) foi empregado como a série de dados para avaliar esse estudo. Esta série de dados foi dividida em três subconjuntos: treinamento, teste e predição. A técnica de modelagem ANFIS foi aplicada pela primeira vez neste campo de estudos relacionado com alimento/embalagem. O resultado desta modelagem forneceu um RMSE de 0,0006 e o coeiciente de correlação (R2) para o ensaio da predição foi de 0,9920.
Food contaminations by migration of low molecular weight additives into foodstuffs can result from direct contact between packaging materials and food. The amount of migration is related to the structural properties of the additive as well as to the nature of packaging material. The goal of this study is to develop a quantitative structure-property relationship (QSPR) model by the adaptive neuro-fuzzy inference system (ANFIS) for prediction of the partition coeficient K in food/ packaging system. The partition coeficients of a set of 44 systems consisted of 4 food simulants, 6 migrants and 2 packaging materials were investigated. A set of 6 molecular descriptors representing various structural characteristics of food simulants (2 descriptors), migrants (3 descriptors) and polymers (1 descriptor) was used as data set. This data set was divided into three subsets: training, test and prediction. ANFIS as a new modeling technique was applied for the irst time in this ield. The inal model has a root mean square error (RMSE) of 0.0006 and correlation coeficient (R2) for the prediction set of 0.9920.
Keywords: quantitative structure property relationship (QSPR), adaptive neuro-fuzzy inference system (ANFIS), partition coeficients, additive migration, food safety
Introduction
Continuous efforts in food matrix preservation, distribution and marketing are being made worldwide to supply consumers with high quality products and foods. To avoid food packaging contamination, one should irst ind the source of contamination. Various interactions
between food and packaging materials can contaminate food. Migration of low molecular weight additives from packaging materials into foodstuffs can also contaminate
them.1 Types and levels of solvents and migrating
monomers from polymers into foods are important factors of food contamination. Many research groups have been
widely studying the food contamination.2-4 Also, the
migration of low molecular weight compounds from a food
The thermodynamic equilibrium (partition) of the migration process can be deined as an exchange of mass/
energy between the packaging material and food.6 For
quality control of food packaging, the partition coeficients between polymer packaging and the food matrix should be known. Fortunately, quantitative structure-property relationships (QSPR) based on computational methods have made possible calculating these partition coeficients. Indeed, QSPRs represent predictive models derived from application of statistical tools correlating chemical property, such as partition coeficient, with descriptors representative of molecular structure and/or property. The success of any QSPR model depends on the accuracy of input data,
selection of appropriate descriptors and statistical tools.7
Finally the developed model is subjected to validation step. The validation strategies check the reliability of the developed model for its possible application on a new data set, and conidence of prediction can thus be judged. In the current work, we have validated model using three techniques: leave-one-out and leave-multiple-out cross validation techniques and Y-randomization test.
The objectives of the present paper are twofold: i) to
explore the structure property relationships of partition
coefficient of diverse systems and ii) to compare the
developed ANFIS model with the quadratic model reported
previously.8
Theory
Adaptive neuro-fuzzy inference system
The proposed neuro-fuzzy model in ANFIS is a
multilayer neural network-based fuzzy system.9-10 Its
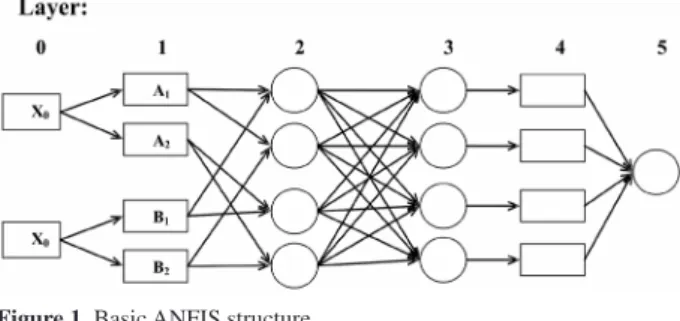
topology is presented in Figure 1. As shown, the system has a total of ive layers. In this connectionist structure, the input (layer 0) and output (layer 5) nodes represent the descriptors and the response, respectively. In the hidden layers, there are nodes functioning as membership functions (MFs) and rules. This architecture eliminates the disadvantage of a normal feed forward multilayer network, which is dificult for an observer to understand or to modify. ANFIS simulates Takagi-Sugeno-Kang fuzzy
rule11 of type-3 where the consequent part of the rule is a
linear combination of input variables and a constant. For a Sugeno fuzzy model a common rule set with the fuzzy if then rule is as follow:
If x is Ai and y is Ai, then
fi = pix + qiy + ri for i = 1, 2 (1)
For simplicity, we assume here that the examined
fuzzy inference system has two inputs x and y and one
output, although the ANFIS contains ive layers as shown in Figure 1:
Layer 1.The fuzzy part of ANFIS is mathematically incorporated in the form of membership functions (MFs).
A membership function µAi(x) can be any continuous and
piecewise differentiable function that transforms the input value x into a membership degree, that is to say a value between 0 and 1. The most widely applied membership functions are the generalized bell (gbell MF) and the Gaussian function (equations (2) and (3), respectively) which are described by the three parameters, a, b, and c.
Therefore, layer 1 is the fuzziication layer in which each
node represents a membership:
(2)
(3)
As the values of the parameters {ai, bi and ci} change,
the bell-shaped functions vary accordingly, exhibiting various forms of membership functions on linguistic label
Ai. Parameters in this layer are referred to as premise
parameters.
Layer 2.Every node in this layer is a ixed node labeled, whose output is the product of all the incoming signals:
O2,1 = wi = miA (x) × miB (y) for i = 1, 2 (4)
Every node in this layer computes the multiplication of the input values and gives the product as the output.
The membership values represented by µAi(x) and µBi(y)
are multiplied in order to ind the iring strength of a rule
where the variables x and y has linguistic values Ai and
Bi, respectively
Layer 3. This layer is the normalization layer which normalizes the strength of all rules according to equation (5):
for i = 1, 2 (5)
where wi is the iring strength of the ith rule which is
computed in layer 2. Node i computes the ratio of the ith
rule’s iring strength to the sum of all rules’ iring strengths. For convenience, outputs of this layer are called normalized iring strengths.
Layer 4.Every node in this layer is an adaptive node with a node function:
O4,i = w–ifi = w–i(pix + qiy + ri) (6)
where wiis a normalized iring strength from layer 3 and
{pi, qi, ri} is the parameter set for this node. Parameters in
this layer are referred to as consequent parameters.
Layer 5.The single node in this layer is a ixed node
labeled Σ, which computes the overall output as the
summation of all incoming signals:
(7)
Thus we have constructed an ANFIS system that is functionally equivalent to Sugeno fuzzy model, which was used in the present QSPR study due to its transparency and eficiency.
Cross-validation techniques
The consistency and reliability of a method can be
explored using the cross validation technique.12 Two different
strategies including leave-one-out (LOO) or leave-multiple-out (LMO) can be employed. In LOO strategy, by deleting each time one object from the training set, a number of models are produced. Obviously, the number of models produced by the LOO procedure is equal to the number
of available samples (n), e.g. n= 44. Prediction error sum
of squares (PRESS) is a standard index to measure the accuracy of a modeling method based on the cross-validation technique. Based on the PRESS and SSY (sum of squares of deviations of the experimental values from their mean)
statistics, the Q2 can be easily calculated by equation (8):
(8)
In this sense, a high value for the statistical parameter is considered as proof of high predictive ability of the
model.13 However, several authors suggest that a high value
of Q2
LOO appears to be necessary but not suficient.
14 For
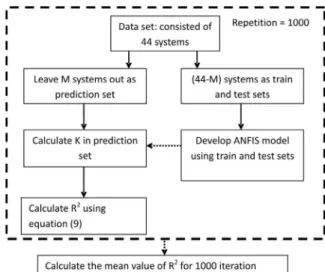
this reason, we also used LMO cross validation technique. In the case of LMO, M represents a group of randomly selected data points which is left out at the beginning and would be predicted then by the model developed using the remaining data points. So, M molecules are considered as a
prediction set. The R2
LMOcan be calculated by equation (9):
(9)
This algorithm is shown in Figure 2. It is common choosing 10-30% of the total number of molecules to
leave-out. In the present work, calculation of R2
LMO was
based on 1000 randomly selections of groups of 8 and 12
samples. The higher value of Q2
LOO or R
2
LMO indicates the
higher predictive power of the model.
Methodology
Data set and descriptors
The equilibrium distribution of migrants is affected by the partitioning behavior of compounds between polymer packaging and the food matrix. Therefore the nature of food simulant, polymer and migrant are important to avoid food
contamination. The data collected by Tehrany et al.8 was used
to develop a QSPR model using ANFIS method.The total data set consists of 44 systems of simulant/polymer/migrant together with their partition coeficient (K). The partition coeficients (K) were used as dependent variable in our QSPR
study. As the equilibrium distribution of migrants is dependent on the nature of food simulant, polymer and migrant, the data
set consists of systems including three components: (i) Food
simulant; (ii) polymer; (iii) migrant. In order to simplify for
each system a code (I) was deined by the following equation:8
I = 100 × LFood + 10 × LPolymer + LMigrant
where LFood, LPolymer, and LMigrant are levels for food, polymer, and migrant components, respectively. These levels are given in Table 1 for each compound. Therefore, as an example, a system with I = 224 consists of 10% ethanol/PA/IP.
A set containing six molecular descriptors was used. The values of all descriptors are listed in Table 2. As this table shows, these descriptors are polymer polarity, food simulant polarity, simulant molecular weight, migrant molecular weight, migrant LUMO (lowest unoccupied molecular orbital) and migrant HLB (hydrophilicity, lipophilicity balance).
Model development by ANFIS
To develop ANFIS model the data set was divided into three subsets: training, test and prediction. All molecules were randomly placed in these sets. The training set consisted of 22 molecules used to generate the model. The test set containing 11 molecules was employed to take care of the overtraining. The prediction set comprised of 11 molecules was used to evaluate the model.
The compounds included in each set are speciied in Table 1. The six simulant/polymer/migrant descriptors were used as inputs for development of the ANFIS model. The model building involves two stages: structure identiication and parameter identiication. The former is related to inding a suitable number of rules and a proper partition of the feature space. The latter is concerned with the adjustment of system parameters, such as MF (membership function) parameters, linear coeficients, and so on. It is concluded that by increasing the number of MFs per input, the number of rules increases accordingly. For the irst stage of ANFIS modeling, grid partitioning should be used for partitioning the features. The number and type of membership functions should be optimized by using RMSE as a criterion for the test set. All ANFIS models were produced using MATLAB 7.0 Fuzzy Logic Toolbox (MATLAB, Mathworks Inc. software, Natick, USA, 2008).
Results and Discussion
Statistical parameters of ANFIS model
Prediction results of the ANFIS model for all data sets are shown in Table S1 (available as Supplementary Information). The statistical parameters of the resulted model are given in Table 3. In this table, the model is also compared to the quadratic model previously reported on
the same data set by Tehrant et al.8 which is as follows:
K = a0 + a1x1 + a2x2 + a3x3 + a4x4 + a5(x1expx3) +
a6(x1x4) + a7(x2x4) + a8(x3x4) + a9x2 3 + a10x
2
4 + a11x5x6 (10)
where x1 is the polarity of food simulant, x2 is the polarity
of polymer, x3 is the molecular weight of migrant, x4 is
LUMO, x5 is the molecular weight of food simulant and
x6 is the HLB of migrant.
It can be seen that the RMSEprediction value has
improved from 0.0248 for the quadratic model to 0.0006 for the ANFIS model. It shows that the ANFIS model is (0.248/0.0006 = 41.3) times more precise than the quadratic model. In the other words, this nonlinear model is able to predict the variances of the partition coeficients.
Table 1. Compounds and their levelsa
Food simulant Polymer Migrant
(1) Water (1) PET (1) EA
(2) 10% Ethanol (2) PA (2) AA
(3) 3% Acetic Acid (3) AN
(4) 95% Ethanol (4) IP
(5) MEK (6) BA a PET: Polyethylene terephthalate; PA: Polyamide; EA: Ethyl acetate; AA: Acetaldehyde; AN: Acetonitrile; IP: Isopropyl acetate; MEK: Methyl ethyl ketone; BA: Butyraldehyde.
Table 2. Physico-chemical properties of food simulant, polymer and migrant
Name a Polarityb MW LUMO migrant
HLB migrant
PET 9.65 - -
-PA 4.83 - -
-Water 16 18.01 -
-10% Ethanol 15.28 20.82 -
-3% Acetic acid 15.75 19.27 -
-95% Ethanol 9.16 44.66 -
-EA - 88.1 0.1604 5.1
AA - 44.05 0.1511 8.23
AN - 41.05 0.2184 4.78
IP - 102.13 0.1615 4.15
MEK - 72.1 0.146 2.15
BA - 72.1 0.1521 4.59
The correlation between the experimental and
calculated values of the partition coeficientsis shown
in Figure 3. The residuals of the calculated values of the
partition coeficientsare plotted against the experimental
ones in Figure 4. The propagation of the residuals in both sides of zero line indicates that no symmetric error exists in the proposed QSPR model.
Evaluation of ANFIS models
The models were also subjected to the test for criteria of the validity of the generated model. The cross validation techniques such as leave-one-out (LOO-CV) and leave-multiple-out (LMO-CV) were used to prove the consistency of the model. In particular, the leave-one-out (LOO), leave-eight-out (L8O) and leave-twelve-out (L12O)
procedures were utilized in this work for both the ANFIS and quadratic models. The results are shown in Table 4.
Note that calculations of R2
L8O and R
2
L12O were based on
1000 randomly selections of groups containing eight and twelve samples from the original training set. The high
values of the R2 for LOO, L8O and L12O indicate that the
proposed model is reliable.
Moreover, to assess the robustness of the ANFIS method the Y-randomization test was applied. The dependent
variable vector Kwas randomly shufled and a new QSPR
model was developed using the original descriptor matrix. The new QSPR model is expected to show a low value
for R2
prediction and Q 2
LOO. Several random shufles of the K
vector were performed for which the results are shown in Table 5. The results tabulated in Table 5 indicate that the ANFIS model is not due to a chance correlation or structural dependency in the training set.
Conclusions
Quantitative structure property relationships (QSPR) were developed for the calculation of K values based on molecular descriptors. Our model was based on the six molecular descriptors: polarity of food simulant, polarity of polymer, molecular weight of migrant, LUMO (lowest unoccupied molecular orbital), molecular weight of food simulant and HLB (hydrophilicity, lipophilicity balance)
Table 3. Statistical parameters of MLR (multilinear regression) and ANFIS models
Parameters MLRa ANFIS
R2 (training) 0.925 0.998
RMSE (training) 0.0235 0.0005
R2 (test) - 0.995
RMSE (test) - 0.0005
R2 (prediction) 0.904 0.992
RMSE (prediction) 0.0248 0.0006
a the MLR model developed by Tehrany et al.8
Figure 3. Plot of the ANFIS calculated partition coeficient vs. the experimental values for the training, test and prediction sets.
Figure 4. Plot of residuals vs. experimental values of partition coeficient for the ANFIS model.
Table 4. Statistics using LOO-CV and LMO-CV methods to compare the results of ANFIS method with quadratic method for prediction of distribution constants
Method LOO L8O a L12O a
Q2 RMSE
p R2 RMSEp R2 RMSEp
ANFIS 0.985 0.0008 0.981 0.0008 0.984 0.0009
Quadratic 0.897 0.0269 0.892 0.0273 0.896 0.0278
aCalculation of R2
Table 5. R2 and Q2
LOO values after several Y-randomization tests
Interation R2
p Q2LOO
1 0.15 0.08
2 0.03 0
3 0.05 0.07
4 0.17 0.12
5 0.03 −0.06
6 0.09 0.02
7 0.23 0.11
8 0.07 0.03
9 0 −0.09
10 0.14 0.03
of migrant. Forty four different systems of food/migrant/ packaging were predicted using these descriptors. ANFIS as a powerful nonlinear tool was used to develop a model between descriptors and K values. We validated our model using the cross validation techniques of leave-one-out, leave-multiple-out and also Y-randomization test. The theoretical values of partition coeficients showed that there is a good correlation between the physico-chemical and structure of molecule. As inal conclusion, ANFIS produced substantially better model than the quadratic
model reported recently.8
Supplementary Information
Theexperimental and calculated partition coeficients
for both least square and ANFIS models in this QSAR study is available free of charge at http://jbcs.sbq.org.br as PDF ile.
References
1. Figge, K.; Plastic Packages for Foodstuffs: a Topical Survey of Legal Regulations and Migration Testing, Wissenschaftliche Verlagsgellschaft: Stuttgart, 1996.
2. Harte, B. R.; Gray, J. I.; Miltz, J.; Food Product-Package Compatibility,1st ed., Technomic Publ. Co.: East Lansing, 1987.
3. Risch, S.; Food Technol. 1988, 7, 95.
4. Gilbert, G. S.; Miltz, J.; Giacin, J. R.; J. Food Process Preserv.
1980, 4, 27.
5. Giacin, J. R.; In Foods and Packaging Materials-Chemical Interactions; Ackermann, P.; Jägerstad, M.; Ohlsson, T. eds.; RSC: Cambridge, Great Britain, 1995, p. 12.
6. An, D.; Halek, G.; J. Food Sci. 1996, 61, 185.
7. He, L.; Jurs, P.; J. Mol. Graphics Modell 2005, 23, 503. 8. Tehrany, E.; Fournier, F.; Desobry, S.; J. Food Eng. 2006, 77,
135.
9. Shi, W.; Shen, Q.; Kong, W.; Ye, B.; Eur. J. Med. Chem. 2007, 42, 81.
10. Jalali-Heravi, M.; Shahbazikhah, P.; Ghadiri-Bidhendi, A.;
Quant. Struct. Act. Relat. 2008, 27, 729.
11. Sugeno, M.; Kang, G.; Fuzzy Set Syst. 1988, 28, 15. 12. Osten, D.; J. Chemom. 1988, 2, 39.
13. Wold, S.; Quant. Struct. Act. Relat. 1991, 10, 191.
14. Golbraikh, A.; Tropsha, A.; J. Mol. Graphics Modell 2002, 20, 269.
Submitted: July 31, 2010
Supplementary Information
S
I
J. Braz. Chem. Soc., Vol. 22, No. 8, S1, 2011. Printed in Brazil - ©2011 Sociedade Brasileira de Química 0103 - 5053 $6.00+0.00
*e-mail: [email protected]
Predicting Partition Coeficients of Migrants in Food Simulant/Polymer Systems
using Adaptive Neuro-Fuzzy Inference System
Parviz Shahbazikhah,*,a Mohammad Asadollahi-Baboli,a Ramin Khaksar,b Reza Fareghi Alamdaria and Vali Zare-Shahabadic
aDeepartment of Chemistry and cYoung Researchers Club, Islamic Azad University, Mahshahr Branch, Mahshahr, Iran
bDepartment of Food Science and Technology, National Nutrition and Food Technology Research Institute, Faculty
of Nutrition Science and Food Technology, Shaheed Beheshti University of Medical Sciences, Tehran, Iran
Table S1. Experimental and calculated partition coeficients for both least square and ANFIS models in this QSAR study System Subset a K
Exp KQuadratic b KANFIS
111 A 0.1530 0.1553 0.1527
211 A 0.1784 0.1453 0.1782
311 B 0.1428 0.1519 0.1433
411 A 0.0538 0.0541 0.0538
121 C 0.1985 0.1676 0.1984
221 A 0.1175 0.1576 0.1174
321 A 0.1542 0.1642 0.1544
421 B 0.0643 0.0664 0.0643
112 C 0.0886 0.0605 0.0885
212 A 0.0753 0.0349 0.0752
312 C 0.0174 0.0512 0.0176
122 A 0.0484 0.0516 0.0484
222 C 0.0155 0.0260 0.0155
322 B 0.0214 0.0423 0.0215
113 A 0.2148 0.2477 0.2148
213 A 0.0380 0.0060 0.0380
313 C 0.1419 0.1622 0.1420
123 B 0.4366 0.3924 0.4366
223 A 0.0986 0.1384 0.0986
323 A 0.3115 0.3069 0.3115
114 A 0.0519 0.0480 0.0520
214 B 0.0868 0.0655 0.0869
System Subset a K
Exp KQuadratic b KANFIS
314 A 0.0592 0.0541 0.0590
414 C 0.1588 0.1414 0.1588
124 A 0.0310 0.0628 0.0310
224 B 0.1292 0.0803 0.1292
324 C 0.0494 0.0689 0.0493
424 B 0.1362 0.1562 0.1362
115 A 0.0357 0.0418 0.0349
215 C 0.0567 0.0765 0.0561
315 A 0.0426 0.0542 0.0440
415 B 0.1557 0.1573 0.1557
125 A 0.0474 0.0213 0.0471
225 C 0.0598 0.0560 0.0596
325 B 0.0429 0.0337 0.0434
425 A 0.1213 0.1368 0.1213
116 C 0.0217 0.0357 0.0228
216 A 0.0174 0.0383 0.0182
316 B 0.0385 0.0367 0.0366
416 A 0.0216 0.0188 0.0216
126 A 0.0349 0.0290 0.0353
226 C 0.0413 0.0317 0.0416
326 A 0.0428 0.0301 0.0421
426 B 0.0143 0.0122 0.0143