Health Insurance Coverage and Hypertension
Control in China: Results from the China
Health and Nutrition Survey
Yi Liao*, Stuart Gilmour, Kenji Shibuya
Department of Global Health Policy, University of Tokyo, Tokyo, Japan
*liaoyi.pku@gmail.com
Abstract
Background
China has rapidly expanded health insurance coverage over the past decade but its impact on hypertension control is not well known. We analyzed factors associated with hyperten-sion and the impact of health insurance on the management of hypertenhyperten-sion in China from 1991 to 2009.
Methods and Findings
We used individual-level data from the China Health and Nutrition Survey (CHNS) for blood pressure, BMI, and other socio-economic variables. We employed multi-level logistic regression models to estimate the factors associated with prevalence and management of hypertension. We also estimated the effects of health insurance on management of hyper-tension using propensity score matching. We found that prevalence of hyperhyper-tension increased from 23.8% (95% CI: 22.5–25.1%) in 1991 to 31.5% (28.5–34.7%) in 2009. The proportion of hypertensive patients aware of their condition increased from 31.7% (28.7– 34.9%) to 51.1% (45.1–57.0%). The proportion of diagnosed hypertensive patients in treat-ment increased by 35.5% in the 19 years, while the proportion of those in treattreat-ment with controlled blood pressure remained low. Among diagnosed hypertensives, health insurance increased the probability of receiving treatment by 28.7% (95% CI: 10.6–46.7%) compared to propensity-matched individuals not covered by health insurance.
Conclusions
Hypertension continues to be a major health threat in China and effective control has not improved over time despite large improvements in awareness and treatment access. This suggests problems in treatment quality, medication adherence and patient understanding of the condition. Improvements in hypertension management, quality of medical care for those at high risk, and better health insurance packages are needed.
a11111
OPEN ACCESS
Citation:Liao Y, Gilmour S, Shibuya K (2016) Health Insurance Coverage and Hypertension Control in China: Results from the China Health and Nutrition Survey. PLoS ONE 11(3): e0152091. doi:10.1371/ journal.pone.0152091
Editor:Yoshihiro Kokubo, National Cardiovascular Center Hospital, JAPAN
Received:June 30, 2015
Accepted:March 8, 2016
Published:March 22, 2016
Copyright:© 2016 Liao et al. This is an open access
article distributed under the terms of theCreative
Commons Attribution License, which permits unrestricted use, distribution, and reproduction in any medium, provided the original author and source are credited.
Data Availability Statement:All the data are from the China Health and Nutrition Survey (http://www. cpc.unc.edu/projects/china).
Introduction
In China, hypertension is the second most common disease risk factor [1]. Approximately 177 million people are estimated to be living with hypertension, with relatively low rates of aware-ness and control of this condition. [2,3] Previous studies have shown that public health services may be making little contribution in informing patients of their hypertensive status, [4] and more research is needed to understand how the response to this disease can be improved in the context of a rapidly changing health system and an aging population. Also, although some research on hypertension management in China has been conducted, the direct associations of health insurance on hypertension management still remain unknown.
China’s health insurance coverage has increased rapidly from 45% in 2006 to around 90% in 2009, [5] but the effectiveness of health insurance packages for hypertensive patients is not yet well understood at the population level, even though some contain special measures for severely hypertensive patients. [6] Given China’s rapid development over the past decade and the changes in health insurance coverage over the last five years, it is essential to evaluate the impact of health insurance on hypertension management and control.
In this article we had three main objectives:
• Estimating the prevalence of hypertension in China during the period of the CHNS;
• Estimating the proportion of those with prevalent hypertension who were aware of their dis-ease, receiving treatment for it, or had controlled blood pressure;
• Estimating the effect of increased health insurance coverage on the management of hypertension.
Method
Data sources
We used datasets from the China Health and Nutrition Survey (CHNS), a cohort study estab-lished in 1989 with a total of eight survey waves in nine provinces until 2009. From 1989 to 2009, the CHNS collected data over a total of eight waves in nine provinces: Guangxi, Guizhou, Heilongjiang, Henan, Hubei, Hunan, Jiangsu, Liaoning, and Shandong. A stratified, multistage cluster sampling process was used to select samples in each of the provinces. Counties in each province were stratified according to income (low, middle, and high), and four counties in each province were selected using probability sampling. In each province, the capital city and a low-income city were selected if possible, although in two provinces large cities other than capitals had to be selected. Within these primary sampling units, villages, townships and urban/subur-ban neighborhoods were selected randomly. From 1989 to 1993 there were 190 primary sam-pling units: 32 urban neighborhoods, 30 suburban neighborhoods, 32 towns (county capital city), and 96 rural villages. After 2000, this increased to 216 units comprised of 36 urban neigh-borhoods, 36 suburban neighneigh-borhoods, 36 towns, and 108 villages. [7]
In this study, we used a repeated cross-sectional design, focusing on only new subjects above 35 years old in each wave for two reasons: First, physical exams in previous waves may have some effect on the awareness of high blood pressure in study subjects; secondly, the popu-lation under 35 has low prevalence of hypertension and hypertension in this age group may reflect very different risk factors. We excluded the first (1989) wave because the blood pressure testing method was different in this wave and information on some other socioeconomic vari-ables was missing. Participants without fully recorded blood pressure testing results in other waves were also excluded in this study. For propensity score matching, we also took out partici-pants who did not have socioeconomic variables that we used for matching.
Statistical analysis
Multi-level logistic regression models were used in this analysis. We modeled a household-level random intercept to adjust for the genetic and socio-economic similarities within one family. The four outcomes in these models were:
1. Prevalence, defined as hypertension diagnosed at the time of entry into the study cohort or
normal blood pressure readings in a subject currently taking anti-hypertensive medication. Hypertension was defined as average systolic blood pressure of the second and third of three tests140 mm Hg, or average diastolic blood pressure of the second and third test90 mm Hg;
2. Awareness, defined as a self-report of medically-diagnosed hypertension among subjects
with hypertension;
3. Treatment, defined as people aware of their hypertension who were receiving
anti-hyperten-sive medication treatment; and
4. Control, defined as normal blood pressure among people who were receiving treatment
Predictors tested in this model were sex, obesity, age and region of residence; study wave; education; income; presence of health insurance; smoking and alcohol use. Household per cap-ita income in Yuan, inflated to 2009 values (1 US dollar = 6.83 Yuan), [8] was used as the income predictor in the model, divided into quintiles. Standardized prevalence of hypertension was also calculated to adjust for changes in the age distribution of new entrants over time. Since no information on probability weights is provided in the CHNS, no probability weights were used in this model. [7] We retained all possible predictors in our final regression model including those that were not statistically significant.
Propensity score matching
We employed propensity score matching to estimate the average effects of health insurance on the management and control of hypertension. Propensity score matching is a process to adjust the data by matching the treated group to a control group that is defined as similar according to a propensity score developed based on background characteristics. [9] After propensity score matching, the comparability between the treatment variable (in this study, health insur-ance) and confounder variables is enhanced. By reducing the link between treatment variable and background variables through propensity score matching, regression results are less model-dependent and have reduced potential for bias. [9]
For the propensity score matching analysis, we used the k-Nearest neighbors matching method with five neighbors and matched individuals having health insurance with individuals who did not have health insurance using a propensity-score calculated based on study wave, age, sex, province, residency, income, and education level. One-to-one matching was used for sensitivity analysis, and found the similar results.
Results
Demographic characteristics of the sample
Table 1. Demographic and socio-economic properties of the sample.
Frequency Proportion (%)
Wave
1991 4532 45.5
1993 414 4.2
1997 1705 17.1
2000 738 7.4
2004 1029 10.3
2006 475 4.8
2009 1078 10.8
Gender
Male 4826 48.4
Female 5145 51.6
Province
Liaoning 1113 11.2
Heilongjiang 914 9.2
Jiangsu 1160 11.6
Shandong 1293 13.0
Henan 1202 12.1
Hubei 874 8.8
Hunan 968 9.7
Guangxi 1297 13.0
Guizhou 1150 11.5
Residency
Urban 3931 39.4
Rural 6040 60.6
Age
35–44 3465 34.8
45–54 2572 25.8
55–64 2164 21.7
65–74 1221 12.3
75 549 5.5
BMI
Normal 6488 65.1
Underweight 774 7.8
Overweight 1948 19.5
Obese 761 7.6
Smoking history
None or past smoker 6470 66.1
Current smoker 3313 33.9
Alcohol use frequency
None 6095 62.3
No more than 2 times a week 1948 19.9
More than 2 times a week 1738 17.8
Health insurance
No 6221 62.6
Yes 3714 37.4
Education
Not graduated from primary school 3729 38.6
study sample. The health insurance coverage rate in this sample was 37.4%, and 45.5% of the total sample came from the 1991 wave.
Prevalence of hypertension
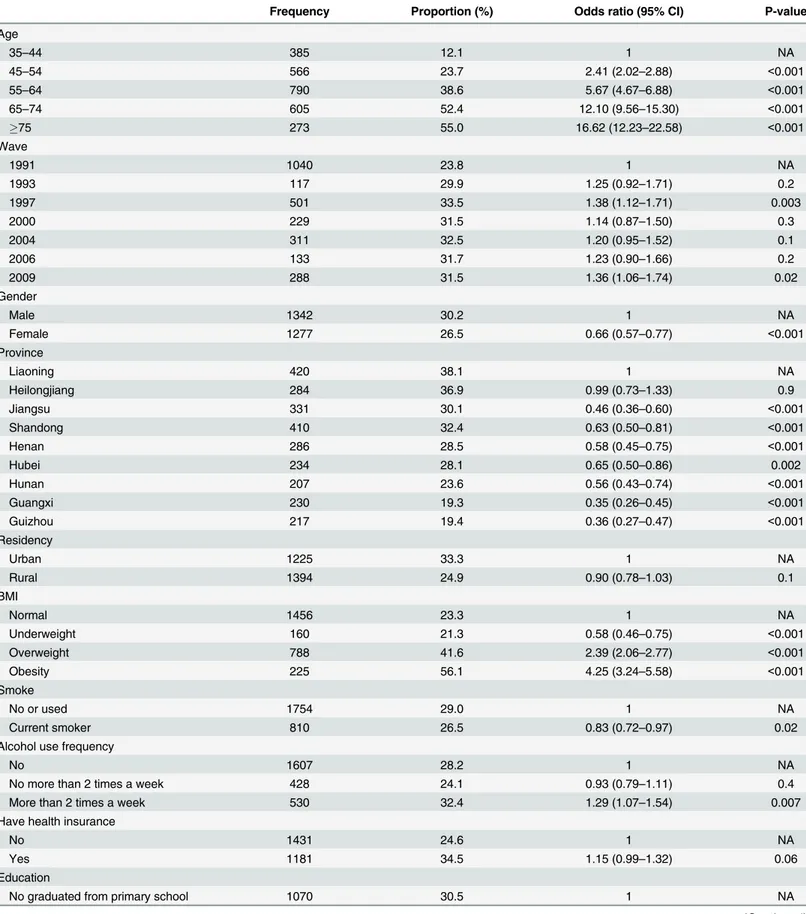
Table 2shows prevalence of hypertension along with multi-level logistic regression analysis results. Prevalence of hypertension among the whole sample was 28.3% (95% CI 27.3–29.2%) and increased to 31.5% (28.5–34.7%) in 2009. Trends in prevalence of hypertension were unchanged after standardization using the WHO Standard Population as a reference distri-bution. Age was significantly positively associated with prevalence of hypertension, and more than half of elderly individuals (over 65 years old) had hypertension. Consistent with previ-ous studies, women had lower prevalence of hypertension than men with odds ratio 0.67 (95% CI 0.57–0.79). Obesity increased the odds ratio of being hypertensive by a factor of 4.48 (3.41–5.89). Heavy drinking was also positively associated with prevalence of hypertension with an odds ratio of 1.34 (1.11–1.61). However, smoking and income had little effect. Com-pared to Liaoning province, Jiangsu, Hubei, and Guangxi provinces had lower prevalence of hypertension.
Trends in factors associated with hypertension
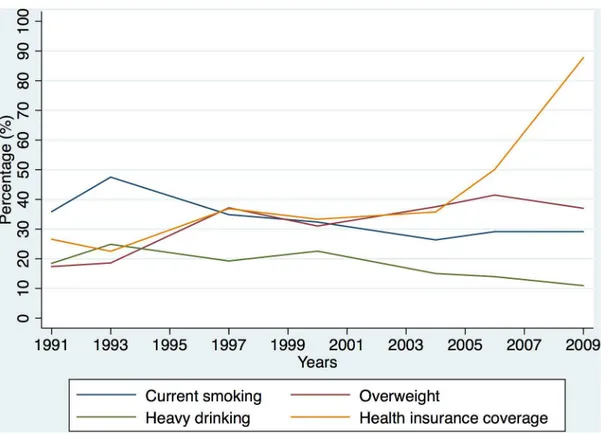
Fig 1shows how trends in tobacco and alcohol use, BMI and health insurance coverage have changed over time in this survey. The smoking rate increased from 1991 to 1993, and gradually decreased after that. The obesity rate (including obesity and overweight) increased slightly from 1991 to 2009. Health insurance coverage increased over time and grew rapidly after 2006. In 2009, health insurance coverage reached around 90% in this sample.
Management and control of hypertension
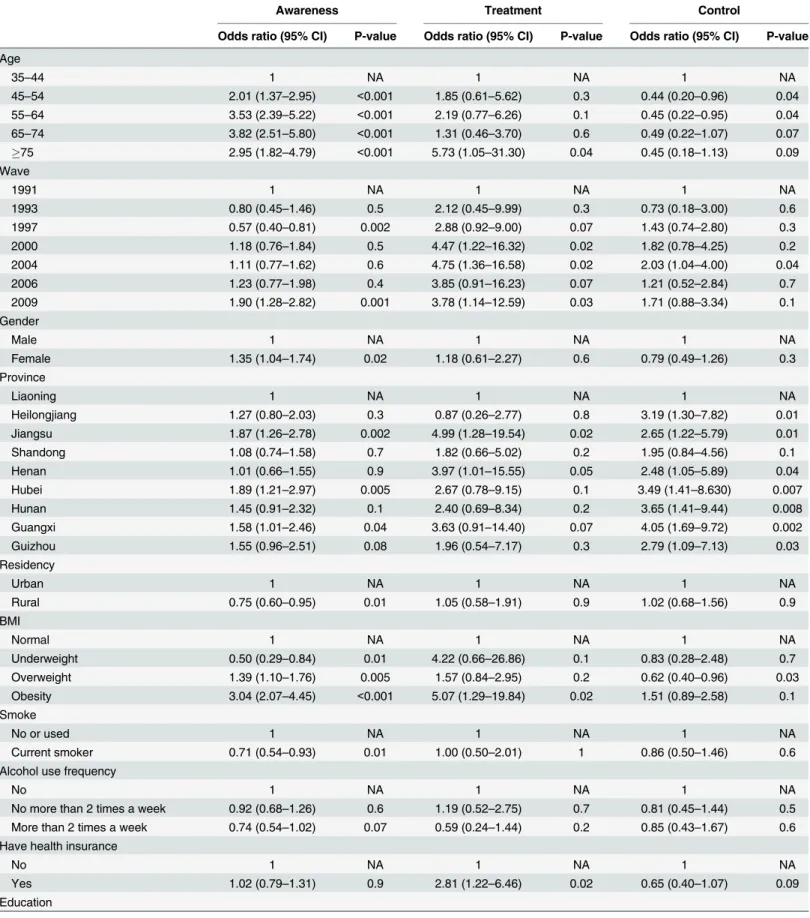
Table 3shows hypertension prevalence, awareness rates amongst hypertensives, treatment rates amongst diagnosed hypertensives, and control rates amongst medically-treated hyperten-sives in each wave.Fig 2shows the trends in prevalence and outcomes of hypertension man-agement over time. The proportion of people with hypertension who were aware of their condition gradually increased over time and reached 51.1% (95% CI 45.1–57.0%) in 2009 (Table 3).Table 4shows the logistic regression results of management outcomes. Elderly, obese and well-educated subjects were more likely to be aware of their hypertension. Current smok-ers or people living in rural areas were less likely to know about their hypertension. Inequality in hypertension awareness rates was found among different provinces, with people from Jiangsu, Hubei, and Guangxi provinces more likely to be diagnosed (Table 4).
Among individuals who were diagnosed as hypertensive, treatment rates have increased rapidly from 66.2% (60.3–71.7%) to 89.7% (83.6–94.1%) over the 19 years (Table 3). Although treatment rates increased rapidly over time, only 32.1% (95% CI 24.2–40.8%) of treated people had their hypertension under control in the latest survey in 2009 (Table 3).Table 4shows that only age and district were significantly associated with control, with older people or residents
Table 1. (Continued)
Frequency Proportion (%)
Graduated from primary school 2138 22.1
Graduated from middle or high school 3042 31.5
Tertiary education 765 7.9
Table 2. Prevalence of hypertension by key risk factors.
Frequency Proportion (%) Odds ratio (95% CI) P-value
Age
35–44 385 12.1 1 NA
45–54 566 23.7 2.41 (2.02–2.88) <0.001
55–64 790 38.6 5.67 (4.67–6.88) <0.001
65–74 605 52.4 12.10 (9.56–15.30) <0.001
75 273 55.0 16.62 (12.23–22.58) <0.001
Wave
1991 1040 23.8 1 NA
1993 117 29.9 1.25 (0.92–1.71) 0.2
1997 501 33.5 1.38 (1.12–1.71) 0.003
2000 229 31.5 1.14 (0.87–1.50) 0.3
2004 311 32.5 1.20 (0.95–1.52) 0.1
2006 133 31.7 1.23 (0.90–1.66) 0.2
2009 288 31.5 1.36 (1.06–1.74) 0.02
Gender
Male 1342 30.2 1 NA
Female 1277 26.5 0.66 (0.57–0.77) <0.001
Province
Liaoning 420 38.1 1 NA
Heilongjiang 284 36.9 0.99 (0.73–1.33) 0.9
Jiangsu 331 30.1 0.46 (0.36–0.60) <0.001
Shandong 410 32.4 0.63 (0.50–0.81) <0.001
Henan 286 28.5 0.58 (0.45–0.75) <0.001
Hubei 234 28.1 0.65 (0.50–0.86) 0.002
Hunan 207 23.6 0.56 (0.43–0.74) <0.001
Guangxi 230 19.3 0.35 (0.26–0.45) <0.001
Guizhou 217 19.4 0.36 (0.27–0.47) <0.001
Residency
Urban 1225 33.3 1 NA
Rural 1394 24.9 0.90 (0.78–1.03) 0.1
BMI
Normal 1456 23.3 1 NA
Underweight 160 21.3 0.58 (0.46–0.75) <0.001
Overweight 788 41.6 2.39 (2.06–2.77) <0.001
Obesity 225 56.1 4.25 (3.24–5.58) <0.001
Smoke
No or used 1754 29.0 1 NA
Current smoker 810 26.5 0.83 (0.72–0.97) 0.02
Alcohol use frequency
No 1607 28.2 1 NA
No more than 2 times a week 428 24.1 0.93 (0.79–1.11) 0.4
More than 2 times a week 530 32.4 1.29 (1.07–1.54) 0.007
Have health insurance
No 1431 24.6 1 NA
Yes 1181 34.5 1.15 (0.99–1.32) 0.06
Education
No graduated from primary school 1070 30.5 1 NA
of Liaoning and Shandong provinces less likely to have their hypertension under control. There was no significant time trend in control rates amongst treated patients, and increased health insurance coverage also had little association with control.
Propensity score matching
The average treatment effects of health insurance on awareness in total were 0.05 (95% CI -0.08 to 0.19, p-value 0.2), 0.06 (-0.08 to 0.20, p-value 0.2) in urban areas and 0.01 (-0.21 to 0.23, p-value 0.5) in rural areas after propensity score matching. The average treatment effect of health insurance on treatment was 0.29 (0.11 to 0.47, p-value 0.001) in total, 0.27 (0.05 to 0.48, p-value 0.008) in urban areas and 0.27 (-0.11 to 0.65, p-value 0.08) in rural areas. The
Table 2. (Continued)
Frequency Proportion (%) Odds ratio (95% CI) P-value
Graduated from primary school 517 25.9 0.90 (0.75–1.07) 0.2
Graduated from middle or school 700 25.2 1.04 (0.87–1.24) 0.7
Tertiary education 207 29.3 0.72 (0.55–0.94) 0.02
Quintiles of income
1 486 22.5 1 NA
2 383 24.6 1.10 (0.90–1.36) 0.4
3 597 32.0 1.25 (1.03–1.52) 0.03
4 550 30.0 1.04 (0.85–1.28) 0.7
5 590 33.0 0.98 (0.78–1.25) 0.9
doi:10.1371/journal.pone.0152091.t002
Fig 1. Trends in smoking, heavy drinking, obesity (including overweight and obesity) and health insurance coverage.
average treatment effect of health insurance on control was -0.12 (-0.32 to 0.09, p-value 0.9) in total, -0.07 (-0.30 to 0.16, p-value 0.7) in urban areas and -0.05 (-0.41 to 0.30, p-value 0.6) in rural areas. Health insurance showed a positive effect only on treatment, people with health insurance had a 29% higher chance to receive hypertension treatment compared to those who do not have health insurance. The effect on awareness and control was not significant, which was consistent with the logistic regression results.
Among diagnosed hypertensives, health insurance increased the probability that they would receive treatment by 28.7% (95% CI: 10.6–46.7%, p-value 0.001) compared to propensity-matched individuals who were not covered by health insurance.
Table 3. Prevalence, awareness, treatment and control of hypertension.
Wave Prevalence Awareness Treatment Control
Frequency Proportion (95% CI) (%)
Frequency Proportion (95% CI) (%)
Frequency Proportion (95% CI) (%)
Frequency Proportion (95% CI) (%)
1991 1040 23.8 (22.5–25.1) 283 31.7 (28.7–34.9) 186 66.2 (60.3–71.7) 37 19.9 (14.4–26.4) 1993 117 29.9 (25.4–34.7) 25 24.5 (16.5–34.0) 18 72.0 (50.6–87.9) 4 22.2 (6.4–47.6) 1997 501 33.5 (31.1–36.0) 124 25.1 (21.3–29.1) 101 81.5 (73.5–87.9) 33 32.7 (23.7–42.7) 2000 229 31.5 (28.1–35.0) 89 39.4 (33.0–46.1) 71 79.8 (70.0–87.6) 18 25.4 (15.8–37.1) 2004 311 32.5 (29.6–35.6) 122 39.7 (34.2–45.5) 106 86.9 (79.6–92.3) 37 34.9 (25.9–44.8) 2006 133 31.7 (27.3–36.4) 55 41.4 (32.9–50.2) 46 83.6 (71.2–92.2) 13 28.3 (16.0–43.5) 2009 288 31.5 (28.5–34.7) 146 51.1 (45.1–57.0) 131 89.7 (83.6–94.1) 42 32.1 (24.2–40.8) Total 2619 28.3 (27.3–29.2) 844 34.6(32.7–36.5) 659 78.3(75.3–81.0) 184 27.9 (24.5–31.5)
doi:10.1371/journal.pone.0152091.t003
Fig 2. Trends in prevalence, awareness, treatment and control of hypertension.
Table 4. Characteristics of management outcomes.
Awareness Treatment Control
Odds ratio (95% CI) P-value Odds ratio (95% CI) P-value Odds ratio (95% CI) P-value
Age
35–44 1 NA 1 NA 1 NA
45–54 2.01 (1.37–2.95) <0.001 1.85 (0.61–5.62) 0.3 0.44 (0.20–0.96) 0.04
55–64 3.53 (2.39–5.22) <0.001 2.19 (0.77–6.26) 0.1 0.45 (0.22–0.95) 0.04
65–74 3.82 (2.51–5.80) <0.001 1.31 (0.46–3.70) 0.6 0.49 (0.22–1.07) 0.07
75 2.95 (1.82–4.79) <0.001 5.73 (1.05–31.30) 0.04 0.45 (0.18–1.13) 0.09
Wave
1991 1 NA 1 NA 1 NA
1993 0.80 (0.45–1.46) 0.5 2.12 (0.45–9.99) 0.3 0.73 (0.18–3.00) 0.6
1997 0.57 (0.40–0.81) 0.002 2.88 (0.92–9.00) 0.07 1.43 (0.74–2.80) 0.3
2000 1.18 (0.76–1.84) 0.5 4.47 (1.22–16.32) 0.02 1.82 (0.78–4.25) 0.2
2004 1.11 (0.77–1.62) 0.6 4.75 (1.36–16.58) 0.02 2.03 (1.04–4.00) 0.04
2006 1.23 (0.77–1.98) 0.4 3.85 (0.91–16.23) 0.07 1.21 (0.52–2.84) 0.7
2009 1.90 (1.28–2.82) 0.001 3.78 (1.14–12.59) 0.03 1.71 (0.88–3.34) 0.1
Gender
Male 1 NA 1 NA 1 NA
Female 1.35 (1.04–1.74) 0.02 1.18 (0.61–2.27) 0.6 0.79 (0.49–1.26) 0.3
Province
Liaoning 1 NA 1 NA 1 NA
Heilongjiang 1.27 (0.80–2.03) 0.3 0.87 (0.26–2.77) 0.8 3.19 (1.30–7.82) 0.01
Jiangsu 1.87 (1.26–2.78) 0.002 4.99 (1.28–19.54) 0.02 2.65 (1.22–5.79) 0.01
Shandong 1.08 (0.74–1.58) 0.7 1.82 (0.66–5.02) 0.2 1.95 (0.84–4.56) 0.1
Henan 1.01 (0.66–1.55) 0.9 3.97 (1.01–15.55) 0.05 2.48 (1.05–5.89) 0.04
Hubei 1.89 (1.21–2.97) 0.005 2.67 (0.78–9.15) 0.1 3.49 (1.41–8.630) 0.007
Hunan 1.45 (0.91–2.32) 0.1 2.40 (0.69–8.34) 0.2 3.65 (1.41–9.44) 0.008
Guangxi 1.58 (1.01–2.46) 0.04 3.63 (0.91–14.40) 0.07 4.05 (1.69–9.72) 0.002
Guizhou 1.55 (0.96–2.51) 0.08 1.96 (0.54–7.17) 0.3 2.79 (1.09–7.13) 0.03
Residency
Urban 1 NA 1 NA 1 NA
Rural 0.75 (0.60–0.95) 0.01 1.05 (0.58–1.91) 0.9 1.02 (0.68–1.56) 0.9
BMI
Normal 1 NA 1 NA 1 NA
Underweight 0.50 (0.29–0.84) 0.01 4.22 (0.66–26.86) 0.1 0.83 (0.28–2.48) 0.7
Overweight 1.39 (1.10–1.76) 0.005 1.57 (0.84–2.95) 0.2 0.62 (0.40–0.96) 0.03
Obesity 3.04 (2.07–4.45) <0.001 5.07 (1.29–19.84) 0.02 1.51 (0.89–2.58) 0.1
Smoke
No or used 1 NA 1 NA 1 NA
Current smoker 0.71 (0.54–0.93) 0.01 1.00 (0.50–2.01) 1 0.86 (0.50–1.46) 0.6
Alcohol use frequency
No 1 NA 1 NA 1 NA
No more than 2 times a week 0.92 (0.68–1.26) 0.6 1.19 (0.52–2.75) 0.7 0.81 (0.45–1.44) 0.5 More than 2 times a week 0.74 (0.54–1.02) 0.07 0.59 (0.24–1.44) 0.2 0.85 (0.43–1.67) 0.6 Have health insurance
No 1 NA 1 NA 1 NA
Yes 1.02 (0.79–1.31) 0.9 2.81 (1.22–6.46) 0.02 0.65 (0.40–1.07) 0.09
Education
Discussion
This is the first population-based study to assess trends in the management and control of hypertension using a household survey covering 19 years of rapid change in China, which used a similar sampling and data collection method for seven consecutive waves. Trends in preva-lence and management of hypertension were comparable in each wave, along with their risk factors, so the results are comparable over time and enable comparison of the periods before and after coverage of insurance increased. This is also the first study to estimate the treatment effects of health insurance on prevalence and management of hypertension in China using pro-pensity score matching.
Prevalence of hypertension reached about 30% after 1997, which is slightly higher than found in a cross-sectional study by Gao and colleagues in 2013 based on data collected from the 2007–2008 China National Diabetes and Metabolic Disorders Study. [10] This may be because of different definitions of hypertension in these two studies. Our method of defining hypertension was slightly less restrictive than that of Gao and colleagues, and may give increased prevalence estimates relative to their findings.
According to the latest Chinese guidelines for the management of hypertension, the preva-lence of hypertension has significantly increased over time. [3] However, in this study, the time trend remains stable, which may be explained in two ways. First, the data used in the 2010 Chi-nese guidelines came from four surveys, with different study populations, methods and defini-tions. Second, we only used new participants in the CHNS, who have a similar age structure in each wave. Since age is the most important determinant of prevalence, similar age structures may result in a non-significant time trend while in other surveys, the age structure is changing in the study sample along with the aging process nationwide.
Consistent with previous studies, elderly men were at higher risk of hypertension, and obe-sity and heavy drinking had a strong positive effect on prevalence of hypertension. [4] People with middle incomes were more likely to have hypertension, which may be attributed to their lifestyles. The CHNS study does not include comprehensive information on salt intake, but according to previous studies, salt is widely used in home cooking in China. [11] Daily salt intake is generally higher in northern areas, and more than 80% of residents take salt in excess of dietary recommendations. [12] Unobserved differences in salt intake may explain regional or wealth-based differences in hypertension in this study. Smoking rates slightly decreased over time in this study, consistent with previous national surveys. [13] Also, consistent with
Table 4. (Continued)
Awareness Treatment Control
Odds ratio (95% CI) P-value Odds ratio (95% CI) P-value Odds ratio (95% CI) P-value
No graduated from primary school 1 NA 1 NA 1 NA
Graduated from primary school 1.58 (1.16–2.15) 0.003 1.39 (0.61–3.14) 0.4 0.81 (0.45–1.45) 0.5 Graduated from middle or school 1.52 (1.11–2.09) 0.009 0.80 (0.34–1.88) 0.6 1.51 (0.85–2.69) 0.2 Tertiary education 1.85 (1.19–2.86) 0.006 2.88 (0.74–11.31) 0.1 1.59 (0.78–3.26) 0.2 Quintiles of income
1 1 NA 1 NA 1 NA
2 0.89 (0.60–1.31) 0.6 0.88 (0.33–2.32) 0.8 1.39 (0.59–3.29) 0.5
3 0.97 (0.69–1.37) 0.9 1.32 (0.54–3.25) 0.5 1.16 (0.55–2.46) 0.7
4 1.12 (0.79–1.60) 0.5 1.09 (0.45–2.64) 0.8 1.82 (0.90–3.65) 0.1
5 0.98 (0.66–1.45) 0.9 1.52 (0.52–4.49) 0.4 1.56 (0.73–3.32) 0.3
previous studies, the prevalence of overweight and obesity in our study increased rapidly with rapid development in the economy and living standards in China. [14]
The awareness rate increased over time, and in the 2009 wave half of people who had hyper-tension were diagnosed. Although elderly and overweight people had greater awareness of their hypertensive status, the rate of awareness among these groups is still low given their much higher risk of hypertension. People living in rural areas and with lower education levels are less likely to be aware of their hypertension. This may be because these people lack the resources to obtain hypertension knowledge. Health education programs for elderly and rural populations may be effective ways to promote awareness of hypertension. [15] Differences in hypertension awareness between rural and urban areas may also relate to different types of health insurance targeting different populations. For instance, the New Rural Cooperative Medical Scheme (NCMS) covers people in rural areas while the Urban Resident/Employee Basic Medical Insurance covers people in urban areas. Our results indicate that there might be some inequity between urban and rural health insurance packages in early diagnoses of hyper-tension. Inequities in service utilization and health outcomes between urban and rural areas have been reported, especially in 1990s. [16]
Treatment rates amongst those diagnosed with hypertension increased to around 90% by 2009. However, among people receiving medication, the proportion of people who have actu-ally achieved control of their hypertension was only 30%. This situation of low control of hypertension is consistent with previous studies both in China and other countries, which found limited hypertension-related knowledge, ignorance of non-pharmacological treatments, unsatisfactory medication adherence, and inappropriate medical treatment all limited the effectiveness of treatments. [3,17,18]
Although elderly people were at higher risk of hypertension, they were less likely to have controlled hypertension. This may be because systolic hypertension due to age-related factors such as arteriosclerosis was common among elderly people. [19] Previous studies have shown that it is more difficult to control systolic blood pressure than diastolic blood pressure, and combinations of two or more antihypertension drugs are required for effective treatment. [20] Also, inequalities in hypertension prevalence and management were found across provinces, which may be due to variation in lifestyles, dietary habits, health treatment costs, insurance reimbursement levels, and health promotion programs between different areas. However, there was not enough information about health policies and programs implemented at the sub-national levels, and more information and surveys are needed to explain this variation. Since prevention and management of hypertension are national health promotion goals, the inequal-ities across provinces indicate that stronger national-level monitoring and guidelines may be necessary to achieve national goals for hypertension control programs and policies.
Although increased health insurance coverage was significantly associated with increased levels of treatment, we found little effect of health insurance on control of hypertension. Some longitudinal studies in the US have shown a positive effect of health insurance on awareness and control of hypertension as well as drug adherence. [21] At the individual level, better health knowledge has been shown to be effective in promoting medication adherence and blood pressure control. [22] These findings indicate that there may be problems with the qual-ity of treatment being received, access to drugs or adherence to management guidelines, together with personal health-seeking behavioral factors in China.
affect medication adherence since previous studies have shown a positive association between lower cost of medication and better medication adherence. [25]
Although primary health centers have been proven effective in early diagnosis and manage-ment of hypertension, there are no systematic guidelines and rules for hypertensive case man-agement at the community level in China, which may lead to low medication adherence among hypertensive patients. Some community-level studies conducted in China have shown that adherence with drug regimens is lower than 50%. [26] Regular health checks and blood pressure tests are not implemented or included in the health insurance package nationally, although some studies have shown their effectiveness in early diagnosis and management of hypertension. [27]
The main limitation of this study is that no probability sampling information is available in the CHNS. [7] This will affect the accuracy of trend analysis, but has little effect on logistic regression analysis since we used sub-samples instead of the whole sample, and merged samples in different waves, making it impossible to apply sampling weights even where they are avail-able. Provinces involved in this study were mostly located in the northeast and middle part of China, so there were no samples from the richest and poorest provinces. However, the nine provinces chosen in this study range from the wealthiest to the poorest five, and may be rela-tively representative of the national income distribution. [28] Another limitation is lack of infor-mation about the method used to measure blood pressure, which may vary by wave and district. We did not include the types of health insurance in our models because the proportion of miss-ing data on this information is too high. Also the variables we used in this study are not compre-hensive, and other unobserved characteristics such as physical activity could also effect the management of hypertension. Last but not least, there is no detailed information on the meth-ods used to recruit new participants in the CHNS, so the new households added in the sample units might not be randomly selected, although these new units should be randomly selected.
This study suggests that China’s health insurance system has been effective in increasing hypertension treatment but that more needs to be done to improve effective coverage of hyper-tension control. Primary health care center involvement in health education, regular commu-nity-based screening, especially for high risk populations such as elderly men, and promotion of medication adherence should be considered where these interventions can be shown to be cost-effective. Also, lifestyle interventions such as reducing daily salt intake that have been proven effective in reducing blood pressure in Japan, [29] should also be considered in China. By improving public health and preventive measures in the current health insurance package, the Chinese government can act early and effectively to prevent the most serious consequences of this challenging and growing non-communicable disease epidemic.
Supporting Information
S1 Appendix. Detailed information and explanation on propensity score matching. (PDF)
S1 Fig. Trends in age-standardized prevalence of hypertension. (PDF)
S1 Tables. Age, gender and residency distribution over time. (PDF)
Acknowledgments
Culture, Sports, Science and Technology (Grant-in-aid for scientific research A, grant number 22390130). The funders had no influence over the content of the research or the decision to publish. We are grateful to the National Institute of Nutrition and Food Safety, China Center for Disease Control and Prevention, Carolina Population Center, the University of North Carolina at Chapel Hill, the NIH (R01-HD30880, DK056350, and R01-HD38700) and the Fogarty International Center, NIH for financial support for the CHNS data collection and anal-ysis files from 1989 to 2006 and both parties plus the China-Japan Friendship Hospital, Minis-try of Health for support for CHNS 2009 and future surveys.
Author Contributions
Conceived and designed the experiments: SG. Performed the experiments: YL. Analyzed the data: YL SG. Wrote the paper: YL. Revised the manuscript: SG KS YL.
References
1. Institute for Health Metrics and Evaluation. GBD Arrow Diagram 2013. Available from:http://www. healthmetricsandevaluation.org/gbd/visualizations/gbd-arrow-diagram.
2. Yang G, Kong L, Zhao W, Wan X, Zhai Y, Chen LC, et al. Emergence of chronic non-communicable dis-eases in China. Lancet. 2008; 372(9650):1697–705. doi:10.1016/S0140-6736(08)61366-5PMID:
18930526
3. Liu LS, Writing Group of Chinese Guidelines for the Management of Hypertension. [2010 Chinese guidelines for the management of hypertension]. Zhonghua Xin Xue Guan Bing Za Zhi. 201139 (7):579–615.
4. Lei XY, Yin NN, Zhao YH. Socioeconomic status and chronic diseases: The case of hypertension in China. China Economic Review. 2012; 23(1):105–21.
5. Parry J. Nine in 10 Chinese are covered by medical insurance, but access to treatment remains a prob-lem. BMJ. 2012; 344:e248. doi:10.1136/bmj.e248PMID:22232545
6. Li JX, Liang XH, Cao J, Zhu K, Deng Y, Zhou ZY, et al. [Current status and urban-rural comparison of clinical agency of detection, management, and health insurance for hypertensive patients in communi-ties of five provinces in China in 2010]. Zhonghua Yu Fang Yi Xue Za Zhi. 2013; 47(4):301–5. PMID:
23928633
7. Popkin BM, Du S, Zhai F, Zhang B. Cohort Profile: The China Health and Nutrition Survey—monitoring and understanding socio-economic and health change in China, 1989–2011. International journal of epidemiology. 2010; 39(6):1435–40. doi:10.1093/ije/dyp322PMID:19887509; PubMed Central PMCID: PMC2992625.
8. World Bank. Official exchange rate. Available from:http://data.worldbank.org/indicator/PA.NUS.FCRF. 9. Ho DE, Imai K, King G, Stuart EA. Matching as Nonparametric Preprocessing for Reducing Model
Dependence in Parametric Causal Inference. Political Analysis. 2007; 15(3):199–236.
10. Gao Y, Chen G, Tian H, Lin L, Lu J, Weng J, et al. Prevalence of hypertension in china: a cross-sec-tional study. PLoS One. 2013; 8(6):e65938. doi:10.1371/journal.pone.0065938PMID:23776574; PubMed Central PMCID: PMC3679057.
11. Anderson CA, Appel LJ, Okuda N, Brown IJ, Chan Q, Zhao L, et al. Dietary sources of sodium in China, Japan, the United Kingdom, and the United States, women and men aged 40 to 59 years: the INTER-MAP study. J Am Diet Assoc. 2010; 110(5):736–45. doi:10.1016/j.jada.2010.02.007PMID:20430135; PubMed Central PMCID: PMC4308093.
12. Stamler R, Liu LS, Nichols R, Huang DX, Long ZP, Xie JX, et al. Blood pressure and life style in the People's Republic of China: three samples in the INTERSALT Study. J Hum Hypertens. 1993; 7 (5):429–35. PMID:8263882.
13. Li L, Chen QL, Jia RX, Cui X. [The Smoking Pattern and Disease Burden of Tobacco Use in China]. Chinese Health Economics. 2008; 27(1):26–30.
14. Ma JS, Li YP, Wu YF, Zhai FY, Cui ZH, Hu XQ, et al. [The prevalence of body overweight and obesity and its changes among Chinese people during 1992 to 2002]. Chinese Journal of Preventive Medicine. 2005; 39(5):311–5. PMID:16266539
16. Barber SL, Yao L. Health insurance systems in China: A briefing note. World Health Report. 2010;Back-ground Paper(37):1–27.
17. Bramlage P, Bohm M, Volpe M, Khan BV, Paar WD, Tebbe U, et al. A global perspective on blood pres-sure treatment and control in a referred cohort of hypertensive patients. J Clin Hypertens (Greenwich). 2010; 12(9):666–77. doi:10.1111/j.1751-7176.2010.00322.xPMID:20883226.
18. Ikeda N, Sapienza D, Guerrero R, Aekplakorn W, Naghavi M, Mokdad AH, et al. Control of hyperten-sion with medication: a comparative analysis of national surveys in 20 countries. Bulletin of the World Health Organization. 2014; 92(1):10–9C. doi:10.2471/BLT.13.121954PMID:24391296; PubMed Cen-tral PMCID: PMC3865548.
19. Izzo JL Jr., Levy D, Black HR. Clinical Advisory Statement. Importance of systolic blood pressure in older Americans. Hypertension. 2000; 35(5):1021–4. PMID:10818056.
20. Black HR, Elliott WJ, Neaton JD, Grandits G, Grambsch P, Grimm RH Jr., et al. Baseline Characteris-tics and Early Blood Pressure Control in the CONVINCE Trial. Hypertension. 2001; 37(1):12–8. PMID:
11208750.
21. Duru OK, Vargas RB, Kermah D, Pan D, Norris KC. Health insurance status and hypertension monitor-ing and control in the United States. Am J Hypertens. 2007; 20(4):348–53. doi:10.1016/j.amjhyper. 2006.11.007PMID:17386339.
22. Song Y, Ma W, Yi X, Wang S, Sun X, Tian J, et al. Chronic diseases knowledge and related factors among the elderly in Jinan, China. PLoS One. 2013; 8(6):e68599. doi:10.1371/journal.pone.0068599
PMID:23826394; PubMed Central PMCID: PMC3691150.
23. Yip W, Hsiao WC. Non-evidence-based policy: How effective is China’s new cooperative medical scheme in reducing medical impoverishment? Social Science & Medicine. 2009; 68(2):201–9. 24. Sun Q, Liu X, Meng Q, Tang S, Yu B, Tolhurst R. Evaluating the financial protection of patients with
chronic disease by health insurance in rural China. Int J Equity Health. 2009; 8:42. doi: 10.1186/1475-9276-8-42PMID:20003188; PubMed Central PMCID: PMC2799402.
25. Hagihara A, Murakami M, Chishaki A, Nabeshima F, Nobutomo K. Rate of health insurance reimburse-ment and adherence to anti-hypertensive treatreimburse-ment among Japanese patients. Health Policy. 2001; 58 (3):231–42. PMID:11641001
26. Xiao HM, Jiang XY. [Drug compliance of elderly patients with hypertension]. Chinese Journal of Clinic Rehabilitation. 2005; 31(9):30–1.
27. Beaglehole R, Epping-Jordan J, Patel V, Chopra M, Ebrahim S, Kidd M, et al. Improving the prevention and management of chronic disease in low-income and middle-income countries: a priority for primary health care. Lancet. 2008; 372(9642):940–9. doi:10.1016/S0140-6736(08)61404-XPMID:18790317. 28. Ma JT. China statistical yearbook 2012. Beijing: China Statistics Press; 2012.