www.ann-geophys.net/27/4097/2009/
© Author(s) 2009. This work is distributed under the Creative Commons Attribution 3.0 License.
Annales
Geophysicae
SMEI direct, 3-D-reconstruction sky maps, and volumetric analyses,
and their comparison with SOHO and STEREO observations
B. V. Jackson, P. P. Hick, A. Buffington, M. M. Bisi, and J. M. Clover
Center for Astrophysics and Space Sciences, University of California, San Diego, 9500 Gilman Drive #0424, La Jolla, 92093-0424 CA, USA
Received: 15 June 2009 – Revised: 2 October 2009 – Accepted: 23 October 2009 – Published: 2 November 2009
Abstract. In this paper we present the results of the analy-sis of the late January 2007 Coronal Mass Ejection (CME) events recorded by the Solar Mass Ejection Imager (SMEI), the Solar TErrestrial RElations Observatory (STEREO), and the SOlar and Heliospheric Observatory (SOHO) spacecraft. This period occurs when the two STEREO spacecraft views are from close to Earth, and thus the views from both SMEI and the STEREO outer Heliospheric Imagers (HI-2s) coin-cide. Three-dimensional (3-D) analyses derived from SMEI data show many CMEs that have also been studied by oth-ers using short-term image subtractions (image-differencing techniques). During this interval we map several CME struc-tures that are observed in both SMEI and the STEREO-A HI instruments. SMEI brightness analyses provided by short-term image subtractions (“difference images”) and, alterna-tively, subtractions of a mean-brightness fit over a long-time duration, both show the extents of the CMEs travelling out-ward above the East limb that erupted from the Sun on 24 and 25 January 2007. The SMEI 3-D-reconstructions not only enhance distinct features within the CME events, but also reconcile difference-imaging results with those where a long-term base has been removed. In the January 2007 exam-ple the structure as mapped by CME difference images traces the sharp intensity gradients at the front of the CMEs; gen-erally brighter ejected material follows behind the location of the CME front, but shows poorly in these because of its larger angular extent. Using the long-duration background removal enables SMEI’s 3-D analysis to determine a mass for this CME sequence North of the ecliptic.
Keywords. Interplanetary physics (Flare and stream dynam-ics; Interplanetary shocks) – Solar physics, astrophysics, and astronomy (Flares and mass ejections)
Correspondence to:B. V. Jackson ([email protected])
1 Introduction
In this article we use the 24–25 January 2007 coronal mass ejection (CME) event sequence to highlight observations and three-dimensional (3-D) results obtained from the So-lar Mass Ejection Imager (SMEI) (Eyles et al., 2003; Jack-son et al., 2004). The SMEI instrument is well into its sixth year, recording 0.1% photometric-quality data cover-ing nearly the entire sky each 102-min orbit. SMEI direct white-light images are available at the University of Cali-fornia, San Diego (UCSD) from early February 2003 to the present on the Website: http://smei.ucsd.edu/. In addition, this Website includes higher-level products from SMEI 3-D-reconstructed volumetric data such as ecliptic and meridional cuts, remote observer views, and Sun-centred fisheye and Hammer-Aitoff projections. The “broad brush” approach to the volumetric analyses provided on the UCSD Website shows both CMEs and corotating structures in 3-D, and pro-vides animations and individual images of CMEs that have been studied by others using image-differencing techniques. Data from SMEI are of particular interest now that the So-lar TErrestrial RElations Observatory (STEREO) spacecraft (Kaiser et al., 2008) are launched and returning data. Starting with Carrington rotation (CR) 2054 in April 2007, the Web-site includes the location of the twin STEREO spacecraft in ecliptic cuts of the higher-resolution reconstruction analyses. SMEI sky maps are produced from a composite of 4-s ex-posure 3◦
×60◦
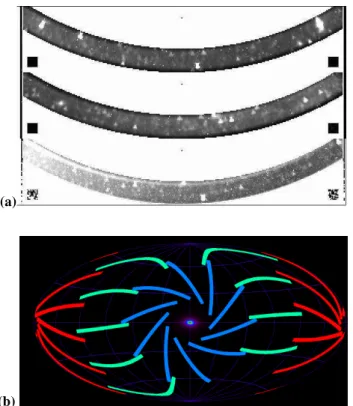
images from each of the three cameras on board the Coriolis spacecraft (see Fig. 1). The sky maps provide Thomson-scattering data with minimal stray light as close as 20◦
elongation to the Sun and as distant from it as 180◦
(b)
Fig. 1. (a)3◦×60◦ image frames from each of the three SMEI
cameras. Camera 1 (top) views farthest from the Sun; and cam-era 3 (bottom) closest, with the Sun towards the left in each frame. (b)Full-sky Hammer-Aitoff projection showing the placement of a sample of SMEI camera image frames with the Sun centred in the projection (in October). About 4500 frames per orbit fill in the sky in a clockwise direction every 102 min. Camera 1 is shown in red, camera 2 is in green, and camera 3 is in blue.
To reduce long-term brightness variations in SMEI data, a zodiacal-light model has been derived from these data (Hick et al., 2005; Buffington et al., 2009) and removed from them. The data are then fitted at each chosen sidereal location with a long-term Gaussian filter that provides a temporal base with a time constant of several hundred orbits (about 2 weeks). The selected sidereal locations are free of known bright stars, and have high-energy particle hits and auroral light edited and removed from the time series. For more information about this procedure see Jackson et al. (2008).
We have overcome several SMEI data-analysis problems including an unexpectedly hot camera 3. For this, by employ-ing a processemploy-ing procedure whereby a dark-current pattern updated every orbit is subtracted from the original 3◦
×60◦
image data, most of the 0.1% photometric specification can be recovered. This procedure has led to a pronounced en-hancement in the quality of SMEI sky maps near the Sun, and this is important in the current context since it allows viewing as near as possible to the Sun, and hence structures that move outward from the solar limbs and even away from the Earth. For the other two cameras, SMEI performs to its
The primary focus of the UCSD analyses has been three-dimensional (3-D) reconstructions and modelled 2-D images from selected time periods (e.g., Jackson et al., 2004, 2006, 2008; Webb et al., 2009a). However, the SMEI team also produces significant scientific results directly from the 2-D sky map orbit differences (e.g., Tappin et al., 2004; Reiner et al., 2005; Tappin, 2006; Webb et al., 2006, 2009b; Tappin and Howard, 2009).
2 Data sets used and the comparison of the 24–25 Jan-uary 2007 CME sequence
We show measurements obtained from SMEI difference im-ages, and the STEREO Sun–Earth Connection Coronal He-liospheric Investigation (SECCHI) instrument suite (Howard et al., 2008). SECCHI provides the means for continuous observations of CMEs from the Sun to Earth. The field of view from the SECCHI Heliospheric Imagers (HIs) (Eyles et al., 2009) is limited in latitude; SMEI has an all-sky imag-ing capability outward from 20◦
elongation. Here as an ex-ample, we show a comparison of image differencing tech-niques for a specific CME event sequence that erupted from the solar East limb on 24 and 25 January 2007. At this time close to the launch of the twin STEREO spacecraft in Octo-ber 2006, the perspective views from SMEI and STEREO are the approximately the same, and both SMEI and HI-A image differencing techniques have been shown to pro-vide approximately the same location and morphology of this CME sequence in the ecliptic plane from both instruments as it moves outward from the Sun (e.g., Webb et al., 2009a). These CMEs were also viewed and measured nearer the so-lar surface by the Large Angle Spectrographic Coronagraphs (LASCO) (Brueckner et al., 1995) on board the SOlar and Heliospheric Observatory (SOHO) spacecraft (Domingo et al., 1995) nearer the solar surface.
As in many CME-event sequences, because of data out-ages and incomplete coverage in both the SMEI and HI in-strumentation, it is difficult to discern the true extent of the CME sequence and to connect the portions of it in position angle (PA) that progress outward across the sky. In earlier
(a) (b)
ted
ed
lot.
U
here
at
onal
Fig. 2. Ecliptic and meridional cuts of the 24–25 January 2007 CME at the time indicated when the main portions of the CMEs have coalesced in the ecliptic plane and have reached 1 AU East of the Sun. The Earth is marked “⊗” and the Sun a “+” in the centre of each plot. Densities are given in protons (in cm−3) and are normalised to the measurements at 1 AU taking anr−2fall-off in the density into account.
The areas to the left in each image where fewer than 10 lines of sight cross are left blank as on the UCSD Website at http://smei.ucsd.edu/. (a)Ecliptic cut showing the Earth orbit as an ellipse. (b)Meridional cut showing the Earth and its orbit as a horizontal line terminating at the Earth.
studies of the 24–25 January 2007 CME event sequence (e.g., Webb et al., 2009a) only piecemeal portions of the events are shown as they move outward from the Sun and/or the elon-gation of the events mapped on direct images do not match well with measurements of them where a long duration base has been subtracted from the brightness data in UCSD 3-D reconstructions. In this paper for the first time we provide difference images of this event sequence from the UCSD 3-D reconstructions in order to provide measurements of the fronts of the CMEs as determined using direct image differ-encing techniques. We also show how the SMEI measure-ments of 3-D CME mass obtained by removing a long-term temporal base from the brightness data compare with values of mass obtained for this CME event sequence using LASCO C3 coronagraph observations.
3 The UCSD 3-D-reconstruction technique
The UCSD 3-D-reconstruction technique with our standard kinematic model has been used to determine global 3-D den-sities and velocities in the inner heliosphere using a time-dependent model since 1999 (Jackson et al., 2001). Given the velocity and density of an inner boundary (the “source sur-face”), a 3-D-solar-wind model best fitting the observations is calculated, assuming radial outflow and enforcing conser-vation of mass and mass flux (Jackson et al., 1998). Best fit is achieved iteratively. If the line-of-sight integrations of 3-D solar wind at large solar distances do not match the overall observations, the source-surface values are modified and the deviations reduced to a desired small value. Extensive study
of this process has shown that the final iterated values are insensitive to the starting values on the source surface.
This technique has been used to analyse CME-associated structures using interplanetary scintillation (IPS) and SMEI Thomson-scattering observations (e.g., Jackson and Hick, 2005). Different Gaussian filters are used for the two data sets of SMEI and IPS that limit the size of structures ob-served to a larger volumetric shape than the digital resolution (see Jackson and Hick, 2005; Jackson et al., 2006).
s i
and
un t
n b
E
par
ola
h
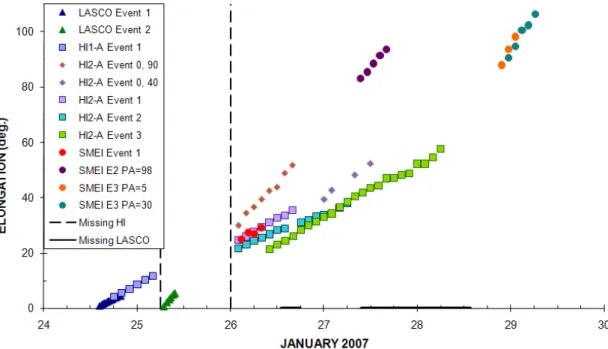
Fig. 3.Elongation-time plot from Webb et al. (2009a) showing a variety of structures in late-January 2007, measured by image-differencing techniques using STEREO HI-1A and HI-2A and SMEI observations for the CMEs mapped from near the surface of the Sun to beyond 90◦elongation. Some portions of the same CME structure overlap and can be measured in both HI-1A and SMEI. Pertinent here are the structures SMEI E2 PA=98◦, SMEI E3 PA=5◦, and SMEI E3 PA=30◦, which were effectively measured using SMEI imaging-difference
techniques. In the 3-D-reconstruction analyses these are shown to be part of the same large loop structure that has not advanced to as large an elongation to the solar North as it has to the solar East.
and that SMEI obtains the proper density using these 3-D reconstructions. The SMEI website currently provides the higher-level 3-D data analyses using this conversion from electron to proton densities in order to better match the in-situ density values measured by spacecraft.
4 Comparison of remote-sensing images and 3-D-reconstructions: SMEI and STEREO
Difference images from SMEI and from the STEREO HI-2A instrument (Howard et al., 2008; Eyles et al., 2009) gener-ally look different and show different structures from those in SMEI where a long-term temporal base averaged from weeks of data has been subtracted. For SMEI, the long-term tem-poral base subtraction requires strict maintenance of stray-light levels and careful removal of background sources of light such as the zodiacal light and stars. This allows the changing CME brightness above a mean level to be deter-mined. Thus these brightness measurements can be directly related to bulk density above the ambient solar wind density that itself can be accurately modelled by comparison with in-situ measurements (Jackson et al., 2001, 2008; Jackson and Hick, 2005). This allows display of the volumes in terms of bulk density, and these are shown on the UCSD Website as ecliptic or meridional cuts of the volumes as shown in Fig. 2 for the 24–25 January 2007 CME event sequence.
In a recent article Webb et al. (2009a) show elongation-time plots of the 24 and 25 January CME sequence (Fig. 3), and trace these observations in the SMEI and STEREO in-ner Heliospheric Imager (HI-1) and HI-2 difference image data. These show structures in intermittent direct different images from the STEREO HIs and SMEI to the West and North that reach 90◦
elongation and beyond. For details of how the SMEI difference imaging is accomplished, used in these earlier analyses, and in further applications see Kuchar et al. (2008). The long-term analyses from the SMEI data cleaned of auroral light and high-energy particle hits and fit using the UCSD solar wind 3-D-reconstruction analysis re-veals these structures to be large loops, consistent with their shapes indicated by the various modelling techniques de-scribed in Webb et al. (2009a).
The difference between using an image with a long-term base subtracted and one where difference images are used is demonstrated in Fig. 4. Figure 4 shows 3-D-reconstructed fisheye images of the sequence of CMEs during late January 2007. To the North, these loop events are well-defined, but to the South they overlap and coalesce where their images are further complicated by light from the dust and plasma of Comet McNaught (C/2006 P1). By differencing 3-D-reconstructed volumes 12 h apart, we show in Fig. 4b and d that the fronts of the CMEs are enhanced, and that the locations of these fronts are more-closely related to SMEI
(a)
(b)
(c)
(d)
he
units
ch
3D
es
2007
ned
s.
ht
om
Fig. 4.3-D-reconstructed Sun-centred fisheye sky maps to 110◦elongation showing the outward progression of several CMEs during 27–28January 2007. Brightness in S10 units (tenth magnitude solar-type stars in a square degree of sky) is shown to the left of each image. An
r−2density fall-off has been removed here to show the structures.(a)and(c)3-D image reconstruction with a long-term base removed. The
outer-loop composite that reaches to∼60◦elongation East of the Sun in (a) is associated with CMEs on 24 and 25 January 2007 (Webb et al., 2009a).(b)and(d)Fisheye “difference images” as in (a) and (c) obtained after subtracting the 12-h-preceding density volumes from the current volumes. Difference images tend to emphasize the smaller-scale structures. These sky maps highlight the loop fronts of (a) and (c). In particular, the loop front at 90◦elongation to the North from 5◦to 30◦PA in (d) is at the approximate elongation of the structure measured
at these same PAs in SMEI image differences with a shorter-term base removed.
orbit-to-orbit difference images. The generally brighter ejected material of the CMEs follows behind the location of the CME fronts.
5 CME mass
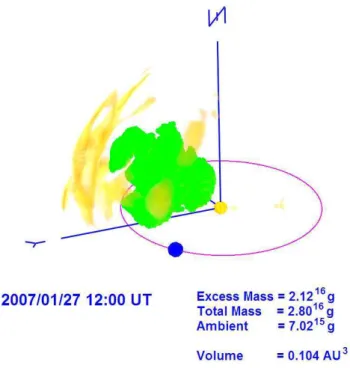
With these events now reconstructed fully in three dimen-sions, we are also able to determine their interplanetary mass (see Fig. 5) as in Jackson et al. (2006, 2008). These measure-ments provide far more precise 3-D masses for individual
the
m
N
vol
ma
a
Fig. 5.Estimates of 3-D mass for the composite CME structure to the north of the ecliptic for the 24–25 January 2007 CME sequence on 27 January 2007 at 12:00 UT. Earth is shown as the blue dot, on its orbit mapped as a purple ellipse. The volumetric material within the 15Npcm−3contour interval is approximated by cubesand summed (shown in green) to obtain the result. The values of excess, total, and ambient mass, and the volume highlighted are shown in the figure caption. Portions of pre-existing heliospheric material not connected with the CME structure appear in yellow to the Northeast. Other non-associated material to the South and West of the Sun-Earth line has been removed for clarity of viewing.
events, and also a consistency check to ensure that the CME material observed by SMEI agrees with measurements from other instruments. For the 24 and 25 January 2007 event sequence, the SMEI 3-D analysis measures several CMEs propagating outward that are difficult to separate in 2-D im-ages or 3-D volumes. To the North of the ecliptic, the total mass is a composite of CME material within a 15NP cm−3 contour level and is 2.8×10¹⁶g. We have chosen this contour level such that the composite CME to the North is separated from other structure. Differentiation of this northern struc-ture into individual event components is possible, but only by selecting a higher contour level to further isolate event fea-tures. If this is done, the material below the higher contour level does not include intervening (supposedly merged) ma-terial from the separate CMEs. The volume enclosed by this event sequence to the North within the 15NP cm−3contour level is∼0.10 AU3at 12:00 UT 27 January 2007. Within this contour level the modelled ambient mass (7.0×10¹⁵g) of the solar wind comprises about 25% of the total CME mass. No attempt to estimate mass to the South of the ecliptic plane was made because of the uncertainty in the background con-tribution of dust from comet McNaught.
ditionally influenced in the ecliptic by corotating structures that contribute to the brightness differences observed in the HI-2A instrument. Indeed a portion of the mass observed in the SMEI analyses on 27 January in Fig. 5 could be at-tributed to corotating solar wind features, However, we note that very little of the bulk of mass is observed to corotate in our ecliptic-cut analysis of this event even though the 3-D-reconstruction analysis can (and often does) show corotation in these ecliptic cuts.
These SMEI analyses can be used to estimate a kinetic en-ergy for the CME outward flow. Because no IPS velocity data are available for the time period covered by these recon-structions, as in the case of the events measured by Jackson et al. (2006, 2008), kinetic energy for this event is estimated by assuming a constant velocity for the whole of the CME structure. We generally assume a velocity of the material near 1 AU of 400 km s−1(the ambient mean for solar wind
velocity structure). This velocity implies a1/
2mv2 kinetic
energy of 2.2×1031erg associated with the total mass out-ward flow for the northern part of this event sequence. Since no attempt was made to determine CME mass to the South of the ecliptic plane for this event because of the uncertain dust contribution from comet McNaught, we likewise do not estimate the energy associated with this portion of the CME.
6 Conclusions
Many of these SMEI analyses shown in this paper can be found on the UCSD Website at: http://smei.ucsd.edu/ for the entire six plus years of SMEI data. These include re-sults from 3-D-reconstructed volumetric data such as eclip-tic and meridional cuts, remote-observer views, and Sun-centred fisheye and Hammer-Aitoff projections. In this pa-per we have presented observations and analyses of SMEI, STEREO and LASCO data from the 24–25 January 2007 CME sequence. During this period, the STEREO space-craft views are aligned approximately with those from SMEI. Using difference images, several CME structures that have been mapped outward in Webb et al. (2009a) coincide in both the HI-2A and SMEI observations, but in this analysis
the elongation-time plots of Fig. 3 show structures that are mapped primarily as differently-directed separate entities. In the SMEI 3-D reconstructions shown in Sect. 4, structure locations are determined either by short-term 12-h subtrac-tions, or by subtracting a mean brightness fit over a long-time duration. SMEI 3-D reconstructions show the CMEs as gi-ant loop-like structures that extend from the North of the Sun and far to the South. This is consistent with model results from Lugaz et al. (2008), HAF-model estimates (Hakamada and Akasofu, 1982; Fry et al., 2001, 2003), and ENLIL-model simulations (e.g., Odstrcil et al., 2003) shown in Webb et al. (2009a), all of which show a similar loop-like struc-ture for the CME response. We show in this case that the structures mapped by difference images primarily follow the sharp intensity gradients at the front of the CMEs, something not evident in the reconstructed images that are not differ-enced. This agrees with the short-term difference images obtained from SMEI towards the solar North used to pro-vide elongation-time plots in Webb et al. (2009a). Since we have measurements relative to a long term base from our cal-ibrated SMEI analysis we are able to determine estimates of the 3-D total and excess mass for this CME sequence in the North heliospheric hemisphere. With the caveat that we have defined the volumetric material for the CMEs to exist within a 15NP cm−3contour interval, we find values of 2.1×10¹⁶g and 2.8×10¹⁶g for excess and total CME mass respectively for this CME event sequence to the North. The excess mass determined for the CME sequence agrees roughly with that measured using LASCO C3 difference images for this event. The total CME mass and an estimate of the outward motion of the CME give a kinetic energy associated with the CME sequence to the North of 2.2×1031erg.
Acknowledgements. We thank D. F. Webb of Boston College, USA for a careful reading of the initial manuscript, and the SMEI team for providing continuing data acquisition from the SMEI instru-ment. We also thank C. Eyles of the University of Birming-ham, UK, for SECCHI HI data, J. Davies of the Rutherford Ap-pleton Laboratory (RAL), UK for HI image processing, and V. Kunkel of the Naval Research Laboratory (NRL), Washington D.C., USA for SECCHI distance – time measurements used in initial comparisons. SMEI was designed and constructed by a team of scientists and engineers from the US Air Force Research Lab-oratory, the University of California at San Diego, Boston Col-lege, Boston University, and the University of Birmingham, UK. The STEREO/SECCHI project is an international consortium of NRL (USA), Lockheed Martin Solar and Astrophysics Lab (USA), NASA Goddard Space Flight Center (USA), RAL (UK), Univer-sity of Birmingham (UK), Max-Planck-Institut f¨ur Sonnensystem-forschung (Germany), Centre Spatial de Li`ege (CSL) (Belgium), Institut d’Optique Th´eorique et Appliqu´ee (France), and Institut d’Astrophysique Spatiale (France). The SECCHI HI instruments were developed by a collaboration that included the University of Birmingham, RAL, CSL, and NRL. The work of B. V. Jackson, A. Buffington, P. P. Hick, and J. M. Clover was supported at the Uni-versity of California, San Diego by NSF grant ATM-0331513 and NASA grants NAG5-134543 and NNG05GG45G. Post-doctoral
fellow M.M. Bisi was supported in part by AFOSR grant FA9550-06-1-0107 and NASA grant NNG05GG45G.
Topical Editor R. Forsyth thanks N. Srivastava and another anonymous referee for their help in evaluating this paper.
References
Bisi, M. M., Jackson, B. V., Hick, P. P., Buffington, A., Odstrcil, D., and Clover, J. M.: 3D Reconstructions of the Early-November 2004 CDAW Geomagnetic Storms: Analyses of STELab IPS Speed and SMEI Density Data, J. Geophys. Res., 113, A00A11, doi:10.1029/2008JA013222, 2008.
Brueckner, G. E., Howard, R. A., Koomen, M. J., Korendyke, C. M., Michels, D. J., Moses, J. D., Socker, D. G., Dere, K. P., Lamy, P. L., Llebaria, A., Bout, M. V., Schwenn, R., Simnett, G. M., Bedford, D. K., and Eyles, C. J., The Large Angle Spectro-scopic Coronagraph (LASCO): visible light coronal imaging and spectroscopy, Solar Phys., 162, 357–402, 1995.
Buffington, A., Band, D. L., Jackson, B. V., Hick, P. P., and Smith, A. C.: A Search for Early Optical Emission at Gamma-Ray Burst Locations by the Solar Mass Ejection Imager (SMEI), Astrophys. J., 637, 880, doi:10.1086/498407, 2006.
Buffington, A., Morrill, J. S., Hick, P. P., Howard, R. A., Jack-son B. V., and Webb, D. F.: Analysis of the Comparative Re-sponses of SMEI and LASCO, Proc. SPIE 6689, 66890B, 1, doi:10.1117/12.734658, 2007.
Buffington, A., Bisi, M. M., Clover, J. M., Hick, P. P., Jackson, B. V., Kuchar, T. A., and Price, S. D.: Measurements of the Gegen-schein brightness from the Solar Mass Ejection Imager (SMEI), Icarus, 203, 124, doi:10.1016/j.icarus.2009.04.007, 2009. Domingo, V., Fleck, B., and Poland, A. I.: SOHO: The Solar and
Heliospheric Observatory, Space Sci. Rev., 72, 81–84, 1995. Eyles, C. J., Simnett, G. M., Cooke, M. P., Jackson, B.
V., Buffington, A., Hick, P. P., Waltham, N. R., King, J. M., Anderson, P. A., and Holladay, P. E., The So-lar Mass Ejection Imager (SMEI), SoSo-lar Phys., 217, 319, doi:10.1023/B:SOLA.0000006903.75671.49, 2003.
Eyles, C. J., Harrison, R. A., Davis, C. J., Waltham, N. R., Shaugh-nessy, B. M., Mapson-Menard, H. C. A., Bewsher, D., Crothers, S. R., Davies, J. A., Simnett, G. M., Howard, R. A., Moses, J. D., Newmark, J. S., Socker, D. G., Halain, J. P., Defise, J. M., Mazy, E., and Rochus, P.: The Heliospheric Imagers On-board the STEREO Mission, Solar Phys., 254, 387, doi:10.1007/s11207-008-9299-0,, 2009.
Fry, C. D., Sun, W., Deehr, C. S., Dryer, M., Smith, Z., Akasofu, S.-I., Tokumaru, M., and Kojima, M.: Improvements to the HAF Solar Wind Model for Space Weather Predictions, J. Geophys. Res., 106, 20985–21001, 2001.
Fry, C. D., Dryer, M., Smith, Z., Sun, W., Deehr, C. S., and Aka-sofu, S.-I.: Forecasting Solar Wind Structures and Shock Arrival Times Using an Ensemble of Models, J. Geophys. Res., 108(A2), 1070, doi:10.1029/2002JA009474, 2003.
Hakamada, K. and Akasofu, S.-I.: Simulation of Three-Dimensional Solar Wind Disturbances and Resulting Geomag-netic Storms, Space Sci. Rev., 31, 3–70, 1982.
vations 1. Combined Nagoya and Cambridge data, J. Geophys. Res., 103, 12049–12067, 1998.
Jackson, B. V., Buffington, A., and Hick, P. P.: A heliospheric im-ager for Solar Orbiter, Proc. “Solar Encounter: The First Solar Orbiter Workshop”, May 14-18, 2001, Santa Cruz de Tenerife, Spain, ESA SP-493, 251, 2001.
Jackson, B. V., Buffington, A., Hick, P. P., Altrock, R. C., Figueroa, S., Holladay, P. E., Johnston, J. C., Kahler, S. W., Mozer, J. B., Price, S., Radick, R. R., Sagalyn, R., Sinclair, D., Simnett, G. M., Eyles, C. J., Cooke, M. P., Tappin, S. J., Kuchar, T., Mizuno, D., Webb, D. F., Anderson, P. A., Keil, S. L., Gold, R. E., and Waltham, N. R.: The Solar Mass Ejection Imager (SMEI) Mission, Solar Phys., 225, 177, doi:10.1007/s11207-004-2766-3, 2004.
Jackson, B. V., Buffington, A., Hick, P. P., Wang, X., and Webb, D.: Preliminary three-dimensional analysis of the he-liospheric response to the 28 October 2003 CME using SMEI white-light observations, J. Geophys. Res., 111, A04S91, doi:10.1029/2004JA010942, 2006.
Jackson, B. V., Buffington, A., Hick, P. P., Bisi, M. M., and Jensen, E. A.: SMEI Observations in the STEREO Era, in Proc. SPIE 6689, 66890C, 1, 2007.
Jackson, B. V., Bisi, M. M., Hick, P. P., Buffington, A., Clover, J. M., and Sun, W.: Solar Mass Ejection Imager (SMEI) 3D re-construction of the 27–28 May 2003 CME sequence, J. Geophys Res., 113, A00A15, doi:10.1029/2008JA013224, 2008. Kaiser, M. L., Kucera, T. A., Davila, J. M., St. Cyr, O. C.,
Guhathakurta, M., and Christian, E.: The STEREO Mission: An Introduction, Space Sci. Rev., 136, 5–16, 2008.
Kuchar, T. A., Buffington, A., Arge, C. N., Hick, P. P., Howard, T. A., Jackson, B. V., Johnston, J. C., Mizuno, D. R., Tappin, S. J., and Webb, D. F.: Observations of a Comet Tail Disruption In-duced by the Passage of a CME, J. Geophys. Res., 113, A04101, doi:10.1029/2007JA012603, 2008.
Lugaz, N., Vourlidas, A., Roussev, I. I., Jacobs, C., Manch-ester IV, W. B., and Cohen, O.: The Brightness of Density Structures at Large Solar Elongation Angles: What Is Being Observed by STEREO SECCHI?, Astrophys. J., 684, L111, doi:10.1086/592217, 2008.
White-Light (SMEI) and Radio (Wind/WAVES) Observations, J. Geophys. Res., 110(A9), A09S14, doi:10.1029/2004JA010943, 2005.
Stone, E. C., Frandsen, A. M., Mewaldt, R. A., Christian, E. R., Margolies, D., Ormes, J. F., and Snow, F.: The Advanced Com-position Explorer, Space Sci. Rev., 86, 1–22, 1998.
Tappin, S. J.: The Deceleration of an Interplanetary Transient from the Sun to 5 AU, Solar Phys., 233, 233, doi:10.1007/s11207-006-2065-2, 2006.
Tappin, S. J. and Howard, T. A.: Interplanetary Coronal Mass Ejec-tions Observed in the Heliosphere: 2. Model and Data Compar-ison, Space Sci. Rev., in press, doi:10.1007/s11214-009-9550-5, 2009.
Tappin, S. J., Buffington, A., Cooke, M. P., Eyles, C. J., Hick, P. P. Holladay, P. E., Jackson, B. V., Johnston, J. C., Kuchar, T., Mizuno, D., Mozer, J. B., Price, S., Radick, R. R., Simnett, G. M., Sinclair, D., Waltham, N. R., and Webb, D. F.: Tracking a Major Interplanetary Disturbance with SMEI, Geophys. Res. Lett., 31, L2802, doi:10.1029/2003GL018766, 2004.
Webb, D. F., Mizuno, D. R., Buffington, A., Cooke, M. P. Eyles, C. J., Fry, C. D., Gentile, L. C., Hick, P. P., Holladay, P. E., Howard, T. A., Hewitt, J. G., Jackson, B. V., Johnston, J. C., Kuchar, T. A., Mozer, J. B., Price, S., Radick, R. R. Simnett, G. M., and Tappin, S. J.: Solar Mass Ejection Imager (SMEI) Observations of CMEs in the Heliosphere, J. Geophys. Res., 111, A12101, doi:10.1029/2006JA011655, 2006.
Webb, D. F., Howard, T. A., Fry, C. D., Kuchar, T. A., Odstrcil, D., Jackson, B. V., Bisi, M. M., Harrison, R. A., Morrill, J. S., Howard, R. A., and Johnston, J. C.: Study of CME Propagation in the Inner Heliosphere: SMEI and STEREO HI Observations of the January 2007 Events, Solar Physics, STEREO Special Is-sue, 256, 239, doi:10.1007/s11207-009-9351-8, 2009a. Webb, D. F., Howard, T. A., Fry, C. D., Kuchar, T. A., Mizuno,
D. R., Johnston, J. C., and Jackson, B. V.: Studying Geoef-fective ICMEs between the Sun and Earth: Space Weather Im-plications of SMEI Observations, Space Weather, 7, S05002, doi:10.1029/2008SW000409, 2009b.