www.ocean-sci.net/12/1049/2016/ doi:10.5194/os-12-1049-2016
© Author(s) 2016. CC Attribution 3.0 License.
Seasonal variability of the Ekman transport and pumping in the
upwelling system off central-northern Chile (
∼
30
◦
S) based on a
high-resolution atmospheric regional model (WRF)
Luis Bravo1,2,3, Marcel Ramos2,3,1,6, Orlando Astudillo1,4, Boris Dewitte4,3, and Katerina Goubanova5
1Centro de Estudios Avanzados en Zonas Áridas (CEAZA), Coquimbo, Chile
2Departamento de Biología, Facultad de Ciencias del Mar, Universidad Católica del Norte, Coquimbo, Chile 3Millennium Nucleus for Ecology and Sustainable Management of Oceanic Islands (ESMOI), Coquimbo, Chile 4Laboratoire d’Etudes en Géophysique et Océanographie Spatiales (LEGOS), Toulouse, France
5Centre Européen de Recherche et de Formation Avancée en Calcul Scientifique (CERFACS), Toulouse, France 6Centro de Innovación Acuícola Aquapacífico, Coquimbo, Chile
Correspondence to:Luis Bravo (luis.bravo@ceaza.cl) and Marcel Ramos (marcel.ramos@ucn.cl) Received: 1 October 2015 – Published in Ocean Sci. Discuss.: 8 December 2015
Revised: 8 August 2016 – Accepted: 16 August 2016 – Published: 8 September 2016
Abstract. Two physical mechanisms can contribute to
coastal upwelling in eastern boundary current systems: off-shore Ekman transport due to the predominant alongoff-shore wind stress and Ekman pumping due to the cyclonic wind stress curl, mainly caused by the abrupt decrease in wind stress (drop-off) in a cross-shore band of 100 km. This wind drop-off is thought to be an ubiquitous feature in coastal upwelling systems and to regulate the relative contribution of both mechanisms. It has been poorly studied along the central-northern Chile region because of the lack in wind measurements along the shoreline and of the relatively low resolution of the available atmospheric reanalysis. Here, the seasonal variability in Ekman transport, Ekman pumping and their relative contribution to total upwelling along the central-northern Chile region (∼30◦S) is evaluated from
a high-resolution atmospheric model simulation. As a first step, the simulation is validated from satellite observations, which indicates a realistic representation of the spatial and temporal variability of the wind along the coast by the model. The model outputs are then used to document the fine-scale structures in the wind stress and wind curl in relation to the topographic features along the coast (headlands and embay-ments). Both wind stress and wind curl had a clear seasonal variability with annual and semiannual components. Along-shore wind stress maximum peak occurred in spring, sec-ond increase was in fall and minimum in winter. When a
threshold of−3×10⁻⁵s−1for the across-shore gradient of
alongshore wind was considered to define the region from which the winds decrease toward the coast, the wind drop-off length scale varied between 8 and 45 km. The relative contribution of the coastal divergence and Ekman pumping to the vertical transport along the coast, considering the es-timated wind drop-off length, indicated meridional alterna-tion between both mechanisms, modulated by orography and the intricate coastline. Roughly, coastal divergence predom-inated in areas with low orography and headlands. Ekman pumping was higher in regions with high orography and the presence of embayments along the coast. In the study region, the vertical transport induced by coastal divergence and Ek-man pumping represented 60 and 40 % of the total upwelling transport, respectively. The potential role of Ekman pump-ing on the spatial structure of sea surface temperature is also discussed.
1 Introduction
offshore Ekman transport due to alongshore winds (with an equatorward component) and earth’s rotation and the pres-ence of the coast (i.e., coastal upwelling). The second one is Ekman pumping, which is the result of a cyclonic wind stress curl caused mainly by the wind drop-off that extends only tens of kilometers in width along the coast and is a typ-ical feature of the eastern boundary current systems (Bakun and Nelson, 1991; Pickett and Paduan, 2003; Capet et al., 2004; Jacox and Edwards, 2012). Starting in the mid-1970s, a series of studies began assessing the contribution of Ekman pumping on coastal upwelling for the California Current sys-tem (Halpern, 1976; Nelson, 1977), which later expanded to the other four upwelling systems (Bakun and Nelson, 1991). In one of these four regions, the coast of north and central Chile, this mechanism has been poorly evaluated, primarily due to the scarcity of in situ data, limitations in diffusiometer winds that have a “blind zone” near the coast and the rel-atively low spatial resolution of the atmospheric reanalysis. This has caused a limited progresses in the understanding of the upwelling dynamics and the coastal circulation of the re-gion, among other factors.
Coastal upwelling has been widely studied in several re-gions of the world, in particular along the eastern boundary upwelling systems (EBUSs). Currently, there is no general-ized conceptual model for the upwelling structure that con-siders the region near the coast, the coastal boundary and the open ocean (Mellor, 1986; Marchesiello and Estrade, 2010). Traditionally a simple relationship based on wind stress along the coast has been used as an index of the coastal upwelling intensity (Bakun, 1973); this approximation does not consider other more complex physical processes, such as the wind curl (Pickett and Paduan, 2003; Capet et al., 2004; Jacox and Edwards, 2012) and the geostrophic flow toward the coast, which is in balance with the alongshore pressure gradient and could potentially limit upwelling (Marchesiello et al., 2010; Marchesiello and Estrade, 2010). In the case of the wind curl, several modeling studies from different up-welling systems suggest that wind stress decreases within a narrow coastal band of 10–80 km called wind “drop-off” (Capet et al., 2004; Bane et al., 2005; Perlin et al., 2007; Re-nault et al., 2012, 2015) that is highly sensitive to the res-olution of the model. Thus, regional ocean modeling studies show that the upwelling response is sensitive to the transition in the structure of the wind near the coast (Capet et al., 2004; Jacox and Edwards, 2012), where the structure and physi-cal forcing of the transitional coastal wind profile is not well understood (Jin et al., 2009). In the literature at least three main hypotheses have been proposed to explain the weak-ening of the wind close to the coast (drop-off) that gener-ates the wind stress curl within the coastal band. The first is related to the change of surface and boundary layer fric-tion in the land–sea interface (Capet et al., 2004). The sec-ond is related to the ocean–atmosphere coupling between the sea surface temperature (SST) and the wind (Chelton et al., 2007); particularly cold water upwelling tends to stabilize
the atmospheric boundary layer, decoupling the high atmo-spheric circulation from the surface circulation. The last one is related to coastal orography (Edwards et al., 2001), coast-line shape (Perlin et al., 2011), and the combination of both (Renault el at., 2015) constraining the vorticity budget of the low-level atmospheric circulation. Other possible mecha-nisms that could potentially contribute to wind drop-off near the coast are the effects of sea breeze and pressure gradients (across or along the coast) at sea level.
The central-northern Chile region is characterized by nutrient-rich cold surface waters, attributed to the surface circulation of the Humboldt system and mainly coastal upwelling driven by alongshore winds that are associated with the southeast Pacific anticyclone (Shaffer et al., 1999; Halpern, 2002). A strong seasonal variability of the south-east Pacific anticyclone produces favorable upwelling winds to peak during spring and summer and decrease during win-ter (Strub et al., 1998). Within central-northern Chile the area around 30◦S is characterized by the most intense upwelling favorable winds (Shaffer et al., 1999; Rutllant and Monte-cino, 2002). Additionally, local high-frequency forcing in the region is associated with atmospheric coastal jets with peri-ods less than 25 days, which are related to synoptic dynamics of the mid-latitude pressure perturbations, in this case high pressures that migrate toward the east (Muñoz and Garreaud, 2005; Rahn and Garreaud, 2013) and play a major role in coastal upwelling (Renault et al., 2009, 2012; Aguirre et al., 2012). All these features make the region a natural laboratory to explore the forcing mechanisms and describe the physical processes that modulate coastal upwelling.
In a recent modeling study Renault et al. (2012) ana-lyzed the main physical processes that explain changes in sea surface temperature in an upwelling event during the occurrence of an atmospheric coastal jet along the central-northern Chile region. The results showed a clear drop-off of the coastal wind that was not observed in the QuikSCAT data due to the “blind zone” in the satellite measurements (∼25 km offshore). The oceanic response to the atmospheric
Figure 1.Study area showing bathymetry and topography of the coastal terrain. The dotted thick line indicates the western boundary of the coastal band where satellite information (∼25 km offshore) is absent. Red squares indicate the location of the three weather stations at Loma de Hueso, Punta Lengua de Vaca and Parral Viejo. The inset plot shows the three model domains used in the WRF simulations (36, 12 and 4 km).
Garreaud et al. (2011), using observations, found a local at-mospheric coastal jet just north of one of the most promi-nent geographic points of the region: Punta Lengua de Vaca (see Fig. 1). This coastal jet shows a distinct daily cycle as a result of the strong baroclinicity due to heating differen-tial in the region. In a later study Aguirre et al. (2012), using climatological QuikSCAT winds to force a regional ocean model, found the importance of the wind stress curl over the regional circulation exerting control over the seasonal cycle of an equatorward coastal jet. This study also evaluated the contribution of Ekman pumping to the total upwelling, which was not well resolved due to a poor resolution of the satel-lite winds within the first 30 km near the coast. In particular, due to the narrow continental shelf off central-northern Chile, the cells of upwelling due to coastal divergence are trapped near the coast (Estrade et al., 2008); consequently, the use of QuikSCAT winds could be overestimating the effect of up-welling driven by coastal divergence and Ekman pumping.
Although previous studies have documented the impor-tance of the wind stress curl near the coast of central Chile (Renault et al., 2012; Aguirre et al., 2012), the impact of the abrupt transition of the wind near the coast (i.e., drop-off) and its seasonal variability on upwelling are still poorly understood. Here, prior to addressing this issue from an oceanic perspective, our objective is to document the wind
stress curl (drop-off) and its seasonal variability off central-northern Chile (∼30◦S) using a high-resolution (∼4 km)
at-mospheric model. Our focus in on the Ekman pumping and its contribution to the total upwelling, and the factors that could contribute to its meridional variability (i.e., topogra-phy, coastline and air–sea interactions).
The paper is organized as follows: a description of the at-mospheric simulations and the methods used to estimate dif-ferent upwelling terms are described in Sect. 2. Section 3 presents results and discussions and was subdivided into four subsections. The first one describes wind stress curl pattern and the spatial scale of the wind drop-off. The second and third present an analysis of the annual variability in Ekman pumping and coastal divergence, and their relationship with coastal topography and their contribution to upwelling trans-port. The fourth presents a study of the relationship between Ekman pumping and surface temperature near the coast. Fi-nally, Sect. 4 presents a summary.
2 Methods and model configuration 2.1 Model output
The Weather Research and Forecasting (WRF) model ver-sion 3.3.1 (Skamarock and Klemp, 2008) was configured with three nested domains (Fig. 1) with increasing horizontal grid spacing over the region of interest by a factor of 3 from one domain to the next. The largest synoptic domain cov-ers most of South America and the eastern Pacific in a Mer-cator projection with a horizontal resolution of 36 km. The northerly extension of the parent domain extends to 10◦N be-cause beyond the focus of the present study we are also inter-ested (future work) in assessing the impact of the downscaled winds from the coarse domain over a regional ocean model of the Humboldt system, whose domain extends from 5◦N to 40◦S following the approach of Cambon et al. (2013). The second domain covers the coast of central-northern Chile (25–35◦S) with a horizontal resolution of 12 km. The in-nermost domain is centered over the Coquimbo Bay system with a horizontal grid spacing of 4 km (Fig. 1). The use of such near-kilometer resolution improves the representation of complex terrain and is necessary for dynamical down-scaling of near-surface wind speed climate over complex terrain (Horvath, 2012). WRF employs a terrain-following hydrostatic-pressure coordinate in the vertical, defined as eta (η) levels. Here a total of 42ηlevels were used in the verti-cal with increasing resolution toward the surface, 20 of them in the lowest 1.5 km with∼30 m in the vertical for the
Given the complex interactions between alongshore winds, topography, cloudiness, land heating and coastal up-welling in the study region (Rahn and Garreaud, 2013; Wood et al., 2011; Toniazzo et al., 2013), we have tested the WRF model in different combinations of parameterizations (cumu-lus – planetary boundary layer – soil model), surface data (SST forcing, topography and land surface) and nesting tech-nique. A set of eight sensitivity simulations (for more details see response to referee 1, http://www.ocean-sci-discuss.net/ os-2015-94/#discussion) was carried out for the control pe-riod, i.e., from 1 October to 31 December 2007, correspond-ing to the upwellcorrespond-ing season in central-northern Chile. The re-sults were evaluated against surface observations from mete-orological automatic stations and scatterometers (QuikSCAT, ASCAT). Particular attention was paid to the shoreward de-crease and temporal variability of the surface wind speed near the coast. The configuration with the best estimates of observed surface variability and mean state was then used for the long simulation 2007–2012 (Table 1).
The initial and lateral boundary and conditions (LBCs) were derived from the National Centers for Environmental Prediction (NCEP) Final Analysis Data (FNL) (Kalnay et al., 1996; available online at http://dss.ucar.edu/datasets/ds083. 2/) at 1◦×1◦global grid resolution every 6 h. The boundary conditions are prescribed over the coarser domain with the depth of five grid cells where simulated variables are relaxed towards the FNL solution. The SST forcing data are based on the daily Operational Sea Surface Temperature and Sea Ice Analysis (OSTIA) at 0.05◦×0.05◦global grid resolution (Stark et al., 2007). To include the diurnal cycle we have cal-culated the 6 h anomalies with respect to the daily mean from the 6 h FNL SST and then added to the daily OSTIA SST. In this way we generate the 6 h lower boundary updates with the same update rate used for the LBCs as Renault et al. (2015). For each year the model was re-initialized with the FNL reanalysis every 3 months leaving 6 overlap days as a spin-up, the outputs during this period were excluded from the analysis. This scheme was suggested by Lo et al. (2008) in order to mitigate the problems of systematic error growth in long integrations and inconsistences between the flow devel-oping and the lateral boundary conditions. The instantaneous model diagnoses were stored at hourly intervals, and the time steps were set to 108, 36 and 12 s for the domains of 36, 12 and 4 km resolution respectively.
The simulated winds were validated using QuikSCAT and observations from two weather stations near the coast in Loma de Hueso (LDH) and Punta Lengua de Vaca (PLV) and a third station farther inland named Parral Viejo (Figs. 1 and 2). A spatial comparison for 2007–2009 was done between satellite and WRF using the coarse-resolution grid (36 km). The comparison showed a good agreement between obser-vations and modeling results with a similar spatial struc-ture and magnitudes of the same order, especially within the study region (27–33◦S). The root mean square of the difference for observations and model results was less than
1 m s−1(Fig. 2c). The high-resolution model outputs (4 km)
were also compared with available observations. Initially, for each of the weather stations daily wind cycles were com-pared with simulations (not shown). The results indicate a better fit in diurnal variability when the model is forced with SST (OSTIA), which was finally chosen for the simulations performed in this study. The best fit between observations and model outputs was found when the wind intensifies dur-ing the afternoon between 17 and 19 h. A good model rep-resentation of the afternoon winds is key for a proper repre-sentation of coastal upwelling in the region. Finally, for each weather station, linear regressions and dispersion plots were done between the meridional component of simulated (4 km) and observed winds (Fig. 2d–f). A good agreement was ob-served for all the cases.
2.2 Upwelling estimates
The relative importance of coastal upwelling due to coastal divergence (Smith, 1968) was estimated using wind stress obtained by the WRF model:
Et= 1
ρwfτ× ˆk, (1)
where Et is Ekman transport (m2s−1),τ is the wind stress
at the land–sea margin (∼4 km from the coast),ρwis water
density,f is the Coriolis parameter andk is a unit vertical vector. The vertical velocity from Ekman pumping (EP) was estimated using a definition given by Halpern (2002) and Re-nault et al. (2012).
wEP=Curl(τ ) ρwf +
βτx
ρwf2, (2)
whereτ (x, y)is wind stress,βis the Coriolis parameter gra-dient andτx is the cross-shore wind stress. Latitude
varia-tions were not significant; therefore, the last term in Eq. (2) was neglected. In order to compare the two upwelling pro-cesses, Ekman pumping was converted into transport by in-tegrating the vertical velocity within a certain distance from the coast, which in our case was the length scale of the wind drop-off (Ld) obtained from a reference value
(de-fined by Renault et al., 2015) where cross-shore wind curl was <−3×10⁻⁵s−1. The wind drop-off spatial length (Ld)
varies meridionally (Fig. 3b–c).
Note that if we assume that the wind is parallel to the coast and that the wind curl is dominated by its cross-shore gradi-ent compongradi-ent (and this gradigradi-ent is nearly constant in the drop-off zone), then the total upwelling transport is simply τ/(ρf )or expressed as vertical velocity isW=τ/(ρf Ld), whereτ is the wind stress atLd. Consequently it is
Table 1.Information of the physics options and main features used in the simulations.
Parameterization References
Microphysics: WRF Single-Moment six-class scheme. A scheme with ice, snow and grau-pel processes suitable for high-resolution simulations.
Hong et al. (2006)
Longwave/shortwave radiation: Rapid Radiative Transfer Model (RRTMG). An accurate scheme using look-up tables for efficiency, accounts for multiple bands, trace gases, and microphysics species. It includes the Monte Carlo independent column approximation (MCICA) method of random cloud overlap.
Iacono et al. (2008).
Boundary layer: University of Washington turbulent kinetic energy (TKE) boundary layer scheme. This scheme is TKE based, and it is characterized by the use of moist-conserved variables, an explicit entrainment closure, downgradient diffusion of momentum,
and conserved scalars within turbulent layers.
Bretherton and Park (2009)
Surface layer: Based on Monin–Obukhov with Carlson–Boland viscous sub-layer and standard similarity functions from look-up tables.
Paulson (1970) Dyer et al. (1970) Webb (1970) Beljaars (1994)
Zhang and Anthes (1982)
Land surface model: The NOAH Land Surface Model. For land surface processes includ-ing vegetation, soil, snowpack and land–atmosphere energy, momentum and moisture ex-change.
Tewari et al. (2004)
Cumulus: Betts–Miller–Janjic scheme. Operational eta scheme. Column moist adjustment scheme relaxing towards a well-mixed profile.
Janjic (2000)
therefore, the wind drop-off has an impact on the total up-welling velocity. Thus a proper assessment of scales involved in both mechanisms is crucial to the upwelling problem.
3 Results and discussion
3.1 Mean wind stress curl and the wind drop-off spatial scale
From the wind stress simulations (model wind outputs) we obtained the mean of the wind stress curl in the three model domains with spatial resolutions of 36, 12 and 4 km (Fig. 3a– c). The mean wind stress curl patterns show clear differences when resolution is increased. In the simulations of higher res-olution, small-scale or finer-scale structures are well defined, especially close to the coast, which are not present in the simulation of coarse resolution and have not been resolved or studied in previous studies (Aguirre et al., 2012; Renault el al., 2012). The simulations with higher resolution (12 and 4 km) show a cyclonic wind stress curl (negative) within the coastal band and within the Coquimbo Bay system that is associated with a positive Ekman pumping (producing up-welling), while in the oceanic sector a less intense anticy-clone wind curl predominates. The negative curl within the coastal band is the result of an onshore decay in wind inten-sity (drop-off) that is characteristic of EBUSs (Capet et al., 2004; Renault et al., 2012).
In the central-northern Chile region the drop-off length scale (Ld) is between 8 and 45 km (Fig. 3b–c, segmented
yel-low line). When the resolution of the model is increased, the wind drop-off takes place closer to the coast and exhibits a larger meridional/latitudinal variability, with in particular a larger drop-off scale in the central region of the domain than in the region south of 30.25◦S. The meridional differences of Ld could be associated with coastal orography and the
shape of the coastline; this will be discussed later in Sect. 3.3. The finer structures in the wind stress curl close to shore and cannot be determined with confidence from observations of the scatterometers of previous and current satellite missions, such as QuikSCAT and/or other satellite, because of the blind zone in measurements within the first 25 km from the shore. Note that the blind zone increases to 50 km when wind stress curl is estimated, as a result of the estimate of the spatial derivative.
Renault et al. (2012), based on atmospheric simulations (obtained with WRF), determined that the extent of the wind drop-off was∼70 km. This length was different from the one
differ-Figure 2.Comparisons of the spatial patterns of the mean velocity fields of winds obtained (common period 2007–2009) from(a)QuikSCAT, (b)WRF simulation for the 36 km grid configuration and(c)root mean square differences between observations and model results. The lower panels show dispersion plots between the observed and modeled N–S winds at(d)Loma de Hueso,(e)Parral Viejo and(f)Punta Lengua de Vaca (Fig. 1). Red line represent to linear regress and black line is 1:1 relation.
ence with the satellite product. As mentioned above, in the study region there is a lack of wind information within the coastal band that covers the blind zone of the satellites and that can be used for validation purpose. One of the first in situ measurements in the region was done during the field campaign CupEX (Garreaud et al., 2011). During this exper-iment a zonal profile of wind was measured using airborne meteorological techniques. These observations allowed de-tection of an atmospheric coastal jet with a marked daily cy-cle that extended north of Punta Lengua de Vaca towards the Coquimbo Bay system.
Such a coastal jet is present in our simulations that pro-duce a wind curl in the bay system, which affects the circu-lation and coastal upwelling in the region. Other recent wind observations were collected under the scope of this study (FONDECYT postdoctoral project 3130671), which are pre-sented in Fig. 3e. These wind observations were made with a marine weather station (AirMar) installed on a fishing boat. Measurements were made for 22 April, 18 May, 15 Septem-ber and 28 OctoSeptem-ber 2014. Although these measurements do
not cover the period of the simulations, they are presented here to illustrate observed features of the zonal wind profiles in the southern region. Despite the large spatial and temporal variability of the observations, they suggest a tendency to-wards a reduction of the alongshore winds toward the coast comparable to what is simulated by the model (Fig. 3d).
Figure 3.Mean wind stress curl obtained by the model (for 2007–2012) using three model domains: (a)36,(b) 12 and(c)4 km. The yellow dotted line represents the length scale of the wind drop-off determined from a threshold value of−0.3×10⁻⁴s−1(Renault et al., 2015).(d)Mean zonal profiles of alongshore wind speed obtained from the three model configurations (36, 12 and 4 km) and QuikSCAT observations are shown.(e)Zonal profiles of alongshore wind speed from a weather station obtained onboard of a fishing boat during 22 April (black line), 18 May (black dashed line), 15 September (red line) and 28 October (red dashed line) of 2014 are also shown. The segmented line in(d)and(e)indicates the location of the satellite blind spot.
winds were also observed north of Punta Choros (29◦S) and south of 31◦S. However, when we used the daily averages, we can distinguish the coastal jet and high winds in Punta de Choros and south of 31◦S, but with smaller magnitudes than in the afternoon. This is due to the smoothing produced by the averaging to daily mean data. On the other hand, if we look at the structure of Ekman pumping for the two cases, all showed a similar pattern near the coast, with a positive val-ues (favorable to upwelling), but differed in their magnitude, which was greater in the afternoon. Therefore, we believe that for the purposes of this article, using daily averages of wind from the WRF simulation time was valid.
3.2 Annual variability of the wind stress and Ekman pumping
of the wind stress determines the behavior of the coastal upwelling and primary productivity in the region. This is through two main mechanisms – the coastal divergence and the Ekman pumping – which will be evaluated in the follow-ing section. The wind also induces vertical mixfollow-ing and sur-face cooling. This cooling effect can be even comparable to the one by vertical advection (Renault et al., 2012). In gen-eral, these mechanisms may covary in time, responding to the seasonal cycle of the wind stress; hence in a grouped sta-tistical analysis (like SVD) it is difficult to isolate the spatio-temporal combined variability of two mechanisms without rejecting the effect of the third. On the other hand, the model simulates well the coastal atmospheric jet observed in the zone of Punta Lengua de Vaca (∼30◦S), in particular the
maximum intensity during spring (Rahn and Garreaud, 2011, 2013).
Close to the coast, where the satellite data have no cover-age or the estimate in wind stress is uncertain (Fig. 1), a wind decay towards the coast (drop-off) is observed during prac-tically all the calendar months of the year, with still a more pronounced tendency in the period between September and December. The horizontal gradient of the wind stress that is most intense close to the coast produces a wind curl with a clockwise rotation direction (cyclonic for the SH) generating a positive Ekman pumping favorable to the upwelling.
In addition to a non-uniform spatial distribution, the drop-off length (Ld) in the area of interest also exhibits a marked
seasonal variability. Based on an atmospheric simulation in the west coast of USA, Renault et al. (2015) also suggested that the drop-off presents seasonal and spatial variability, but with an extension ranging from 10 to 80 km. These authors propose that the drop-off dynamics of the wind is due mainly to orographic effects and the shape of the coastline, reaching a maximal reduction of the wind (∼80 %) when these are
combined. According to these authors, the drop-off length scale of the wind in front of Chile should be approximately 30 km, less than the scale off the west coast of USA. This would result from the different shape of the Chilean coast-line characterized by a straighter coastcoast-line and the reduced numbers of capes compared to the US west coast. In addi-tion the Andes would induce a sharper onshore decline of the wind (drop-off) than the mountains of the west coast of the USA (Renault et al., 2015). In the Sect. 3.3 the length scale of the drop-off along the central-northern coast of Chile will be analyzed in relation to the coastal orography and the shape of the coastline.
Despite that the length scale of the wind drop-off in front of central-northern Chile (∼45 km) is on average less than
that estimated in the California Current system (Enriquez and Friehe, 1996; Renault et al., 2015), the wind-stress curl from this zonal gradient of the wind generates an Ekman pump-ing with a marked seasonality (Fig. 5) and positive vertical velocities (upward) that reach 4 m d−1, similar values to that obtained by Pickett and Paduan (2003) in front of the region of the California Current system.
The simulation (4 km) has allowed the depiction and doc-umentation of the mesoscale atmospheric circulation in the first 50 km from the coast (Fig. 3), where the spatial patterns of the Ekman pumping are much more marked, especially at latitudes where there are sharp topographic changes in the coastline (Fig. 5). Thus, structures of Ekman pumping are highlighted to the north of the main headlands of the region (Punta Lengua de Vaca and Punta Choros) and experience a seasonal cycle. In addition, the Ekman pumping presents negative values (downwelling) off-shore associated with an anti-cyclonic wind curl around 28.5◦S and between 30 and 31◦S that reaches the greatest extent during August, while decreasing considerably in the summer months and begin-ning of fall (Fig. 5). Mean Ekman pumping in spring is much larger than in the other seasons (i.e., summer, fall and win-ter), indicating that the spring positive pumping dominates the other, especially north of 29◦S, in the interior of the Co-quimbo Bay system and south of 31.5◦S (not shown).
With the objective of analyzing in more details the sea-sonal and spatial variability of the wind stress and its zonal gradient, three specific sectors of the study area were selected (28.5, 30.5 and 32.5◦S), which are outside the Coquimbo Bay system (Fig. 6). As was mentioned before, the region is characterized by a marked wind stress seasonality more pro-nounced to the south of the study area (Fig. 6c). In general, the wind component along the coast shows a predominance of southerly winds favorable to the upwelling during all year-round, emphasizing a decrease in the wind stress towards the coast for the spring and summer months at 32.5◦S, and in summer at 28.5 and 30.5◦S. When estimating the zonal gra-dient of the wind stress taking as a reference the wind at the coast, the most intense positive gradients (due to the wind drop-off towards the coast) are obtained in a coastal band with a width smaller than 50 km, indicating that the Ekman pumping is the most effective inside the coastal band, as is evidenced in Figs. 4 and 5. On the other hand, the negative zonal gradient extent (Ekman pumping and downwelling) is greater in the sections located farther north, at 28.5 and 30.5◦S, than in the section located at 32.5◦S (Fig. 6d, e and f), indicating that in the southern part of the study region, the positive Ekman pumping region extends farther than in the zones where the wind stress is more intense seasonally close to the coast (Fig. 4).
3.3 Contributions of Ekman transport and Ekman pumping to the upwelling rate
The central-northern Chile continental shelf is very narrow and very steep so the scale of coastal divergence is < 10 km (considering the theoretical framework of Estrade et al., 2008), while the length scaleLdof Ekman pumping
(previ-ously defined, based on Renault et al., 2015) is∼45 km. To
Figure 4.Wind stress annual cycle obtained from the simulation at 4 km resolution (for 2007–2012). Color represents the magnitude of wind stress (in N m−2)and the arrows indicate the wind stress direction.
was obtained first by taking the wind of WRF closest to the coast (< 8 km) and meridionally integrated every 0.25◦ (Fig. 7e), while the annual cycle of Ekman pumping transport (from wind of WRF) was obtained by integrating the verti-cal velocity from the shoreline to the distance corresponding to the drop-off (Ld) value, also within 0.25◦latitude bands (Fig. 7f).
The results indicate a marked annual cycle with maximum vertical transport in the spring, both induced by coastal di-vergence and Ekman pumping, with secondary maximum in some areas during fall accounting for a weaker semiannual component. As expected, there is a large temporal coherency along the coast between both processes (the meridional av-erage correlation between Ekman pumping and coastal di-vergence reaches 0.8), except locally at some latitudes (e.g., at 31.25◦S) where there is a weak seasonal cycle in Ekman pumping (Fig. 7f) due to either a weak drop-off or a compen-sation effect by the zonal wind stress component. The high correlations indicate a seasonal consistency between both mechanisms, which has been previously reported in other up-welling systems (e.g., Pickett and Paduan, 2003; Renault et al., 2015). Although both mechanisms are highly correlated at seasonal timescales, they exhibit significant differences in relative magnitude as a function of latitude; that is, when one is intense the other is weak. For instance, coastal divergence strongly dominates over Ekman pumping between 30.25 and 31.25◦S (Fig. 7d), which is the most recognized upwelling center in the region (located south of PLV), as well as in the region between 28.5 and 29.25◦S (north of Punta Choros). In
Figure 5.Annual cycle of Ekman pumping (vertical velocity in m d−1)obtained from the simulation at 4 km resolution (for 2007– 2012).
those regions Ekman pumping tends to be weaker, whereas it is predominant for the area between 29.25 and 30.25◦S, inside the Coquimbo Bay system and the area between 28.0 and 28.75◦S, north of LDH. South of 31.25◦S, both mecha-nisms vary meridionally more uniformly. The estimate of the meridional correlation between both mechanisms as a func-tion of calendar month indicates that they are better related in spring and summer (∼ −0.72) than in winter (∼0.45).
Possible processes that could explain the inverse (negative) spatial relationship between the two mechanisms and its sea-sonal modulation are discussed below. Before continuing, we should mention that processes such as upwelling shadow can be important in the Coquimbo Bay system and would affect the temperature distribution inside the bay, especially in the southern part of the bay close to the coast, where higher tem-peratures are observed (and higher thermal front) compared to the lower temperature area that extends north from Punta Lengua de Vaca (Fig. 10). In fact a study in the southern part of the Coquimbo Bay system (Moraga-Opazo et al., 2011) shows cyclonic circulation when there are upwelling favor-able winds, and the circulation is attributed to the separation of oceanic flow in Punta Lengua de Vaca, which is in agree-ment with the process of upwelling shadow and mainly af-fects the area indicated above. However, we think that this is not inconsistent with the effect of the wind curl in the area, which would favor upwelling north of Punta Lengua de Vaca. The oceanic response in the area clearly needs more attention and research in future.
Figure 6.Hovmöller diagrams of alongshore wind stress seasonal cycle (top panels) and the zonal gradient of alongshore wind (lower panels) for the regions at 28.5(a, d), 30.5(b, e)and 32.5◦S(c, f). The monthly mean zonal wind stress and mean zonal gradient are also shown (side black line).
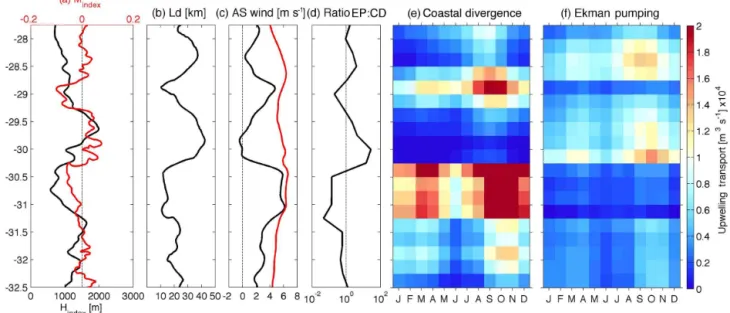
Haack, et al., 2001; Koraˇcin et al., 2004; Renault et al., 2015, among others), we now document the relationship between the relative importance of Ekman transport and pumping, and the coastal topography and shape of the coastline in the re-gion. An along-coast orography index (Hindex)is estimated from the average of the orographic height between the coast-line and 100 km inland (as in Renault et al., 2015). In ad-dition, the coastline meandering index (Mindex)is estimated by converting the position of the coastline into distances; afterwards using a high-variability pass filter (with 10 km half-width) the small fluctuations in the index are smoothed. Consequently, the index only considers the abrupt change in coastline configuration at relatively large scale (Renault et al., 2015). Figure 7a shows theHindex(black line) andMindex (red line). In the latter index negative values are associated with headlands, while positive values are associated with bays. The drop-off scale and alongshore wind at the coast and atLdare also included (Fig. 7b–c). Note thatLdis inversely
proportional to coastal wind (R2of∼0.81), while the wind
evaluated at Ld is spatially more homogenous. This differs
from the results obtained by Renault et al. (2015) along the western coast of USA. From the inspection ofHindex,Mindex
andLdthree scenarios are defined that could explain the ob-served upwelling pattern (Fig. 7d–f):
1. There is a prevalence of positive Ekman pumping: in sectors such as the Coquimbo Bay system and the re-gion north of 28.5◦S (LDH), where the wind curl inten-sifies due to the sharp decline of onshore wind, with a large drop-off scale (Ld). In addition, the combination
of a high orography (largeHindex)and the presence of bays favors a decrease in the meridional onshore wind. 2. There is a prevalence of coastal divergence: in sectors
characterized by a low topography (smallHindex)and a negativeMindexdue to the presence of headlands such as Punta Lengua de Vaca and Punta Choros, with a smaller drop-off scale (Ld) and stronger winds along-shore (Fig. 7b–c).
3. South of 31.25◦S the pattern is more complex than previous scenarios. Both mechanisms are present but with a slight dominance of coastal divergence compared with Ekman pumping. South of this latitude, Ld
Figure 7.Contributions of the coastal divergence (CD) and Ekman pumping (EP) to the vertical transport near the coast.(a)Integrated orography index (Hindex, black line) and coastline meander index (Mindex, red line, see text).(b)Drop-off spatial length.(c)Alongshore wind atLd(red line) and coastal (black line).(d)Ratio between Ekman pumping and coastal divergence.(e)Seasonal vertical transport associated with coastal divergence and(f)seasonal vertical transport associated with Ekman pumping. To estimate the coastal divergence the wind stress closest to the coast was used, while Ekman pumping was integrated from the coast to the longitude corresponding to a distance from the coast equal to the length of the drop-off (see text).
and headlands, and the orography index is moderately high without largest changes as in the northern coastal region.
Renault et al. (2015) proposed that the coastal topography induces a decrease in the intensity of the wind towards the coast through the vortex stretching term. Similarly, Archer and Jacobson (2005) from atmospheric numerical simula-tions showed that the topography in the Santa Cruz, Cal-ifornia, region, is required for the formation of turbulence and vorticity. On the other hand, the shape of the coast-line with capes and headlands increases the orographic effect through the vortex stretching term, tilting–twisting and tur-bulent flux divergence (Archer and Jacobson, 2005; Renault et al., 2015). The sea–land drag coefficient difference mainly acts as a barrier that turns the wind alongshore.
Another minor factor is the sharp coastal sea surface temperature front associated with upwelling. Renault et al. (2015) show that in their sensitivity experiment adding a sharp SST front over a coastal band strip leads to weaker surface wind associated with more stable and shallow ma-rine boundary layer. This response of wind may be due to so-called “downward mixing” mechanism (Wallace et al., 1989; Hayes et al., 1989), which was used by many authors to explain the observed tendency of surface winds to de-celerate over colder flank of the SST front and acde-celerate over warmer flank of the SST front (cf. Small et al., 2008, and references therein): warm (cold) SST would destabilize (stabilize) the planetary boundary layer and cause enhanced
(reduced) vertical turbulent mixing, increasing (decreasing) downward fluxes of horizontal momentum from the faster flow above to the slower near-surface flow. Nevertheless, a large SST anomaly (by−3◦C in the experiment of Renault
et al., 2015) is needed to induce a significant weakening of wind and significant additional wind drop-off. Therefore, the SST effect can be considered as secondary compared to the orography effect over the California coast.
The combination of coastal topography and the presence of headlands, points and capes on the US west coast induces a stronger and larger wind drop-off, which in turn is associ-ated with a positive Ekman pumping (Koraˇcin et al., 2004; Renault et al., 2015). This characteristic differs from what is observed along central-northern Chile, where the larger drop-off (Ld) length, associated with a strong wind curl (Fig. 7b– c), takes place in the presence of abrupt orography and within the Coquimbo Bay system (30.25–29.25◦S). There the cross-shore wind component is more intense and favors the wind curl, whereas with lower terrain and the presence of head-lands theLdis very small (cf. Fig. 10, Renault et al., 2015).
Figure 8. Contributions of coastal divergence (CD) and Ekman pumping (EP) to the vertical transport near the coast (in Sv) over the study area (27.75–32.5◦S, see Fig. 7). Seasonal vertical transport associated with coastal divergence (black line), Ekman pumping (red line) and total wind induced vertical transport (blue line, sum of both vertical transports). The estimates were carried out from the WRF simulation at 4 km resolution.
coastal topography that favors baroclinicity north of PLV (Garreaud et al., 2011; Rahn et al., 2011). This feature would deserve further consideration based on the experiments done with the regional atmospheric model; however, this is beyond the scope of the present study. Here the focus is on under-standing the possible effect of the wind drop-off and its spa-tial and seasonal variability on the upwelling dynamics.
To determine the contribution of the two proposed mech-anisms to the total upwelling in the region, vertical trans-port due to coastal divergence and Ekman pumping were meridionally integrated (from Fig. 7e and f, respectively). The contributions of both mechanisms to upwelling (Fig. 8) have a clear annual cycle with a marked semiannual compo-nent. Maximum values occur during October, with 0.23 and 0.14 Sv for coastal divergence and Ekman pumping, respec-tively, while the sum of both is 0.37 Sv. Coastal divergence and Ekman pumping represent 60 and 40 % of the total up-welling, respectively. This indicates that coastal divergence is the stronger upwelling mechanism. However, it should be noted that these values are the sum throughout the region, and these percentages would change if specific sectors were con-sidered especially where Ekman pumping has a larger signif-icance (Fig. 7).
Comparing our estimates with those obtained by Aguirre et al. (2012) from QuikSCAT wind information using a larger region (∼27.5–40◦S), it is observed that coastal divergence
from our study is lower, mainly because they estimated av-erages using only two values every day, which may influ-ence the daily mean and therefore their estimates. Also their analysis did not include the wind drop-off area. The winds used in their study are stronger and so are their estimates for coastal divergence (cf. Fig. 7, Aguirre et al., 2012). How-ever, for Ekman pumping our results are only slightly smaller than theirs. This difference is mainly due to differences in the
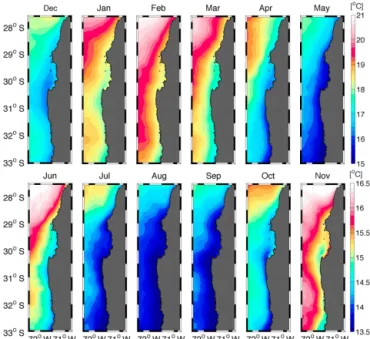
Figure 9.Annual cycle of sea surface temperature obtained using data from the Multi-scale Ultra-high Resolution (MUR). Top and bottom panels used a different color-map scale.
method employed to estimate the vertical upwelling trans-port. In particular they use a length scale (Ld) of 150 km from the coast for their calculation, while in this study a value of 45 km was considered. However, the largest differences in the estimates of the contributions of both mechanisms to to-tal upwelling are in the seasonal variability and the relative contribution to Ekman pumping. The seasonal variability is composed of an annual cycle with a significant semiannual component, whereas that obtained by Aguirre et al. (2012) is rather dominated by the annual cycle. This is because their estimates are based on the average over a larger region that includes the central-southern Chile region, where the wind has a significant annual variability. Moreover, the present re-sults show a higher relative contribution of Ekman pumping to total upwelling in our region. This is partly due to a dif-ferent technique for estimating this mechanism, the use of different wind products and the differences in the length of both study areas.
3.4 Annual variability of Ekman pumping and its relationship with sea surface temperature near the coast
fact that there is a large temporal coherence between Ekman pumping and coastal divergence, preventing a clear identi-fication of Ekman pumping-induced SST anomalies where both processes are in phase. As an attempt to identify regions where Ekman pumping has an imprint on SST, we use the Multi-scale Ultra-high Resolution SST data set (MUR, http: //mur.jpl.nasa.gov) with a spatial resolution of 1 km, which was shown to better capture SST fronts than other products off Peru (Vazquez et al., 2013). Figure 9 shows the annual cycle of the MUR SST. The satellite data were compared to in situ observations that were obtained from 13 thermis-tors positioned close to surface along the coastline between 28 and 32◦S (these observations were obtained by Centro de Estudios Avanzados en Zonas Áridas, Coquimbo, Chile) covering the period September 2009–2012. The correlations obtained between observations and satellite data were high (0.74–0.94; most values were greater than 0.8), and the root mean square between their differences was low varying be-tween 0.54 and 1.3◦C. This provided confidence to use MUR temperatures close to the coast in the spatio-temporal anal-ysis done in the study region. The MUR data showed that south of 28.5◦S there is a persistent surface cooling through-out the year that increases in extent (offshore) from∼10 km
in the northern region to ∼100 km in the southern region.
Within this region there are prominent upwelling centers: Punta Lengua de Vaca (∼30.5◦S), Punta Choros (∼29◦S)
and the region between 30.5 and 33◦S. During most of the year a cold surface tongue extends from the south towards the great system of embayments of Coquimbo (with limits be-tween∼29.25 and 30.25◦S), north of Punta Lengua de Vaca.
A less intense cold surface tongue but with a similar structure is observed north of Punta Loma de Hueso (∼28.8◦S).
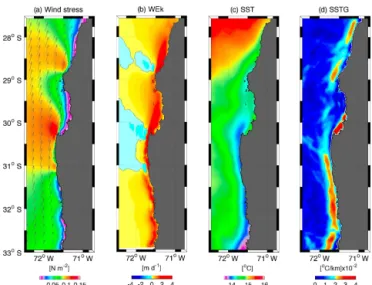
An illustration of the effect of Ekman pumping on SST is presented in Fig. 10, which shows the October mean spa-tial distribution for wind stress, Ekman pumping, SST and SST gradient. This month was selected because the max-imum values of wind stress and increased surface cool-ing are recorded durcool-ing this period. Durcool-ing this month, the wind stress (Fig. 10a) was intense with maximum values of ∼0.15 N m−2, showing a clear zonal gradient (drop-off)
over the entire coastal band of the study area. Note that the maximum wind stress is north of the two most prominent headlands of the region (PLV and LDH), right where the wind abruptly changes direction, creating an intense cyclonic wind curl north of both headlands. As a result of the dis-tribution pattern of the wind stress, wind curl was negative in much of the area of interest, resulting in a positive Ek-man pumping with vertical velocities of up to 4 m d−1near
the coast (Fig. 10b). Also, there are two areas with slightly negative pumping (light blue regions), following the pattern of the wind stress where the wind decreases away from the coast (see the wind vectors), producing a positive curl and a negative Ekman pumping. Moreover, as mentioned above (see Fig. 7), much of the southern spatial structure in Ek-man pumping appears to be associated with the coastal
ter-Figure 10.October mean spatial distribution for(a)wind stress and (b)Ekman pumping using the 4 km grid spacing simulation and (c)sea surface temperature (SST) and(d) SST gradient obtained from MUR observations.
rain and abrupt changes of the coastline. A good example of this is the tongue-shaped structure that extends from the up-welled waters north of Punta Lengua de Vaca entering the Coquimbo Bay system, where the upwelling induced by the Ekman transport seems unaffected (Fig. 7). As a result of a positive Ekman pumping, cold water rises to surface, causing a decrease in sea surface temperatures in a large part of the coastal region (Fig. 10c). However, this cooling is not nec-essarily caused by Ekman pumping throughout the region; there are other processes that would contribute to the surface cooling that will be discussed later. Despite this, the cooling inside the Coquimbo Bay system seems to be caused largely by Ekman pumping. Moreover, outside the Coquimbo Bay system high values (> 2◦C km−1)of the horizontal SST
gra-dient magnitude are distributed in a band near the coast but not attached to it (Fig. 10d) as expected for upwelling fronts. Within the Coquimbo Bay system, there is a homogeneous temperature zone, delimited by a less intense gradient in the west and a greater gradient in the smaller bays of the sys-tem, which coincides with the structure of an Ekman pump-ing tongue projected to the north of Punta Lengua de Vaca.
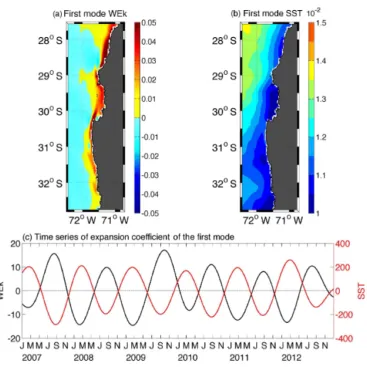
Ek-man pumping and SST respectively. EkEk-man pumping spatial pattern presents maximum values very close to the coast, pri-marily north of Punta Lengua de Vaca, inside the Coquimbo Bay system (29.3–30.2◦S) and north of Punta Choros (28– 29◦S). Also, the pattern is intense near the coast between 30.2◦S (south of PLV) and 32.5◦S. The spatial pattern for SST presented areas with high variability associated with ar-eas of maximum Ekman pumping, highlighting the overall variability in the bay system of Coquimbo and the area north of Loma de Hueso (∼28.8◦S). Moreover, the correlation
be-tween the time series of expansion coefficient was −0.96
(withR2=0.92 and significant at 95 %), indicating a strong inverse relationship, consistent with that expected for a pos-itive pumping with upward vertical velocities that causes a surface cooling in the region. This results in a greater contri-bution to the north of headlands in the region (Punta Lengua de Vaca and Loma de Hueso), even within the Coquimbo Bay system, which is consistent with the results observed in Fig. 7. However, despite the high correlation obtained be-tween both mechanisms within the seasonal scale, we cannot infer a relationship with SST only from Ekman pumping, es-pecially where Ekman transport dominates. Also, other pro-cesses such as the direct effect of wind must play a significant role, e.g. vertical mixing (Renault et al., 2012), or processes related to mesoscale activity (filaments, meanders, eddies, etc.), which are more intense south of Punta Lengua de Vaca (Hormazabal et al., 2004), and/or in general processes related to ocean–atmosphere interaction (Chelton et al., 2007; Re-nault et al., 2015).
Finally, our analysis calls for more thorough study on the temperature response to wind forcing, which should involve oceanic modeling at a resolution high enough to resolve finer-scale processes. The oceanic model could be forced by the high-resolution atmospheric simulations presented in this study, improving in terms of resolution from previous mod-eling efforts in the region (Renault et al., 2012). The use of a high-resolution coupled ocean–atmosphere model would im-prove our understanding of the air–sea interactions along our study region. A plan for the development of such model is under way and will be the focus of our next study.
4 Summary
The spatial and temporal variability (annual cycle) of the coastal divergence and Ekman pumping, as well as their rela-tive contribution to the total upwelling in the central-northern Chile was studied using winds obtained from a nested con-figuration of the WRF model allowing the model to reach 4 km resolution. The simulations showed a cyclonic wind curl (negative) on the coastal-band nearshore and inside the Coquimbo Bay system. This negative wind curl is mainly due to the onshore decay of the wind (wind drop-off), which pre-sented length scales (Ld) between 8 and 45 km with a
sig-nificant latitudinal variability. The wind drop-off scale is in
Figure 11.First SVD mode between Ekman pumping (WEk) from the WRF simulation at 4 km resolution and sea surface temperature (SST) from MUR data.(a)The Ekman pumping spatial compo-nent.(b)The SST spatial component.(c)The black (red) line rep-resents the associated Ekman pumping (SST) time series. Note that the units are arbitrary.
particular larger within 29.25–30.25◦S and to the north of 28.5◦S. When we compared the drop-off scale with other upwelling regions, for example the coast of California (En-riquez and Friehe., 1996; Renault et al., 2015), we find that it is smaller in our study region. For instanceLdranges from 10 and 80 km between 35 and 45◦N (Renault et al., 2015). Despite such difference, the wind stress curl that resulted from this zonal wind shear generated Ekman pumping with a marked seasonality and vertical velocities at the surface that reached 4 m d−1, values comparable to those observed in the California Current system.
When comparing the seasonal contribution of coastal di-vergence and Ekman pumping to the coastal upwelling trans-port in central-northern Chile, we find that there is a high sea-sonal coherence between the two mechanisms (> 0.8) with a maximum during spring. However, despite this high seasonal correlation there is a spatial alternation between them; that is, where one is intense the other is weak. This pattern seems to be the result of a close relationship between the topography of the coast, the shape of the coastline and the spatial scale of the wind drop-off. From this information we defined three scenarios that could explain the pattern of upwelling in the area.
Prevalence of positive Ekman pumping is associated with largeLd, observed in regions such as the Coquimbo Bay
There is a prevalence of coastal divergence with smaller values of Ld and more intense winds near the coast. This is observed in sectors characterized by a low topography and the presence of headlands as Punta Lengua de Vaca and Punta Choros.
There is a combination of both mechanisms in which nei-ther divergence nor coastal Ekman pumping dominated over the other. This takes place to the south of 31.5◦S.
The three-dimensional aspect of the coastal circulation in the region of interest (Aguirre et al., 2012) prevents a clear identification of the role of each process on SST variability, although our SVD analysis reveals areas where the similar-ity of the patterns of Ekman pumping and SST suggests a privileged forcing mechanism like within the Coquimbo Bay system and the area north of Loma de Hueso (∼28.8◦S).
Further studies based on the experimentation with a regional oceanic model should be carried out to better identify up-welling regimes by, for instance, using the model winds doc-umented here at different seasons to mimic changes in the drop-off. Considering the rich marine ecosystem hosted by the region (Thiel et al., 2007) our interest is in relating as-pects of the meso- to sub-mesoscale circulation (eddies and filaments) to the processes documented in this study. This is planned for future work.
Finally, the model allowed for an estimate of the nearshore (coastal fringe of ∼50 km) low-level circulation and
evi-dences fine-scale structure of the wind stress curl that can-not be estimated from satellite observations. Considering the overall realism of the model simulation, our study could be used to guide field experiments and gather in situ measure-ments in order to gain further knowledge in the processes that constrain such features.
Acknowledgements. This work was financed by Postdoctoral
FONDECYT/Chile no. 3130671 and support from Centro de Estudios Avanzados en Zonas Áridas (CEAZA), Coquimbo, Chile. Marcel Ramos, Luis Bravo and Boris Dewitte acknowledge support from FONDECYT (project 1140845) and Chilean Millennium Initiative (NC120030). Boris Dewitte and Marcel Ramos acknowl-edge support from FONDECYT (project 1151185). CNES (Centre National d’Etudes Spatiales, France) is thanked for financial sup-port through the OSTST project EBUS-South. Katerina Goubanova was supported by IRD. The contribution from two reviewers and the editor is deeply appreciated; their comments and suggestions improved and enhanced this study.
Edited by: J. M. Huthnance
Reviewed by: C. Aguirre and one anonymous referee
References
Aguirre, C., Pizarro, O., Strub, P. T., Garreaud, R., and Barth, J. A.: Seasonal dynamics of the near-surface along-shore flow off central Chile, J. Geophys. Res., 117, C01006, doi:10.1029/2011JC007379, 2012.
Archer, C. L. and Jacobson, M. Z.: The Santa Cruz Eddy. Part II: Mechanisms of Formation, Mon. Weather Rev., 133, 2387–2405, 2005.
Bakun, A.: Coastal upwelling indices, west coast of North Amer-ica, 1946–1971, US Dep. Commer., NOAA Tech. Rep., NMFS SSRF-671, 103 pp., 1973.
Bakun, A. and Nelson, C.: The seasonal cycle of wind stress curl in subtropical Eastern boundary current regions, J. Phys. Oceanogr., 21, 1815–1834, 1991.
Bane, J. M., Levine, M. D., Samelson, R. M., Haines, S. M., Meaux, M. F., Perlin, N., Kosro, P. M., and Boyd, T.: At-mospheric forcing of the Oregon coastal ocean during the 2001 upwelling Season, J. Geophys. Res., 110, C10S02, doi:10.1029/2004JC002653, 2005.
Beljaars, A. C. M.: The parameterization of surface fluxes in large-scale models under free convection, Q. J. Roy. Meteorol. Soc., 121, 255–270, 1994.
Bretherton, C. S. and Park, S.: A new moist turbulence parame-terization in the Community Atmosphere Model, J. Climate, 22, 3422–3448, 2009.
Burk, S. D. and Thompson, W. T.: The summertime low-level jet and marine boundary layer structure along the California coast, Mon. Weather Rev., 124, 668–686, 1996.
Cambon, G., Goubanova, K., Marchesiello, P., Dewitte, B., Illig, S., and Echevin, V.: Assessing the impact of downscaled winds on a regional ocean model simulation of the Humboldt system, Ocean Model., 65, 11–24, 2013.
Capet, X. J., Marchesiello, P., and McWilliams, J. C.: Upwelling re-sponse to coastal wind profiles, Geophys. Res. Lett., 31, L13311, doi:10.1029/2004GL020123, 2004.
Chelton, D. B., Schlax, M. G., and Samelson, R. M.: Summer-time coupling between sea surface temperature and wind stress in the California Current System, J. Phys. Oceanogr., 37, 495–517, 2007.
Dyer, A. J. and Hicks, B. B.: Flux–gradient relationships in the con-stant flux layer, Q. J. Roy. Meteorol. Soc., 96, 715–721, 1970 Edwards, K. A., Rogerson, A. M., Winant, C. D., and Rogers, D.
P.: Adjustment of the marine atmospheric boundary layer to a coastal cape, J. Atmos. Sci., 58, 1511–1528, 2001.
Enriquez, A. G. and Friehe, C. A.: Effects of Wind Stress and Wind Stress Curl Variability on Coastal Upwelling, J. Phys. Oceanogr., 25, 1651–1671, 1996.
Estrade, P., Marchesiello, P., Colin de Verdiere, A., and Roy, C.: Cross-shelf structure of coastal upwelling: A two-dimensional expansion of Ekman’s theory and a mechanism for inner shelf upwelling shut down, J. Mar. Res., 66, 589–616, 2008.
Garreaud, R. and Muñoz, R.: The low-level jet off the subtropi-cal west coast of South America: Structure and variability, Mon. Weather Rev., 133, 2246–2261, 2005.
Garreaud, R., Rutllant, J., Muñoz, R., Rahn, D., Ramos, M., and Figueroa, D.: VOCALS-CUpEx: The Chilean Upwelling Experi-ment, Atmos. Chem. Phys., 11, 2015–2029, doi:10.5194/acp-11-2015-2011, 2011.
Gill, A. E.: Atmosphere–ocean dynamics, International Geophysics Series, 30, 403 pp., 1982.
Halpern, D.: Measurements of near-surface wind stress over an up-welling region near the Oregon coast, J. Phys. Oceanogr., 6, 108– 112, 1976.
Halpern, D.: Offshore Ekman transport and Ekman pumping off Peru during the 1997–1998 El Niño, Geophys. Res. Lett., 29, 1075, doi:10.1029/2001GL014097, 2002.
Hayes, S. P., McPhaden, M. J., and Wallace, J. M.: The influence of sea surface temperature on surface wind in the eastern equatorial Pacific: weekly to monthly variability, J. Climate, 2, 1500–1506, 1989.
Hong, S. Y. and Lim, J. O.: The WRF single – moment 6 – class microphysics scheme (WSM6), J. Korean Meteor. Soc., 42, 129– 151, 2006.
Hormazabal, S., Shaffer, G., and Leth, O.: Coastal tran-sition zone off Chile, J. Geophys. Res., 109, C01021, doi:10.1029/2003JC001956, 2004.
Horvath, K., Koracin, D., Vellore, R., Jiang, J., and Belu, R.: Sub-kilometer dynamical downscaling of near-surface winds in com-plex terrain using WRF and MM5 mesoscale models, J. Geo-phys. Res., 117, D11111, doi:10.1029/2012JD017432, 2012. Iacono, M. J., Delamere, J. S., Mlawer, E. J., Shephard, M.
W., Clough, S. A., and Collins, W. D.: Radiative forcing by long–lived greenhouse gases: Calculations with the AER radiative transfer models, J. Geophys. Res., 113, D13103, doi:10.1029/2008JD009944, 2008
Jacox, M. G. and Edwards, C. A.: Upwelling source depth in the presence of nearshore wind stress curl, J. Geophys. Res., 117, C05008, doi:10.1029/2011JC007856, 2012.
Janjic, Z. I.: Comments on “Development and evaluation of a con-vection scheme for use in climate models”, J. Atmos. Sci., 57, 3686–3686, 2000.
Jin, X., Dong, C., Kurian, J., McWilliams, J. C., Chelton, D. B., and Li, Z.: SST-Wind Interaction in Coastal Upwelling: Oceanic Simulation with Empirical Coupling, J. Phys. Oceanogr. 39, 2957–2970, 2009.
Kalnay, E., Kanamitsu, M., Kistler, R., Collins, W., Deaven, D., Gandin, L., Iredell, L., Saha, S., White, G., Woollen, J., Zhu, Y., Chelliah, D.C. M., Ebisuzaki, W., Higgins, W., Janowiak, J., Mo, K. C., Ropelewski, C., Wang, J., Leetmaa, A., Reynolds, R., Jenne, R., and Joseph, D.: The NCEP/NCAR 40-Year Re- analy-sis Project, B. Am. Meteor. Soc., 77, 437–471, 1996.
Koraˇcin, D., Dorman, C. E., and Dever, E. P.: Coastal Perturbations of Marine-Layer Winds, Wind Stress, and Wind Stress Curl along California and Baja California in June 1999, J. Phys. Oceanogr., 34, 1152–1173, 2004.
Lo, J. C.-F., Yang, Z.-L., and Pielke, R. A. S.: Assessment of three dynamical climate downscaling methods using the Weather Re-search and Forecasting (WRF) model, J. Geophys. Res., 113, D09112, doi:10.1029/2007jd009216, 2008.
Marchesiello, P. and Estrade, P.: Upwelling limitation by geostrophic onshore flow, J. Mar. Res., 68, 37–62, 2010. Marchesiello P., Lefevre, L., Vega, A., Couvelard, X., and Menkes,
C.: Coastal upwelling, circulation and heat balance around New Caledonia’s barrier reef, Mar. Poll. Bull., 61, 432–448, 2010. Mellor, G. L.: Numerical simulation and analysis of the mean
coastal circulation off California, Cont. Shelf Res., 6, 689–713, 1986.
Moraga-Opazo, J., Valle-Levinson, A., Ramos, M., and Pizarro-Koch, M.: Upwelling-Triggered near-geostrophic recirculation in
an equatorward facing embayment, Cont. Shelf Res., 31, 1991– 1999, 2011.
Muñoz, R. and Garreaud, R.: Dynamics of the low-level jet off the subtropical west coast of South America, Mon. Weather Rev., 133, 3661–3677, 2005.
Nelson, C. S.: Wind stress and wind-stress curl over the Califor-nia Current, NOAA Tech. Rep., NMFS SSRF-714, US Dept. of Commerce, 87 pp., 1977.
Paulson, C. A.: The mathematical representation of wind speed and temperature profiles in the unstable atmospheric surface layer, J. Appl. Meteor., 9, 857–861, 1970.
Perlin, N., Skyllingstad, E., Samelson, R., and Barbour, P.: Numer-ical simulation of air-sea coupling during coastal upwelling, J. Phys. Oceanogr., 37, 2081–2093, 2007.
Perlin, N., Skyllingstad, E. D., and Samelson, R. M.: Coastal atmo-spheric circulation around an idealized cape during wind-driven upwelling studied from a coupled ocean-atmosphere model, Mon. Weather Rev., 139, 809–829, 2011.
Pickett, M. and Paduan, J. D.: Ekman transport and pumping in the California Current based on the US Navy’s high-resolution at-mospheric model (COAMPS), J. Geophys. Res., 108, C103327, doi:10.1029/2003JC001902, 2003.
Rahn, D. and Garreaud, R.: A synoptic climatology of the near-surface wind along the west coast of South America, Int. J. Cli-matol., 34, 3628–3647, doi:10.1002/joc.3724, 2013.
Rahn, D. A., Garreaud, R., and Rutllant, J.: The low-level at-mospheric circulation near Tongoy Bay/point Lengua de Vaca (Chilean coast 30◦S), Mon. Weather Rev., 139, 3628–3647, 2011.
Renault, L., Dewitte, B., Falvey, M., Garreaud, R., Echevin, V., and Bonjean, F.: Impact of atmospheric coastal jet off central Chile on sea surface temperature from satellite ob-servations (2000–2007), J. Geophys. Res., 114, C08006, doi:10.1029/2008JC005083, 2009.
Renault, L., Dewitte, B., Marchesiello, P., Illig, S., Echevin, V., Cambon, G., Ramos, M., Astudillo, O., Minnis, P., and Ayers, J. K.: Upwelling response to atmospheric coastal jets off central Chile: A modeling study of the October 2000 event, J. Geophys. Res., 117, C02030, doi:10.1029/2011JC007446, 2012.
Renault, L., Hall, H., and McWilliams, J. C.: Orographic shaping of US West Coast wind profiles during the upwelling season, Clim. Dynam., 46, 273–289, doi:10.1007/s00382-015-2583-4, 2015. Rutllant, J. and Montecino, V.: Multiscale upwelling forcing cycles
and biological response off north-central Chile, Rev. Chil. Hist. Nat., 75, 217–231, 2002.
Rutllant, J. A., Muñoz, R. C., and Garreaud, R. D.: Meteorologi-cal observations on the northern Chilean coast during VOCALS-REx, Atmos. Chem. Phys., 13, 3409–3422, doi:10.5194/acp-13-3409-2013, 2013.
Shaffer, G., Hormazabal, S., Pizarro, O., Djurfeldt, L., and Sali-nas, S.: Seasonal and interannual variability of currents and tem-perature over the slope off central Chile, J. Geophys. Res., 104, 29951–29961, 1999.
Skamarock, W. C. and Klemp, J. B.: A time-split nonhydrostatic atmospheric model for weather research and forecasting applica-tions, J. Comput. Phys., 227, 3465–3485, 2008.
over ocean fronts and eddies, Dynam. Atmos. Oceans, 45, 274– 319, 2008.
Smith, R. L.: Upwelling, Oceanogr. Mar. Biol., 6, 11–46, 1968. Stark, J. D., Donlon, C. J., Martin, M. J., and McCulloch, M. E.:
OSTIA: An operational, high resolution, real time, global sea surface temperature analysis system, Oceans 2007 IEEE Ab-erdeen, conference proceedings, Marine challenges: coastline to deep sea, Aberdeen, Scotland, IEEE, 2007.
Strub, P. T., Montecino, V., Rutllant, J., and Salinas, S.: Coastal ocean circulation off western south America, in: The Sea, The Global Coastal Ocean: Regional Studies and Syntheses, edited by: Robinson, A. R. and Brink, K. H., John Wiley, New York, 11, 273–314, 1998.
Sverdrup, H. U.: Wind-driven currents in a baroclinic ocean, with application to the equatorial currents of the eastern Pacific, P. Natl. Acad. Sci. USA, 33, 318–326, 1947.
Tewari, M., Chen, F., Wang, W., Dudhia, J., LeMone, M. A., Mitchell, K., Gayno, M. Ek, G., Wegiel, J., and Cuenca, R. H.: Implementation and verification of the unified NOAH land sur-face model in the WRF model. 20th conference on weather anal-ysis and forecasting/16th conference on numerical weather pre-diction, 11–15, 2004
Thiel, M., Macaya, E., Acuña, E., Arntz, W. E., Bastias, H., Broko-rdt, K., Camus, P. A., Castilla, J. C., Castro, L. R., Cortés, M., Dumont, C. P., Escribano, R., Fenández, M., Gajardo, J. A., Gaymer, C. F., Gómez, I., González, A. E., González, H., Haye, P. A., Illanes, J. C., Iriarte, J. L., Lancellotti, D. A., Luna-Jorquera, G., Luxoro, C., Manriquez, P. H., Marín, V., Muñoz, P., Navarrete, S. A., Perez, E., Poulin, E., Sellanes, J., Sepúlveda, H. H., Stotz, W., Tala, F., Thomas, A., Vargas, C. A., Vasquez, J. A., and Vega, J. M. A.: the Humboldt Current System of Northern-Central Chile Oceanographic Processes, Ecological Interactions, edited by: Gibson, R. N., Atkinson, R. J. A., and Gordon, J. D. M., Oceanogr. Mar. Biol., 45, 195–344, 2007.
Toniazzo, T., Sun, F., Mechoso, C. R., and Hall, A.: A regional modeling study of the diurnal cycle in the lower troposphere in the south-eastern tropical Pacific, Clim. Dynam., 41, 1899–1922, 2013.
Vazquez-Cuervo, J., Dewitte, B., Chin, T. M., Amstrong, E., Purca, S., and Alburqueque, E.: An analysis of SST gradient off the Pe-ruvian coast; The impact of going to higher resolution, Remote Sens. Environ., 131, 76–84, 2013.
Venegas, S. A, Mysak, L. A., and Straub, D. N.: Atmosphere-Ocean Coupled Variability in the South Atlantic, J. Climate, 10, 2904– 2920, 1997.
Wallace, J., Mitchell, T., and Deser, C.: The influence of sea-surface temperature on surface wind in the eastern equatorial Pacific: Seasonal and interannual variability, J. Climate, 2, 1492–1499, 1989.
Webb, E. K.: Profile relationships: The log-linear range, and exten-sion to strong stability, Q. J. Roy. Meteor. Soc., 96, 67–90, 1970. Winant, C. D., Dorman, C. E., Friehe, C. A., and Beardsley, R. C.: The marine layer off Northern California: an example of super-critical channel flow, J. Atmos. Sci., 45, 3588–3605, 1988. Wood, R., Mechoso, C. R., Bretherton, C. S., Weller, R. A., Huebert,
B., Straneo, F., Albrecht, B. A., Coe, H., Allen, G., Vaughan, G., Daum, P., Fairall, C., Chand, D., Gallardo Klenner, L., Garreaud, R., Grados, C., Covert, D. S., Bates, T. S., Krejci, R., Russell, L. M., de Szoeke, S., Brewer, A., Yuter, S. E., Springston, S. R., Chaigneau, A., Toniazzo, T., Minnis, P., Palikonda, R., Abel, S. J., Brown, W. O. J., Williams, S., Fochesatto, J., Brioude, J., and Bower, K. N.: The VAMOS Ocean-Cloud-Atmosphere-Land Study Regional Experiment (VOCALS-REx): goals, plat-forms, and field operations, Atmos. Chem. Phys., 11, 627–654, doi:10.5194/acp-11-627-2011, 2011.
Xie, S. P.: Satellite observations of cool ocean-atmosphere interac-tion, B. Am. Meteorol. Soc., 85, 195–208, 2004.