Revista
de
Administração
http://rausp.usp.br/ RevistadeAdministração52(2017)36–46
Sustainability
Eco-innovation
and
technological
cooperation
in
cassava
processing
companies:
structural
equation
modeling
Eco-inova¸cão
e
coopera¸cão
tecnológica
em
indústrias
processadoras
de
mandioca:
modelagem
de
equa¸cões
estruturais
Eco-innovación
y
cooperación
tecnológica
en
industrias
de
procesamiento
de
yuca:
modelos
de
ecuaciones
estructurales
Eliana
Cunico
a,∗,
Claudia
Brito
Silva
Cirani
b,
Evandro
Luiz
Lopes
b,c,
Charbel
José
Chiapetta
Jabbour
daFaculdadeSulBrasil,Toledo,PR,Brazil bUniversidadeNovedeJulho,SãoPaulo,SP,Brazil cUniversidadeFederaldeSãoPaulo,Osasco,SP,Brazil dUniversityofStirling,StirlingManagementSchool,Scotland,UK
Received6October2015;accepted27June2016 Availableonline10October2016
Abstract
Thegenerationofwealth,sustainedbyproductiveactivitiesof agro-industries,leadsto theproductionofwastesanduses naturalresources, interferingintheenvironmentalpillarofsustainability.Thepurposeofthisstudyistoinvestigatewhethercassavaprocessingcompaniesgenerate eco-innovationsbymeansoftechnologicalcooperation,andthedegreeofparticipationofagentsintheseinteractions.Thequantitativemethod usedthestructuralequationmodelingfordataanalyses.Theresultsindicatedarelationshipbetweentechnologicalcooperationandthegeneration ofeco-innovation.Themodeldevelopedshowedthesignificancebetweenvariablesandexposedthemainaspectsthatgenerateeco-innovation fromtechnologicalcooperation.Acooperationprocessallowsareductionintheburningoffossilfuels,reducingtheemissionofmethanegas, whichaggravatesthegreenhouseeffect,alsoreducingodor,andultimately,providingfinancialgainstoagribusiness.
©2016DepartamentodeAdministrac¸˜ao,FaculdadedeEconomia,Administrac¸˜aoeContabilidadedaUniversidadedeS˜aoPaulo–FEA/USP. PublishedbyElsevierEditoraLtda.ThisisanopenaccessarticleundertheCCBYlicense(http://creativecommons.org/licenses/by/4.0/).
Keywords: Structuralequationmodeling;Agro-industry;Cleanerproduction;Technologicalcooperation
Resumo
Agerac¸ãoderiqueza,sustentadapelasatividadesprodutivasdasagroindústrias,levaàproduc¸ãoderesíduoseutilizaosrecursosnaturais,interferindo nopilarambientaldasustentabilidade.Oobjetivodesteestudoéinvestigarseasempresasprocessadorasdemandiocageramecoinovac¸õespor meiodecooperac¸ãotecnológicaeograudeparticipac¸ãodosagentesnessasinterac¸ões.Ométodoquantitativo,utilizou-sedaModelagemde Equac¸õesEstruturaisparaanálisededados.Osresultadosindicaramumarelac¸ãoentreacooperac¸ãotecnológicaeagerac¸ãodeecoinovac¸ão.O modelodesenvolvidomostrouasignificânciaentrevariáveiseexpôsosprincipaisaspectosquepromovemaecoinovac¸ãoapartirdacooperac¸ão.
∗Correspondingauthorat:AvenidaMinistroCirneLima,2565,85.903-590Toledo,PR,Brazil.
E-mail:[email protected](E.Cunico).
PeerReviewundertheresponsibilityofDepartamentodeAdministrac¸ão,FaculdadedeEconomia,Administrac¸ãoeContabilidadedaUniversidadedeSãoPaulo –FEA/USP.
http://dx.doi.org/10.1016/j.rausp.2016.09.006
Oprojetodecooperac¸ãopermitiuareduc¸ãonaqueimadecombustíveisfósseis,areduc¸ãonaemissãodegásmetanoqueagravaoefeitoestufa,a reduc¸ãodoodore,finalmente,proporcionouganhosfinanceirosparaoagronegócio.
©2016DepartamentodeAdministrac¸˜ao,FaculdadedeEconomia,Administrac¸˜aoeContabilidadedaUniversidadedeS˜aoPaulo–FEA/USP. PublicadoporElsevierEditoraLtda.Este ´eumartigoOpenAccesssobumalicenc¸aCCBY(http://creativecommons.org/licenses/by/4.0/).
Palavras-chave:ModelagemdeEquac¸õesEstruturais;Agroindústrias;Produc¸ãolimpa;Cooperac¸ãotecnológica
Resumen
Lageneraciónderiqueza,oriundadelasactividadesproductivasdelaagroindustria,conducealaproducciónderesiduosyelusodelosrecursos naturales,loqueinterfiereconelpilarmedioambientaldelasostenibilidad.Elobjetivoenesteestudioesinvestigarsilasempresasprocesadoras deyucaproduceneco-innovacionespormediodelacooperacióntecnológicayelgradodeparticipacióndelosagentesenestasinteracciones.Se utilizóelmétodocuantitativo,pormediodemodelosdeecuacionesestructurales,paraelanálisisdedatos.Losresultadosindicaronunarelación entrelacooperacióntecnológicaylacreacióndeeco-innovación.El modelodesarrollado mostró significanciaentrevariablesydelineólos principalesaspectosquepromuevenlaeco-innovaciónapartirdelacooperación.Elproyectodecooperaciónpermitelareduccióndelaquemade combustiblesfósiles;lareducciónenlaemisióndegasmetanoqueagravaelefectoinvernadero;lareduccióndelolory,finalmente,proporciona gananciasfinancierasparalaagroindustria.
©2016DepartamentodeAdministrac¸˜ao,FaculdadedeEconomia,Administrac¸˜aoeContabilidadedaUniversidadedeS˜aoPaulo–FEA/USP. PublicadoporElsevierEditoraLtda.Esteesunart´ıculoOpenAccessbajolalicenciaCCBY(http://creativecommons.org/licenses/by/4.0/).
Palabrasclave: Modelosdeecuacionesestructurales;Agroindustria;Producciónlimpia;Cooperacióntecnológica
Introduction
Thedecreaseinthelifecycleofproductsincreasedtherange andspeed of changes in the portfolio of goods andservices offeredtoconsumers.Thus,productionprocessesalso under-wentchangesandinnovationbecameaninfluentialfactorinthe paceofthesechanges.Theminimumrequirementforachange ofaproductorprocesstobeconsideredaninnovationconcerns therecognitionofthisrequirementasanovelty.Forthenovelty tobeconsideredinnovative,significantchangesintheproduct orprocessshouldbemadeinrelationtotheproductandprocess currentlypracticedinthemarket(OCDE,2005).
Inadditiontoproductionandconsumptionchanges,thereis acontinuousconcernwithsustainability.Intheenvironmental aspects,effortsaremadetoavoidormitigatenegativeimpacts withouthinderingeconomicdevelopmentusingnew technolo-gies,fromeco-innovations.Theterm“eco-innovation”appears intheBrazilianliteratureindifferentways,forexample,“eco innovation”,“eco-innovation”,“environmentalinnovation”and “ecoinnovation”.Inthisstudy,theterm “eco-innovation”was adoptedasastandard.ThebookofFussler andJames(1996)
pioneeredtheconceptofeco-innovation.Thethemereappears in a study of James (1997), where it is defined as the eco-innovationabilitytoinnovateinproductsandserviceswithout causingenvironmentalimpactanddamage.Basedonthis con-cept,companiesbegantoseekcompetitiveadvantagesandadd valuetonewformsofcleanerproduction.
Faced with proposals for sustainability, Lozano (2008, p.
1839)affirmstheimportanceofsustainabledevelopment,
“Sus-tainable Development involves the simultaneous pursuit of economicprosperity,environmentalquality,andsocialequity”. Giventheseinterestscomestechnologycooperation.
The phenomenon of cooperation is organized through the National InnovationSystems (NIS)to ensurethat each agent assumesitsrolewiththecommonobjectivegearedforeconomic
developmentfrominnovations(Baerz,Abbasnejad,Rostamy,&
Azar,2011).Thestrategiesadoptedbycompaniesinthesearch
for innovations have undergone significant changes inrecent yearsgeneratingnewperspectivestoconventionalmanagement models (Bueno & Balestrin, 2012). Therefore, technological cooperationbecomes one wayto developinnovations (Baerz
etal.,2011).
The objective of this research is to investigate whether agro-industriesgenerateeco-innovationsthroughtechnological cooperation,analyzingalsothedegreeofparticipationofeach of the agents,university,companies andgovernmentinthese interactions. The model that defines the interactionsbetween agentsinthecooperationprocessusedinthisstudyisbasedon theTriple-Helixmodel,whichadvocatespartnershiprelations, leadingtheuniversityandenterprisestoworktogetherfor the sameobjective(Etzkowitz&Leydesdorff,2000).In this con-text, the research seeks to contribute tothe discussion about eco-innovation,anditisapro-activeorreactiveconsequencein relationtothepreventionortreatmentofenvironmentalimpacts generatedbybio-digestersusedintheindustryofstarch,flours and starches processing companies (Angelidaki et al., 2009;
Deublein&Steinhauser,2008;Kocar,2008).
andtheDominicanRepublic(17.6%)(CEPEA-ESALQ,2013). This research focuses on the segment of the agricultural industriesofParanáState,Brazil,whichprocesscassava,known asstarch,floursandstarchesprocessingcompanies.According tothereportreleasedbyCEPEA-ESALQ(2013)on compara-tivefiguresfor2010and2011,thestateofParanáremainedthe mainproducerofcassavastarchin2011inBrazil,generating 70.5%ofthetotalproducedinthecountry,similartothe sce-narioin2010.Theseprocessorsprocesscassavaintostarchand itsderivatives,generatingwastes.Someprocessorsencourage the improvementof innovativeproduction methods,emission reducersthatareabletoreducecosts(Jaffe&Palmer,1997).
Thisstudygreatlycontributestotheenhancementof scien-tificresearchonstakeholdersofinterferenceinthedevelopment of eco-innovations in industries, presenting tangible benefits throughatechnicalcooperationproject.
Inadditiontothisintroduction,thesecondsectionpresents the theoreticalframework thataddresses issuessuch as inno-vation, technologicalcooperationand NIS aspects.The third section includesthemethodused toobtainthe results,which willbepresentedanddiscussedinthefourthsection.Themain findingsofthestudyareshowninthefifthsection.
Theoreticalframework
TechnologicalcooperationandBrazilianNIS
Dosi(1988)characterizesinnovationasaprocessofsearch,
discovery, experimentation,development, imitationand adop-tion of new products, processes and new organizational techniques.Inamorepositivistperspective,forTidd,Bessant,
andPavitt (2008),innovation is abusiness advantageable to
mobilizeknowledge,technologicaladvancesandinnovationsin theprovisionofproductsandservices.
Innovationsgeneratecost reductions,gains inproductivity andqualitybycreatingthepotentialforextraordinaryprofitsto entrepreneurs;however,itpresentshighrisks,becauseitdisplays independentchallenges(Quandt,2012).
Innovationsurveysinseveralcountriesarefairlyrichinterms of quantity and scope of variables investigated. In the con-textofanalysisofpossibilitiesbrought bythesestudies,there areattributesoftheinnovativeprocess,suchastheinnovation degree,thatcanbeconsideredanindicatorofinnovationquality. Thisconceptispartofthetheoreticalandmethodological crite-riatocharacterizetheinnovativeperformanceofenterprisesin aneconomy.Forexample,innovationsurveyinEurope– Com-munityInnovationSurvey(CIS)conductedbyEurostat(2016), aswellasInnovationResearch–PINTECperformedinBrazil bythe BrazilianInstituteofGeography andStatistics(IBGE, 2016),bothbasedontheOsloManual(OCDE,2005),explore thisattribute–radicaleco-innovation,meaningthatinthecase of the product, whetherit isnew totheworld market,tothe nationalmarket,ornewonlytothecompanyitself.Inthecase ofprocess,whetheritisnewtothenationalindustry,tothe indus-tryinglobalterms,oriftheprocessisnewtothecompanyitself. Thus,radicalinnovationsforthesectorwillbeconsidered“high
innovationrate”andincrementalinnovationsforthesectorwill becalled“lowinnovationrate”.
Therearethreepossibleformsoftechnologicalcooperation capableofcontributingwithsmallandmedium-sizedenterprises tobecomemoreinnovative:(i)cooperationbetweenenterprises, (ii)cooperationwiththegovernment,and(iii)cooperationwith researchinstitutions(Najib&Kiminami,2011).Thereare basi-cally two lines that address the cooperation process. One is formed by authorswho considerthe separation between uni-versityandcompany,duetoconflictingobjectives.Thefirstline concernsthemodelofSábatoTriangle(Plonski,1995).Sábato
andBotana(1968),formulatedthethreeagentsbasedona
tri-angle,emphasizingthegovernmentintheuppervertexandthe universityandcompanyasbaseelementsofcooperation.Onthe otherhand,Etzkowitz(1998)defendstheTriple-Helixmodel, in whichunlike the Sábato Trianlge,there isconvergence of objectivesandrelationshipbetweentheuniversityandcompany. Inlightofthischangeofcontext,inwhichthecompanydoes notconsideronlyitsinternalenvironment,seekingpotentialto innovate,Chesbrough(2003)classifiestheclosedmodelof inno-vation as avertical control. The open model, defined by the author as “openinnovation”,aroseas a resultof four factors responsiblefordeterringtheclosedmodel:(1) theincreasein thenumberofundergraduatesandgraduates,formingqualified workforce;(2)thegrowingnumberofqualifiedpeoplewithjob mobility;(3)theproliferationofcompaniesspecializedin devel-opingnewbusinesses,technologytransferandmarketresearch; (4) thereductionof thelifetime oftechnologiesandthefierce competitionofglobalizedcompanies.KingandLakhani(2013, p.48)reportabroadviewofopeninnovationintheirfindings, concludingthat“openinnovationmightnotbetherightapproach foreverycompany,butmanyorganizationscanbenefitfromit. Thekeytosuccessiscarefulconsiderationofwhattoopen,how toopenitandhowtomanagethenewproblemscreatedbythat openness”.
TheopeninnovationmodelofChesbrough(2003)isameans, forexample,bywhichbusinessesorganizethemselvestoseek sourcesofinnovation,frompartnershipswithuniversitiesand researchinstitutes.Higher educationinstitutions have,among others, the purpose of advancing on the knowledge frontier, along with the necessities for basic research of enterprises.
Chesbrough,Vanhaverbeke,andWest(2006)reportopen
inno-vation as aresult of anewparadigm review, concluding that openinnovationsuggeststhatinventiveoutputfromwithinthe enterprise notberestrictedtothecurrent businessmodel,but instead,havetheopportunitytogotomarketthroughavariety ofchannels.
However,littlecommitmentisobservedfromcompaniesand universitiestoestablishconsistentandorganizedrelationships basedoncooperationtogenerateinnovations.Theconcept of “interactivelearning”definesthecapacityofanorganizationto transmitandreceiveknowledge,translatedastrainingprograms
(Institutode PesquisaEconômica Aplicada,2005).ForBaerz
etal.(2011),thecoordinationchannelsforcooperationbetween
Openinnovationgeneratesadiversityofoptionsand, there-fore, Minshall, Seldon, and Probert (2007) consider that the external sources for innovation can vary, such as suppliers, customers, strategic partners, universities, research institutes andstart-ups.However,universitiesandresearchinstitutesdo notknowthepotentialcustomerandmarketneeds,requiring, thus,partnershipswithenterprisestoachieveindustrialambition
(Feng,Ma,Zhang,&Du,2013).
ThelinkbetweenuniversityandcompanythroughtheNIS structure faces different hurdles, due to different regional or evenstructural interests (Manzini, 2012). The fact is that by overcomingsomedifficulties,theresultscanbebeneficial.Itis importanttopromoteactionsfor universities,intheir innova-tionprocesses,tobeabletomeetthepurposesoforganizational investment. Feng et al. (2013, p. 47) conclude that “while inthepre-market cooperationmodelikecooperationdevelop, jointestablishentities,andcooperationtechnologyventure,the researchinstitutions andenterprisehaveafrequent andclose relationship, and communication of information interaction, throughwhichtheknowledgecanbecreatedandcommunicated bytheendeavorofbothsides”.
Theconcept of the National Innovation System(NIS) can beunderstoodasaformoforganizationthatfacilitates cooper-ation.Lundvall (1988), Freemann (1997)and Nelson (1993)
conceptualize the NIS as systems characterized by different patterns of cooperation. In a review of the origins of NIS,
FagerbergandSapprasert(2013)assignanewbranchof
litera-tureoninnovation,called“NationalInnovationSystems”(NIS), inPortuguese(SNI),aconceptdevelopedprimarilybyFreeman
(1987),Lundvall(1988)andNelson(1993),recognizedas
pre-cursorsoftheconcept.
For Fagerberg, Mowery, and Verspagen (2009), the NIS
doesnotcoveronlyinnovativecompanies,butalllearningand innovationcapacityofacountryconsideringorganizations, uni-versitiesandresearchinstitutesinthepursuitandapplicationof knowledge.Fengetal.(2013)attributetotheemergence and developmentofknowledge-basedeconomytheneedforgreater agilityinlaunchingproductsandtechnologies,inwhich univer-sitiesand research instituteshave an important role to assist in the development and competitiveness of NIS. Bueno and
Balestrin(2012,apudReed, Storrud-Barnes,&Jessup,2012,
p.69)emphasizethat“cooperationallowsideasfromanouter environmenttostrengthentheinnovationperformanceof enter-prises”.
The government’s role as coordinator of the interaction process between the university and enterprise is crucial for
Baerz et al. (2011), since the university and industry
gener-ate intensive activities for the sustainable development of a country, which must be managed and organized to produce the interaction. Such agents constitute the triad of company, university, and government with well-defined roles in the NIS.
Theresearchhypotheseswerebasedontheliteraturereview, inwhichH1 wasdivided initiallyinto a,b andc.H1 willbe usedtoverifytheexistenceofinterferencefromexternalagents according to the Triple-Helix model:government incentives, enterprisesanduniversities.
H1.a. Thereis positive relationshipbetweenincentives and governmentpolicies andincreasing technologicalcooperation inagro-industries.
H1.b. There is positive relationshipbetween the enterprise and/or partner enterprisesand increasing technological coop-erationinagro-industries.
H1.c. Thereispositiverelationshipbetweenuniversitiesand researchinstitutesandincreasingtechnologicalcooperationin agro-industries.
Additionalhypothesesalsorefertotheprocessof technolog-icalcooperation,seekingtoverifytheexistenceofinterference of otheragents mentionedin contemporaryliteratureand the degreeoftheirparticipationinthesystemicflowofcooperation.
H1.d. There is positive relationship between clients and consumers andincreasing technologicalcooperation in agro-industries.
H1.e. There is positive relationship between suppliers and increasingtechnologicalcooperationinagro-industries.
H1.f. There is positive relationship between competing enterprises andincreasing technological cooperationin agro-industries.
H1.g. There is positive relationshipbetween environmental consultingcompaniesandincreasingtechnologicalcooperation inagro-industries.
ThehypothesisH2seekstoknowwhetherthereis relation-shipbetweenthegenerationof innovationfromtechnological cooperationamongthecassavaprocessors.
H2. There is positive relationship between the degrees of technologicalcooperationthatresultsinthegenerationof eco-innovation.
BesidesH2,accordingtotheclassificationoftheterm innova-tion,initiallyproposedbyIBGE(2016)thetermeco-innovation is divided into highinnovation rate andlow innovation rate. Complementingtheclassification,eco-innovationisdividedinto goodsproductsandservices.Therefore,H3.a–H3.dcompletethe definitionofhypotheses.
H3.a. Thereisgenerationofloweco-innovationrateingoods (productsandservices).
H3.b. Thereisgenerationofloweco-innovationrate in pro-cesses.
H3.c. Thereisgenerationofhigheco-innovationrateingoods (productsandservices).
H3.d. Thereisgenerationofhigheco-innovationratein pro-cesses.
Other studies also suggest how to reduce greenhouse gas emissions and more efficient use of energy resources.
Wickramasinghe andGamage(2013) verify the emissionsof
Bonilla,Almeida,Biagio,Giannetti,andHuisingh(2009) high-lightthefollowingenvironmentallyrelevantaspects:(a)more efficientandconscioususageofrawmaterials;(b)moreefficient and conscioususage of non-renewable and renewable energy sources and energy technologies; (c) reduced emissions and impacts;(d)expandedimplementationofclosed-loopsystems ofmaterials,bothintraandintercompanies(end-of-life strate-giespromotion); and(e)accelerated integrationof renewable sourcestoasmanyprocessesaspossible.
Somecountries,suchasGermanyandDenmark,represented byitsindustries,areinvestinginAfricainorderdevelopsolar energy,reducingcarbonemissions,withthepossibilitytouse cheaperproductionofrenewableenergysourcesinthese devel-opingcountries(Wickramasinghe&Gamage,2013).Pancera
(2013) evaluatedthe reality for sustainable innovation inthe
renewable energy sector in Bolivia and conluded that it is necessarytoknowthe conditionsthat originate initiativesfor innovationindevelopingcountriesinordertounderstandthat eco-innovationoccursinawidevarietyofdifferentcontexts, usuallyincremental,requiringthesupportfromseveralplayers. Dependentandindependentvariableswereobtainedfromthe reviewofothermodelswithquantitativeanalysisbetween tech-nologicalcooperationandinnovation generation,focusing on cooperationversuseco-innovation.Srholec(2009)summarizes someofthemajorworksthatprovidedirectevidenceof techno-logicalcooperationoninnovationthroughresearch,suchasNIS (2008),developedbydifferentauthorsinresearchconductedin theEuropeanUnion(Becker&Dietz,2004;Najib&Kiminami,
2011;Srholec,2009).
Methodology
The research method is quantitative, exploratory descrip-tive andcausative. The researchscope comprises all cassava processors affiliated to the Associac¸ão Brasileira dos Produ-toresde AmidodeMandioca(ABAM)andthe Sindicato das Indústrias Produtoras de Mandioca do Paraná (SIMP), total-ing 50 enterprises, including processors of starch, flours and starchesprocessingcompanies.However,toprovidethesample, 33starchprocessorsrespondedtothequestionnaires,restricting thenumberofthesample,consideringtheshareof66%ofthe totalavailable.
Ofthetotal,threestarchprocessorsservedasthebasisfor thepre-testofquestionnaires.Becauseitwasnotnecessaryto changethestructureofthequestionnairesofthepre-testforthe effectiveresearch,theresponsesofthethreestarchprocessors wereconsideredinthedataanalysisalongwiththeresponsesof theother30respondents.Chin(1995)confirmsthatthemethod tobeusedforsmallersamplesconsistsofPLS.Differently,the LISRELshouldbeapplied,formathematicalreasons,tosamples that includelargenumbersof indicatorsbyfactor,generating estimatesofstructuralpaths.Anotherargumentdefinesthatfor moststudiesoftechnologicalbases,theestimateofstructural pathsismoresuitableinthePLSmodel.Thus,theobjectiveof thePLSistomaximizethevariance,whiletheLISRELestimates parametersofthecausalmodel(Chin,1995).
We selected PLS-SEM as the appropriate method for two reasons.First, PLSisfocused onpredictiveanalysis. Specifi-cally,theobjectiveofPLS-SEMistomaximizethevarianceof theendogenousvariablesexplainedbytheexogenousvariables
(Hair,Tomas,Hult, Ringle,&Sarstedt,2014).Thepredictive
focusisappropriatetomeettheobjectivesofthecurrentstudy. Second,PLSdoesnotrequiremeetingtheassumptionsof nor-malityforthedatadistributions(Hair,Sarstedt,Ringle,&Mena, 2012).AlthoughtherearelimitationstoPLS-SEM(e.g.results tend to overestimate the itemloadings (lambdas) and under-estimate path coefficients and R2 (structural relationships)), CB-SEMalsohaslimitations(e.g.resultstendtooverestimate structuralrelationshipandunderestimatelambdas,suggesting thatPLS-SEMactuallyoffersaconservativetestofthe hypothe-ses).
Thequestionnaires,containing12questions,wereanswered usingGoogledocsafterfourroundsoftelephonecontact.The questionnaire was constructed based on the literature review and the research hypothesis. The scales for the construction ofthequestionnairewereestablishedfrom0to10.Withinthe range established, 0 represents no results, that is, “disagree” and10isthehighestresult,“totallyagree”.Othersimilarscales werediscardedoncenewindependentvariableswereincluded inadditiontothosetreatedinthemodelofNajibandKiminami
(2011).
AccordingtoKerlinger(1980),themodelsaredeterminedby theobjectivesofprojectandtheirconstructiondependsonthe theoretical scopeinwhichthemodelisinserted.Thus,Fig.2
delineatesthe modelof quantitativeresearch,establishing the latent variables, representedbyarectangleandtheexpressed variables, representedbyanellipsisandtherelationships pro-ducedbetweenthem.
In this research, as well as in the model of Najib and
Kiminami (2011), the independent variables of government
incentives, partner companies, inaddition touniversities and researchinstitutesexert certainimpactontheprocessof tech-nologicalcooperationwithinthesegmentaddressed,creating, therefore,hypothesesH1.a–H1.g.Fromtheprocessof techno-logicalcooperation,thesecondhypothesis–H2–wasobtained, seekingtoverifythegenerationofeco-innovationincooperation processes.
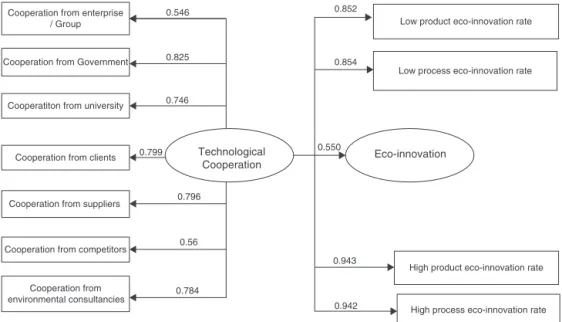
The model proposedinthisworkaddsotheragents tothe modelelaboratedbyNajibandKiminami(2011),namely cus-tomers, competitors, suppliers, and environmental consulting companies. The purpose is to expand the explanationof the degreeofinfluenceoftechnologicalcooperationingenerating eco-innovation,strengtheningtheopeninnovationasawaythat consolidatesgradually.Themodelwillbepresentedinthefourth sectionmorepreciselyinFig.1,wheretheresearchresultswill beshown.
Researchresultsanddiscussion
Table1
Multicollinearityandnormalityofindependentvariables:highdegreeofrelationshipbetweenthedependentand independentvariables.
Indicators of independent variables n = samples
Mean Standard deviation
KS test of Kolmogorov– Smirnov
VIF
Low product eco-innovation rate 33 6.00 3.588 1.127 2.556 Low process eco-innovation rate 33 6.97 3.046 1.160 2.500 High product eco-innovation rate 33 2.15 3.554 2.090 3.130
High process eco-innovation rate 33 2.85 3.751 1.848 3.388 Enterprise or group cooperation 33 8.42 2.851 1.814 1.998
Government cooperation 33 3.97 3.423 1.208 3.771 University cooperation 33 4.00 3.391 0.883 2.929 Client cooperation 33 3.88 3.160 0.874 3.412 Suppliers cooperation 33 6.15 3.318 1.127 3.469 Competitors cooperation 33 2.85 2.863 1.345 1.818 Environmental consultancy
cooperation
33 6.79 3.314 1.429 3.304
Source:Researchdata(2013).
Table2
Variableofeco-innovation:cooperationfactorscontributingtoeco-innovation.
Variable Descriptionofthequestion
Lowproduct eco-innovationrate
Didthecompanyintroduceaneworsignificantly enhancedproduct(goodsorservice)withtheaimto minimizeenvironmentalimpact,BUTTHAT ALREADYEXISTEDinthedomesticmarket? Lowprocess
eco-innovationrate
Didthecompanyintroduceaneworsignificantly improvedPROCESSwiththeaimtominimize environmentalimpact,BUTTHATALREADY EXISTEDinthedomesticmarket?
Highproduct eco-innovationrate
Didthecompanyintroduceaneworsignificantly enhancedproduct(goodsorservice)withtheaimto minimizeenvironmentalimpact,BUTTHATDID NOTYETEXISTinthedomesticmarket? Highprocess
eco-innovationrate
Didthecompanyintroduceaneworsignificantly improvedPROCESSwiththeaimtominimize environmentalimpact,BUTTHATDIDNOTYET EXISTinthedomesticmarket?
Source:Researchquestionnaire(2013).
(2008),whichshowsthedegreeofrelationshipbetweenthe
inde-pendentvariables.TheVIF(VariationIndexFactor)waslimited toatoleranceofVIF<10,sincethesmallerthisratio,thelower thedegreeofmulticollinearityofthevariablesoftheir individ-ual independence. Table1 showsthat all variablespresented VIF<4,especiallywithshadowing,thelowestandthehighest results.
The results of multicollinearity show that the indicators thatexplainindependentvariablespracticallydonotnulleach other,that is,therewerenooptionsthat representedthe same sourceof informationamongthe alternatives thatwere made available to respondents. Regarding normality, tested in the Kolmogorov–Smirnovtest,indicatedbyCostaNeto(1997),all variables can be considered within the normal range, repre-sentedby(p>0.05),nosamplecouldbeconsideredasabnormal (p<0.05).Eco-innovation wasclassified into four indicators, divided higheco-innovation rateand loweco-innovation rate andinnovationofproducts/servicesandprocesses(Table2).
Deslee(2012)concluded“Thedevelopmentoftheir
perfor-mancethroughasustainableattitude,canbeengagedthrough
Table3
Variables oftechnological cooperation: mainstakeholedersthecooperation procedure.
Variable Descriptionofthequestion
Enterpriseorgroup cooperation
Didthecompanyitselforanothercompany fromthegroupdevelopprojectsinternallyin thecompanyorevenwithothercompanies ofthegroup?
Governmentcooperation Didthepublicsectorthroughgovernment incentivesprovideinnovationgenerationdue toresourcesandgovernmentincentives? Universitycooperation Didpartnershipswithuniversitiesand/or researchinstitutesgenerateinnovation? Clientcooperation Didsuggestionsandpartnershipswith
clientsorconsumersgenerateinnovations? Supplierscooperation Didpartnershipswithsuppliersgenerate
innovations?
Competitorscooperation Didpartnershipswithcompetitorsgenerate innovations?
Environmental consultancy cooperation
Didpartnershipswithenvironmental consultingcompaniesgenerateinnovations?
Source:Researchquestionnaire(2013).
asystemofparticipativeinnovation.”Table3showsthe tech-nologicalcooperationconstructofvariables.Inadditiontothe threevariablesmostcommonlymentionedintheclassical lit-erature(company,universityandgovernment),thevariablesof customers,suppliers,competitors,andenvironmental consultan-cieswerealsoincluded,accordingtotheindicatorsoflimiting modelinthisstudy.
The methodof dataprocessing,as showninFig.1,aimed to knowthe analysis of extracted variance (AVE), proposing somegeneralindicatorsanddiscriminantvalidity,suchas the compositereliability,determinationcoefficient(R2),Cronbach’s alpha,commonalityandredundancy,toconfirm thereliability withbeta above 0.5%,minimum valuerequired accordingto Davis(1964,p.24apudMaroco&Garcia-Marquez,2006).
Cooperation from enterprise / Group
Cooperation from Government
Cooperatiton from university
Cooperation from clients
Cooperation from suppliers
Cooperation from environmental consultancies
Technological Cooperation
Eco-innovation
Low product eco-innovation rate
Low process eco-innovation rate
High product eco-innovation rate
High process eco-innovation rate Cooperation from competitors
0.546
0.825
0.746
0.799
0.56 0.796
0.784
0.550
0.852
0.854
0.943
0.942
Fig.1.Loadsofpathofthestructuralmodel.
Source:OwnelaborationusingsoftwareSmartPSL(2013).
technologicalcooperationvariableinexplainingthegeneration ofloweco-innovationrate,asshowninFig.2.
Fig.2showsthebetasquareroot,whichaccordingtoField
(2013,p.344)theR2tellsushowmuchvarianceisexplainedby
themodelcomparedtohowmuchvariancethereistoexplain, thatis,istheproportionofvarianceintheoutcomevariablethat issharedbythepredictorvariable.
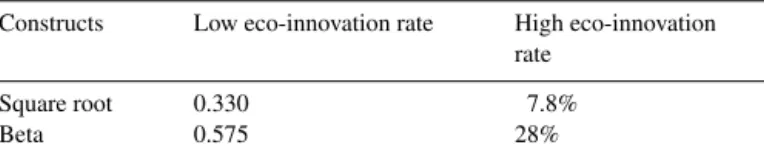
InTable4,the resultsshowabetavaluebelow0.5forthe
indicatorofhigheco-innovationrate,whichobtainedonly0.28. Thisisevidencedbythelowdegreeassignedtothisphenomenon
intheresultsofquantitativeresearch.However,theindependent variableofloweco-innovationratecontinuedabove0.5(0.575). Thebetasquarerootforloweco-innovationrateincreasedfrom 0.30 to 0.33 the explanationof eco-innovation based on the technologicalcooperation.
In othercountries andin othersectors, such as the swine culture,bio-digestershavealreadybeenusedinBrazil.Forthe cassava processingmills,the implementationof bio-digesters as wellasthe changescausedbythisnewproducthavebeen regarded as high eco-innovation rate. Previous studies have
Cooperation from enterprise / Group
Cooperation from government
Cooperation from clients Cooperatiton from university
Cooperation from competitors Cooperation from suppliers
Cooperation from environmental consultancies
Techonological Cooperation
Low eco-innovation rate
High eco-innovation rate
Low process eco-innovation rate Low product eco-innovation
rate
High product eco-innovation rate
High process eco-innovation rate 0.575
0.28
0.926
0.943
0.942
0.547
0.824
0.746
0.784 0.799
0.796
0.562
0.900
Fig.2.Loadsofpathsofthealternativestructuralmodel,determiningthecompositereliabilitymodel.
Table4 BetaR2analysis.
Constructs Loweco-innovationrate Higheco-innovation rate
Squareroot 0.330 7.8%
Beta 0.575 28%
Source:OwnelaborationusingsoftwareSmartPSL(2013).
Note:Forthedefinitionofthecoefficientofdetermination(R2)seeNunallyand Bernstein(1994).
already pointed to that possibility, although the use of bio-digesterswasstill non-existentinBrazil.Results showedthat cassavaflour hasgreatcapacityformethaneproduction, thus, bringingrevenuetotheprocessingplant.However,studieson costsandfeasibility are necessaryfor the installation of bio-digesters,apracticethathasnotbeenusedbyindustryofcassava starchinthecountry(Felipe,Rizatto,&Vandalsen,2009).
Specificallyintheindustryofcassavaprocessing,theuseof bio-digesterswiththeabilityofextractingandusingthemethane gas(CH4) – derivedfrom anorganic biomass that until then representedanissueandcostsas toitscorrect environmental disposal–inreplacementforwoodburningintheboiler–was higheco-innovationrate,sinceseveralstudiesoninitial devel-opmentandsubsequentincrementalimprovementsof organic biomassuseforenergyproductionderivedfromstudieslinked tothe sameprojectthat originatedthispaper.Obviously,itis understandablethatthistechnologywasnotdevelopedfromthis work.
However,theinvestigationofelementslinkedtotheresults ofthischangeindicatesamuchgreatertransformationthanjust loweco-innovationrate that wereevenoriginated,toalesser extent,fromtheintegrationofbio-digesters.Otheraspectsnot mentionedingreat detailhere, butreportedinother research phases,showed,inadditiontotheenvironmentalbenefits, finan-cialgainsfromwoodpurchaseas wellassocialgainssuchas availabilityofenergyproductionoftheboiler,intendedtosocial projectsforthesurroundingcommunity.
Table5complementstheanalysisofconvergentconnection
betweentwomeasurementsthatseektoexpressthesame con-cept.BothAVEresultsfortheconstructsobtainedresultgreater
than 0.5. For Maroco and Garcia-Marquez (2006), the ideal
resultsforCronbach’salphabeacceptableisbetween0and1and theproposedreliabilityshouldbegreaterthan0.6,providedthat theproposedmodelremainwithintherequiredlimits.The indi-catorsofCronbach’salphaandcompositereliabilityregistered positivenumbers.
R2,whichexplainstheconnectionbetweentheconstructof technologicalcooperationanditsinfluenceoneco-innovation generation,reached33%,whichhaseffect“large/good”
accord-ingto Wetzels,Odekerken-Schroder, andVan Oppen (2009).
These values show a sufficient index, once the model of
NajibandKiminami(2011)reachedR2 of 15%.Redundancy
showed 0.069and0.274for low eco-innovationrate, respec-tively.Redundancyreinforcesacloserproximityofthemodel toexplainloweco-innovationrate,withahighredundancyvalue forhigheco-innovationrate.
AccordingtoQueiroz(2011),thepurposeof thebootstrap testis,basedonrepetitions,consideringdeviationandstandard errors, to calculate data statistical assumptions found in the empirical research. In thisstudy, 33 sampleswere used with 200 repetitions. In addition to the calculations of the devia-tionandstandarderrors,theT-test(Student)solvestheproblem of statistical significance.Thus,corroborating withthe previ-ousanalysis,thevaluesoftheStudentT-testsoftheregression coefficientsweregreaterthan2.98(p<0.05),provingthe pre-dictivevalidityofthemodel(Hayduk,1987apudVentura,Silva,
DaPinho,&Rigolon,2010),rejectingthenullhypothesis.
Fig.2andTable4showthatallrelationshipswerepositive
and significant. The relationship between the construct tech-nologicalcooperationandeco-innovationwasstrong(β=5.75; p<0.01). Thereis an explanationof the eco-innovation phe-nomenon from the technologicalcooperation in the segment analyzed. The resultsobtained in thisstudy were inherentin thehypothesesandinitialobjectivesproposed,basedheavilyon literaturereview.
Ontheonehand,thetechnologicalcooperationandits indi-catorsconfirmthedegreeofparticipationofdifferentstrategic partners,showingdegreesofspecificparticipation.Ontheother hand, eco-innovation was elaborated from concepts already concluded in researchon innovation. Concepts, such as high eco-innovationrate,Schumpeter(1997)andclassificationof dif-ferenttypesofinnovation,OECD(2005),wereusedtoproducea modelabletoexplain30%oftrendsbetweenthelatentvariables. Theconstructionofamodelabletoshowtheinfluenceof tech-nologicalcooperationingeneratingeco-innovationrepresents ameaningful result.Thus,after obtaining the keyconstructs, relationships between them were represented by the method ofstructuralequationmodeling(SEM),provingthehypotheses proposed(Table6).
Regardingtheresultsofthequantitativeresearch,giventhat mostenterprisesofthesectoraresmall-sized,family-structured andstilldonotexporttheproduction, itisconsideredagreat opportunityof expansion andmodernizationfor thesegment. Such developments can be strongly drivenby the volumeof lowor highinnovationsrate,released tothe marketsegment, propellingtechnicalchangeandeconomicdevelopment. How-ever,thequantitativeresultsshowedthatapproximately30%of theeco-innovationgeneratedinthesectoralreadycomesfrom cooperation.Themainpositiveresultsregardingeco-innovation refertothereductionintheemissionofgreenhousegases, reduc-tioninfossilfuelburning,odorreduction,reductionandbetter qualityofwastewater,soilirrigationwithfertilizingpotential, amongothers.
All hypotheses to prove the model were confirmed. The hypotheses H3.a–H3.dshowed agreater tendencytogenerate lowinnovation ratethanhighinnovationrate (Fig.2). There-fore, fewhigheco-innovations ratewere foundin thesurvey data,highlightingthepioneeringenterprisesintheuseof bio-digesters,irrigationfromeffluentsand,mostsignificantly,the developmentofanewdevicefortheindustry,adaptedtospecific conditionsofcassavacultivation.
Table5
Generalindicatorsofdistinctdiscriminants.
Constructs AVE Composedreliability R2 Cronbach’salpha Redundancy
Technologicalcooperation 0.534 0.887 0.853
Loweco-innovationrate 0.888 0.940 0.078 0.873 0.069
Higheco-innovationrate 0.834 0.909 0.331 0.802 0.274
Source:OwnelaborationusingsoftwareSmartPSL(2013).
Table6
TestofresamplingBootstrappingwithtwovariables.a
Paths Originalloads Meanloads
with200 repetitions
Standard deviation
Standard error
Ttest Significance
Enterprisecooperation→Technologicalcooperation 0.55 0.52 0.18 0.18 2.98 p<0.1%
Governmentcooperation→Technologicalcooperation 0.82 0.78 0.12 0.12 6.63 p<0.1%
Clientcooperation→Technologicalcooperation 0.80 0.78 0.11 0.11 7.48 p<0.1%
Universitycooperation→Technologicalcooperation 0.75 0.73 0.15 0.15 5.11 p<0.1%
Suppliercooperation→Technologicalcooperation 0.80 0.78 0.13 0.13 6.08 p<0.1%
Competitorcooperation→Technologicalcooperation 0.56 0.54 0.15 0.15 3.79 p<0.1%
Environmentconsultancycooperation→Technologicalcooperation 0.78 0.78 0.10 0.10 7.98 p<0.1%
Lowproducteco-innovationrate 0.85 0.83 0.12 0.12 7.17 p<0.1%
Lowprocesseco-innovationrate 0.85 0.84 0.12 0.12 7.13 p<0.1%
Highproducteco-innovationrate 0.67 0.63 0.19 0.19 3.51 p<0.1%
Highprocesseco-innovationrate 0.69 0.65 0.19 0.19 3.63 p<0.1%
Technologicalcooperation→Eco-innovation 0.55 0.61 0.09 0.09 5.96 p<0.1%
CriticalvaluesforT(32gl)=p<10%=1.30;p<5%=1.68;p<1%=2.43;p<0.1%=2.75.
Source:Researchdata(2013).
aCriticalvaluesfor:p<5%=1.96;p<1%=2.53.
proposedphenomenon, despite somelimitations.The consis-tencyisbasedonthedegreeofexplanationoftherelationships betweentheconstructsandthecomprehensivenessofthesample beforetheuniverseproposed.
Similarlytothisstudy,BuenoandBalestrin(2012,p.526)
confirmed the successof cooperative practices as one of the mainresults oftheir research,whichconcluded that “ineach ofthesestages,differentexternalagentswereaccessed,namely consumers,univeristiesandsuppliers,allowingtoexplorenew knowledge,developnewconceptsandimplementnew technolo-giestothenewproduct”.
Finalconsiderations
This research aimed to investigate whether cassava-processingindustriesgenerateeco-innovationsthrough techno-logicalcooperation,alsotoverifythedegreeofparticipationof eachoftheagentsintheirinteractions.Theresultsallowed,in lightofthetheoreticalapproach,toachievespecificobjectives:
a) Analyze the objects of technological cooperationused in agro-industrialsectorof cassavaprocessingas ameansof promotingeco-innovation.Amongthem,mostnotably, gov-ernmentsupport,partnershipswithenvironmentalconsulting firmsandpartnershipswithsuppliersofmachinesand equip-mentusedinpractice.
b) Describe the way interactions occur among agents: company, university, and governmentin the segment cas-sava processing. Initially, qualitatively, this objective was
structuredtoknowtherelationshipbetweenthethreemain agentsofNIS,highlightingthemainobstaclesandthemain difficultiestogenerategreatereconomicdevelopment,thus achievingthesecondobjective.
others.Thisistheessenceofcooperation:useotheragents toproducemoreeconomicalresultswithmultipleviews. d) Identify whether the interactions between university and
enterprise resulted in some eco-innovations in the sector analyzed. The bootstrapping analysis of paths allowed to knowthedegreeofinteractionbetweenuniversityand enter-prise. The qualitative research presented, as a result of threeinterviews,theopinionofthemanagersinvolvedwith theproactivecooperationprojectstrategy,statingthatthey recognizethebenefitsofcooperationandarewillingto par-ticipateagain.Aseco-innovationsresultingfromtheprocess ofcooperation,consideringallproposedagents,someofthe mainbenefitsweredescribed:reducedconsumptionofraw material,reductioninfossilfuelburning,bettertreatmentof effluentsfromproduction,environmentalbenefitgenerated fromacollegework,thegenerationofcropirrigation.
Inregardtotheresearchhypothesis:“whatistheinfluenceof technologicalcooperationonthegenerationofeco-innovation inthesectorofcassavaprocessing?”thetheoreticalfoundation andthestatisticaltreatmentofthedataallowedthedevelopment of aneffective modeltoverify the influenceof technological cooperationon the generation of eco-innovation. The defini-tionoftheuniverseandtheobtainingofthesampleresearched allowedtoachievethepropositionthatdelimitedtheagricultural industriesofcassavaprocessinginParaná State,restrictingto starch,starchesprocessingcompaniesandfloursmanufacturers. ThehypothesisH2allowedtoconcludethesignificantinfluence betweenthetwophenomena.
Themethodological proceduresandstatistical calculations areaseriesofconcepts,whichmayinspirefurtherresearchand serveas ametricfor comparisonwithotherstudies.To assist intheconstructionofthedescriptionoflimitingaspectsofthe study,Selltiz,Wrightsman,andCook (1987)recommendtwo actions.One is topresent characteristics of the methodology thatmayhaveinfluencedthe results,andthe otheristhe dis-cussionaboutimpliedcharacteristicsinthesampleinrelation totheuniverse,whichcanpreventgeneralization.Althoughthe indicatorsfor constructionof thequestionnaireswereadapted fromliterature,andtherelationshipofthevariableswerebuilt based on other models already validated, the 11-point scale (0–10)tomeasurethedegreeofeachindicatorthatcomposed the expressedvariablesmayhave hamperedthe responses of respondentsbecause thisanalysisrequiresgreater criterionin thedegreeofresponse.
Thecreationofnewhypothesesisimportanttoinvestigatethe motivationthatleadenterprisetoseekeco-innovations, verify-ingwhethertheyarerelatedtomimetic,coerciveornormative isomorphism. The difficulty in generating knowledge can be overcomewithencouragingfor basicresearchatuniversities. However, the sharing of knowledge, which leads to positive resultsintheBrazilianagribusiness,reliesheavilyonanefficient wayof organizinganddistributinginformation.Thisresearch isexpected toinspire newresearchers tocontinue advancing towardfurtherdevelopmentoftheBrazilianNISguidedbythe
conceptsofopeninnovation,expanding,therefore,managerial andacademiccontributions.
Conflictsofinterest
Theauthorsdeclarenoconflictsofinterest.
References
ABAM – Brazilian Association of Cassava Starch Producers. (online): <http://www.abam.com.br/>Accessed21.03.12at19.11.13.
Angelidaki,I.,Alves,M.,Bolzonella,D.,Borzacconi,L.,Campos,J.L.,Guwy, A.J.,etal.(2009).Definingthebiomethanepotential(BMP)ofsolidorganic wastesand energy crops:Aproposed protocolforbatch assays.Water Science& Technology, 59(5)(online). http://repositorium.sdum.uminho. pt/bitstream/1822/9716/1/AngelidakiWST059050927%5B1%5D.pdf
Accessed15.05.13
Baerz,A.M.,Abbasnejad,T.,Rostamy,A.A.A.,&Azar,A.(2011).Therole ofgovernmentalpoliciesinimprovingnationalinnovationsystem:Acase studyofIran.Middle-EastJournalofScientificResearch,7(4),625–633. ISSN1990-9233,IDOSIPublications.
Becker,W.,&Dietz,J.(2004).R&Dcooperationandinnovationactivitiesof firms–EvidencefortheGermanmanufacturingindustry.ResearchPolicy,
33(2),209–223.
Bonilla,S.H.,Almeida,C.M.V.,Biagio,B.,Giannetti,F.,&Huisingh,B.F. (2009).Therolesofcleanerproductioninthesustainabledevelopmentof modernsocieties:Anintroductiontothisspecialissue.JournalofCleaner Production, 18(2010) (online). http://www.advancesincleanerproduction. net/papers/journals/2010/2010JCPcleanprod.pdfAccessed06.02.14 Bueno,B.,& Balestrin,A.(2012).Inovac¸ão Colaborativa:umaabordagem
abertanodesenvolvimentodenovosprodutos.RevistadeAdministra¸cão deEmpresas,52(5),517–530.
CEPEA-ESALQ – Centrode estudos avan¸cados emeconomia aplicada – CEPEA–ESALQ/USP.Féculademandioca:Produ¸cãonaTailândiaversus Brasil. (online): <http://cepea.esalq.usp.br/pdf/Agroanalysismarco2013. pdf>Accessed21.04.13.
Chesbrough,H.W.(2003).Openinnovation:Thenewimperativeforcreating andprofitingfromtechnology.Boston:HarvardBusinessSchoolPress.
Chesbrough,H.W.,Vanhaverbeke,W.,&West,J.(2006).Openinnovation: Researchinganewparadigm.OxfordUniversityPress.
Chin,W.W.(1995).PartialleastsquaresistoLisrelasprincipalcomponents analysisistocommonfactoranalysis.TechnologyStudies,2,315–319.
Cooper,C.R.,&Schindler,P.S.(2008).Businessresearchmethods(10thed.). Boston:McGraw-Hill.
CostaNeto,P.L.O.(1997).Estatística(15thed.).SãoPaulo:EdgardBlucher.
Deslee, C. (2012, September). European Conference on Innovation and Entrepreneurship: III. Reading: Academic Conferences International Limited.
Deublein,D.,&Steinhauser, A.(2008).Biogasfromwasteand renewable resources:Anintroduction(2nded.).Weinheim,Germany:VerlagGmbH& Co.KgaA.
Dosi,G.(1988).Sources,proceduresandmicroeconomiceffectsofinnovation.
JournalofEconomicLiterature,26(3),1120–1171.
Eurostat – Community Innovation Survey.(2016). Description of dataset. (online). http://ec.europa.eu/eurostat/web/microdata/community-innovation-survey
Etzkowitz,H.(1998).Thenormsofentrepreneurialscience:Cognitiveeffects ofthenewuniversity–industrylinkages.ResearchPolicy,27,823–833.
Etzkowitz, H., & Leydesdorff, L. (2000). The dynamics of innova-tion: From national systems and “mode 2” to a triple helix of university–industry–governmentrelations.ResearchPolicy,29,109–123.
Fagerberg, J., & Sapprasert, K. (2013). National innovation systems: The emergenceofanewapproach.ScienceandPublicPolicy,38(9)(online).
http://www.ingentaconnect.com/content/beech/sppAccessed12.04.13 Felipe,F.I., Rizatto,M.,& Vandalsen,J. V.(2009).Potencial econômico
dos resíduos de mandioca provenientes de Fecularias no Brasil. 47◦
SOBER..PortoAlegre,26,30June2009.(online).http://cepea.esalq.usp.br/ pdf/Manipueira.pdfAccessed26.04.16
Feng, F., Ma, L., Zhang, L., & Du, Y. (2013). Research on industry–university–institutecooperationinnovationinChinafrom perspec-tiveofambidexteritytheory.AsianSocialScience,8(2)http://dx.doi.org/ 10.5539/ass.v8n2p42(online).Accessed12.01.13
Field,A.(2013).DiscoveringstatisticsusingIBMSPSSstatistics(4thed.).Sage.
Freeman,C.(1987).Technologypolicyandeconomicperformance:Lessons fromJapan.London:Pinter.
Freemann,C.(1997).Theeconomicsofindustrialinnovation.London:Penguin.
Fussler,&James.(1996).Drivingeco-innovation:Abreakthroughdiscipline forinnovationandsustainability.London/Washington,DC:PitmanPUB., 364pp.
Hair,J.F.,Jr.,Sarstedt,M.,Ringle,C.M.,&Mena,J.A.(2012).An assess-mentoftheuseofpartialleastsquaresstructuralequationmodelingin marketingresearch.JournaloftheAcademyofMarketingScience,40(3), 414–433.
Hair,J.F.,Jr.,Tomas,G.,Hult,M.,Ringle,C.,&Sarstedt,M.(2014).Aprimer onpartialleastsquaresstructuralequationmodeling(PLS-SEM).Thousand Oaks:SAGEPublications,Incorporated.
Hasenclever,L.,&Tigre,P.(2002).Estratégiasdeinovac¸ão.InKupper,D., &Hasenclever, L.(Org.), Economiaindustrial: fundamentos teóricose práticasnoBrasil(pp.431–447).RiodeJaneiro:Campus.cap.18. Hayduk,L.A.(1987).StructuralequationmodelingwithLisrel.Baltimore:The
JohnsHopkinsUniversityPress.
InstitutoBrasileirodeGeografiaeEstatística–IBGE.Pesquisadeinova¸cão 2011. (online). http://www.pintec.ibge.gov.br/downloads/pintec2011% 20publicacao%20completa.pdfAccessed25.04.16.
Instituto de Pesquisa Econômica Aplicada – IPEA. (2005). Inova¸cões, padrões tecnológicos e desempenho das firmas industriais brasileiras. Brasília:IPEA(online). http://www.ipea.gov.br/portal/index.php?option= comcontent&view=article&id=5498Accessed06.02.13
Jaffe,A.B.,&Palmer,K.(1997).Environmentalregulationandinnovation: A paneldata study. The Review of Economics and Statistics (online).
http://www.mitpressjournals.org/doi/abs/10.1162/003465397557196? journalCode=restAccessed18.05.12
James,P.(1997).Thesustainabilitycircle:Anewtoolforproduct develop-mentanddesign.JournalofSustainableProductDesign,2,52–57(online).
http://www.cfsd.org.uk/journalAccessed20.01.14
Kerlinger,F.(1980).Metodologiadapesquisaemciênciassociais:um trata-mentoconceitual.SãoPaulo:EPU/EDUSP.
King,A.,&Lakhani,K.R.(2013).Usingopeninnovationtoidentifythebest ideas.MIT–SloanManagementReview,55(1).
Kocar,G.(2008).Anaerobicdigesters:Fromwastetoenergycropsasan alter-nativeenergysource.SolarEnergyInstitute,EgeUniversity,Izmir,Turkey.
EnergySources,PartA,30,660–669(online):<http://www.silascience.com/ articles/01122012102817.pdf>.Accessed13.07.2012
Lozano,Rodrigo.(2008).Envisioningsustainabilitythree-dimensionally. Jour-nalofCleanerProduction,18,1838–1846.
Lundvall, B.-A. (1988). Innovation as an interactive process – From user–producerinteractiontothenationalsystemofinnovation.InTechnical changeandeconomictheory.London:PinterPublishers.
Manzini,S.T.(2012).Thenationalsystennofinnovationconcept:An ontolog-icalreviewandcritique.ResearchArticle–AOSISOpenJournals(online).
http://www.sajs.co.za/sites/default/files/publications/pdf/1038-9432-4-PB. pdfAccessed12.05.13
Maroco,J.,&Garcia-Marquez,T.(2006).Qualafiabilidadedoalfade Cron-bach?Questõesantigasesoluc¸õesmodernas?LaboratórioPsicologia,4(1),
65–90. http://publicacoes.ispa.pt/index.php/lp/article/viewFile/763/706. Accessed06.11.13
Minshall,T.,Seldon,S.,&Probert,D.(2007).Commercializingadisruptive technologybaseduponuniversityIPthroughopeninnovation:Acasestudy ofcambridgedisplaytechnology.InternationalJournalofInnovationand TechnologyManagement,4(3),225–239.
Najib,M.,&Kiminami,A.(2011).Innovation,cooperationandbusiness per-formance.JournalofAgribusinessinDevelopingandEmergingEconomies,
1(1) (online). www.emeraldinsight.com/2044-0839.htm Accessed May 2013
Nelson,R.R.(1993).Nationalinnovationsystems:Acomparativeanalysis. New York: Universityof Illinoisat Urbana-Champaign’s Academyfor EntrepreneurialLeadershipHistoricalResearchReferencein Entrepreneur-ship–OxfordUniv.Press.
Nunally,J.C.,&Bernstein,I.H.(1994).Psychometrictheory.NewYork.
OCDE–Organizac¸ãoparaCooperac¸ãoeDesenvolvimentoEconômico.(2005).
ManualdeOslo.TraduzidopelaFINEP(3aedic¸ão).Paris:Eurostat(online) <http://www.finep.gov.br/images/apoio-e-financiamento/manualoslo.pdf>. Accessed21.03.2013
Pancera,M.(2013).Innovationsystemforsustainabilityindevelopingcountries: TherenewableenergysectorinBolivia.InternationalJournalofInnovation andSustainableDevelopment,7(1),27–45.
Plonski,G.A.(1995).Cooperac¸ãoempresa-universidadenaIbero-América: estágioatualeperspectivas.RevistadeAdministra¸cão,30,65–74.
Portal Brasil. Setores da Economia. (online). http://www.brasil.gov.br/ sobre/economia/setores-da-economia/agronegocio/print Accessed 17.04.13.
Prochnik,V.,&Araújo,R.D.(2005).Umaanálisedobaixograudeinovac¸ão naindústriabrasileiraapartirdoestudodasfirmasmenosinovadoras.In DeNegri,J.A.,&Salerno,M.S.(Org.).Inova¸cões,padrõestecnológicos edesempenhodasfirmasindustriaisbrasileiras (pp.193–252).Brasília: IPEA.cap.6.
Quandt,C.O.(2012).Redesdecooperac¸ãoeinovac¸ãolocalizada:estudode casodeumarranjoprodutivolocal.RevistadeAdministra¸cãoeInova¸cão,
9(1),141–166.
Queiroz,M.P.F.(2011).TestesdeHipótesesemRegressãoBetaBaseadosem Verossimilhan¸caPerfiladaAjustadaeemBootstrap(Dissertac¸ãoMestrado emEstatística).Recife,Brasil:UniversidadeFederaldePernambuco.
Sábato,J.,&Botana,N.(1968).LaCienciaylaTecnologíaenelDesarrollo FuturodeAmericaLatina.RevistadelaIntegracion,15–36.
Schumpeter,J.A.(1997).Teoriadodesenvolvimentoeconômico.SãoPaulo: NovaCultural(Oseconomistas)
Selltiz,C.,Wrightsman,L., &Cook,W. (1987).Métodosdepesquisanas rela¸cõessociais(2nded.).Trad.M.M.HubnerD’Oliveira,&M.M.Del Rey.SãoPaulo:EPU.
Srholec, M. (2009). Does foreign ownership facilitate cooperation on innovation? Firm-level evidence from the enlarged European Union.
European Journal of Development Research, 21(1), 47–62 (online).
www.palgrave-journals.com/ejdrAccessed12.05.13
Tidd,J.,Bessant,J.,&Pavitt,K.(2008).GestãodaInova¸cão.Translation(3rd ed.).PortoAlegre:Bookman.
Ventura,V.L.S.,Silva,D.,DaPinho,M.S.,&Rigolon,G.(2010,September).
Arela¸cãodosconsumidorescomasempresas:Avalia¸cãodaImportânciae RecompensadosConsumidorespelaPosturaEmpresarialÉticae Social-menteResponsável. SãoPaulo,Brazil:Paper PresentattheSemeAd – SemináriosemAdministrac¸ão.
Wetzels,M.,Odekerken-Schroder,G.,&VanOppen,C.(2009).UsingPLS pathmodelingforassessinghierarchicalconstructmodels:Guidelinesand empiricalillustration.MISQuarterly,33(1),177–195.
Wickramasinghe,A.,&Gamage,H.R.(2013).Competingforsustainability withincarbonconstrainedworld:Astrategicclimatechangeplanning frame-work.InternationalJournalofInnovationandSustainableDevelopment,