Capital Structure, Cash Holdings and Firm Value: a Study of Brazilian
Listed Firms
Tiago Rodrigues Loncan
M.Sc. in Business Management, Federal University of Rio Grande do Sul, Student, Laurea Magistrale in Economics, University of Bologna E-mail: [email protected]
João Frois Caldeira
Adjunct Professor, Department of Economics and Graduate School of Management. Postgraduate Program in Management, Federal University of Rio Grande do Sul E-mail: [email protected]
Received on 3.31.2013 – Desk acceptance on 3.31.2013 – 3rd. version approved on 2.12.2014
ABSTRACT
This study analyzed the relationship among capital structure, cash holdings and firm value for a sample of publicly traded Brazilian firms, through panel data regressions, employing the fixed-effects estimator. Initially, it was estimated regressions between capital structure (debt to total capital) and cash holdings (cash to assets), as well as between cash holdings and short and long-term debt. Next, it was applied a regression among firm value, capital structure and cash holdings. The results of this study suggested that debt, both short and long-termed, is negatively related to cash holdings, and that the level of cash holdings is also associated to a lower leverage. The study also presented indirect evidence that financially constrained firms hold more cash. Regarding to the impact of the capital structure on the firm value, short-term debt, long-term debt and the financial constraint had negative marginal effects on the firm value, suggesting a risk-averse behavior of investors in relation to debt. Cash holdings, instead, is valued as positive by investors, but up to an optimum threshold level. Further, the market capitalization is discounted with respect to cash holdings (inverted U-curve), in synergy with static trade-off theory of cash holdings.
1 INTRODUCTION
In a so called “perfect market economy”, in which there are no frictions, transaction costs and taxes, the way firms’ investments are financed would be irrelevant for the firm value, as proposed by Modigliani and Mil-ler (1958). However, it is clear that financial markets cannot be defined in such ways. As argued by Portal, Zani, and da Silva (2012), frictions and transaction costs are indeed real constraints that firms must face when choosing their financing strategy. Considering this setup of frictions, transaction costs and asymme-try of information in debt markets, and also building on Harris and Raviv (1991), the choice between debt and equity financing, and the resulting level of leverage might affect firm value.
Sunder and Myers (1999) argue that among the many theoretical frameworks proposed to evaluate the ratio-nal and consequences of capital structure choices, two theories are the most prominent: the static trade-off theory and the pecking order theory. The static trade-off theory argues that there is a target level of debt-to-equity ratio, in which the present value of tax-shields (tax benefits) would equal the financial distress cost (bankruptcy risk), point in which firm value would be maximized (Sunder & Myers, 1999). The Pecking Or-der Theory, instead, proposes that the level of debt of a given firm does not follow a target, but just an order of preference of financing options determined by availa-bility and cost of resources. Firms would contract debt when they cannot balance their resource requirements for financing new projects with their internal cash ge-neration (Myers, 1984).
Regarding cash holdings, a similar discussion was proposed in former research. The static trade-off mo-del of liquid assets, by Miller and Orr (1966), predicts that firms balance the main cost of holding cash, which is the opportunity cost of holding no interest-bearing money, versus the main benefit of holding cash which is to guarantee funding for future investments in the event of a cash flow shortage. Optimum cash would be set when marginal cost and benefit intercept. It follo-ws from the existence of an optimum value for cash holdings that the cash policy can impact firm value. On the other hand, a Pecking Order of cash holdings should yield similar predictions as for leverage: no tar-get level of optimum cash, as cash would be used as a buffer between retained earnings and investment needs (Ferreira & Vilela, 2004).
Other stream of literature considers cash just as nega-tive debt. As argued by Acharya, Almeida, and Campello (2007), the view that cash is negative debt would hold only if financial markets were frictionless. If there are contracting costs and costs arising from asymmetry of information, as argued by authors, these costs should in-fluence the financing policy of firms, and cash holdings would have indeed an economic value, not being only the
reverse of debt. Cash holdings would play an important role especially for financially constrained firms, as they face higher costs to access external financing. Moreover, many past studies documented a negative relationship between leverage and cash holdings (Ferreira & Vilela, 2004; Opler, Pinkowitz, Stulz, & Williamson, 1999; Bi-gelli & Sanchez-Vidal, 2012; D’Mello, Krishnaswami, & Larkin, 2008).
The Brazilian setup is an interesting environment to study the problem. Because due to long dated economic policies, the cost of capital is much higher than in more developed countries and many firms suffer from credit constraints (Terra, 2003). Also, the debt market in Brazil is less mature when contrasted to US or European ma-rkets, with less transactions and lower liquidity (Sheng & Saito, 2008). Other interesting feature is that because emerging economies, including Brazil, tend to have hi-gher interest rates when compared to more developed economies (Neumeyer & Perri, 2005), the opportunity cost of holding cash is higher. Hence, a study combi-ning the financial leverage and cash holdings policies can yield interesting insights about how these variables behave in a financial market that can be restrictive, in which firms can run short of cheap capital to finance their investments.
Moreover, in a financial market characterized as such, it is interesting to assess how financing and cash policies can affect firm value. Because of high costs, is debt perceived as negative by investors, and, if it is affirmative, does the maturity of debt (short or long-term) influence firm value differently? Considering a high opportunity cost of holding cash coupled with the possibility of facing restrictions to finance future in-vestments due to financing cost escalation, how is the cash holdings position of a firm priced by investors in terms of impact on firm value?
and important financial characteristics that differ from other economies that have more mature and developed financial markets. There were many former studies do-cumenting theoretical rationales for both capital struc-ture and cash policies to affect firm value, but not so
many papers addressed the problem empirically, and even fewer (if any) evaluated how capital structure and cash holdings affect firm value in a single study, leaving room for further investigation. We tackle this problem in our study, hence presenting contributive insights.
2 LITERATURE REVIEW
2.1 Capital Structure.
Many former studies aimed to establish determinant factors of capital structure. Although, depending on the departing theory, different assumptions can be made about the relationship between variables and capital structure levels, some general patterns have been identified (Smart, Megginson, & Gitman, 2007). We shortly review some of the most important determinants.
Leverage has an important within-industry pattern, whi-ch means, firms usually whi-choose capital structure in ways that it would converge to the average of the industry (Ho-vakimian, Opler, & Titman, 2001). Larger firms usually rely more on debt, as the firm size itself is trustworthy collateral for guaranteeing the service of debt or the payment of the re-sidual cash in case of liquidation (Rajan & Zingales, 1995).
Growing firms normally present growing cash flows too, so debt financing is usually replaced by internal funding. Also, growing firms are riskier, so the finan-cial distress cost should be higher, hence implying less debt (Frank & Goyal, 2009). In the same direction, Pe-robelli and Fama (2003) argue that growing firms are more prone to rely on the equity market to finance new projects. In the same line, Kayo and Famá (1997) found that leverage is lower for growing firms for a sample of Brazilian companies.
The more profitable the firm is, the less debt it ten-ds to employ (Kayhan & Titman, 2007). The same re-sult was reported by Futema, Basso, and Kayo (2009), analyzing Brazilian public companies. Since profitable firms can accumulate profits, they may use retained earnings to finance new investments, using debt only after running short of internal resources. A similar re-asoning may apply to cash flows. As argued by Jensen (1986), firms that generate more cash flows can use the-se resources to redeem debt, and by having high cash flows, managers don’t need external financing (Ferreira & Vilela, 2004). Hence, leverage is likely to be decrea-sing on cash flows.
As argued by Ferreira and Vilela (2004), the rela-tionship of cash holdings with leverage can have two possible forms. First, because more levered firms want to reduce the risk of financial distress, as the cost of amortization plans of debt is likely to put a burden on firm’s treasury, they could hold high quantities of cash. On the other hand, because the leverage ratio is a proxy for the credit status of a firm or its ability to issue debt, higher leverage can be associated to lower cash holdin-gs. However, as suggested by D’Mello, Krishnaswami, and Larkin (2008), cash holdings could be endogenous to leverage. The argument is that, as the determinants
of cash are so closely related to the determinants of le-verage, it is interesting to assess whether they are two sides of the same coin, similar to the discussion deve-loped by Acharya et al. (2007) that suggested that cash could be negative debt.
Following the static-trade off approach, as argued by Sunder and Myers (1999), escalated costs of debt should lead to a situation in which the cost of debt is so high that firms can’t keep increasing borrowing. Also following Pecking order, if the cost of debt becomes too high, it may overcome even the cost of other sources of funds, like equity. Hence, increasing costs of debt should lead to a reduction or at least saturation point of leverage.
One last important determinant of debt that we ap-proach in the review is the role of stock market liquidity. It is because firms’ stocks that show high trading volume allow these firms to rely more on the equity market for financing, high liquidity usually affects capital structure by reducing the level of leverage (Lipson & Mortal, 2009; Morellec, 2001). One other result that relates stock market activity with leverage is the one reported by Dimitrov and Jain (2008), in which growing debt is associated to negative stock market returns.
Under an Agency-Theory perspective, the decision on which source of financing will be chosen by firms reflects conflicts among managers, equity holders and debt holders. Contracting debt implies that the firm will have to face the cost of this option by doing cash payments in the future, in such ways that managers would have less cash available to spend in general ex-penses. Debt financing could be a way equity holders could monitor and constraint manager’s expending behavior (Jensen, 1986).
Under the agency-theory approach, optimal capital structure would be obtained by balancing the agency costs and the agency benefits of debt among all cash claimants (Leland, 1998). As the financing by debt would be a way to balance power and expectations among all cash streams claimants, the final impact of leverage into firm value is considered to be positive (Harris & Raviv, 1991).
Bradley, Jarrel, and Kim (1984) argue that, instead, optimal capital structure is a function of the trade-off between the tax benefits of debt and the associated costs (risks) of bankruptcy. Firms would reach optima-lity of capital structure precisely by balancing the be-nefits and costs of financing options (Bancel & Mitto, 2004). That is the main postulate of the Static Trade-off Theory of capital structure.
For Sunder and Myers (1999), the static model is based on the existence of an optimality point between the present value of the benefits of tax shields and the present value of costs of financial distress, being the firm value maximized when these two elements equate on their margins. Tax be-nefits arise because firms can deduct the interest cost of debt from the taxable profits, booking the paid interest as a financial expense (Procianoy & Schmitt, 1995). On the other hand, the marginal cost of financial distress is a growing function of the debt level, so the more levered the firm is, higher is the probability of bankruptcy (Smart et al., 2007). Once firms have identified this point of op-timality, they would target the resulting capital structure level. So the decisions of issuing more debt or switching for internally funding over time would reflect this chase of an equilibrium point of debt-to-equity ratio in which firm value is maximized.
The concept of asymmetry of information is the underpinning for other two important capital struc-ture theories. Ross (1977) proposed a model in which managers may use the proportion of debt to signal to stock market investors that the future prospects of the firm are actually better than what is incorporated in the stock prices. Since managers are insiders and hence are better informed, they will be more accurately to as-sess than outside investors what are the future earnings streams for the company.
Issuing more debt would be a signal of the high qua-lity of the future cash flows, and assuming that only hi-gh-quality firms would bear the risk of issuing debt (that means, this signal could not be falsely imitated by low-quality firms), managers would opt for financing new projects with debt to signal good future prospects, being compensated by superior performance and penalized by growing bankruptcy risks. This model is known exactly as the Signaling Theory of capital structure, and predicts that, given the fact that debt signals good news about the firm, more levered firms would exhibit better stock ma-rket performance (Harris & Raviv, 1991). On the other hand, Dimitrov and Jain (2008) reported that growing debt is associated to negative stock market returns, con-tradicting the expected results of signaling theory.
The Pecking Order theory, differently from the other theories we discussed so far, departs from another con-cept. Myers and Majluf (1984) suggest that if inside ma-nagers are better informed then outside investors about the current value of the firm’s equity, it implies that equity may be mispriced by the stock market.
Hence, financing new projects by issuing new equity would make underpricing even more severe, and the new investors who acquired the recently issued shares would capture value at the expenses of prior shareholders. Under these conditions, managers would forego even projects with positive net preset value, preventing value destruction for current shareholders. Firm then would go through an unde-rinvestment process. The way to solve this undeunde-rinvestment problem would be to finance new ventures using a security that is not so undervalued (Harris & Raviv, 1991). Internally generated resources and debt (at acceptable risk levels) are sources of funds that do not involve undervaluation.
For Sunder and Myers (1999), the choice among in-ternal cash flows, debt and equity as financing option is done considering the cost of funds. The less costly funds would be internal cash, followed by (moderated-risky) debt, and finally, equity would be issued as a last option. Pecking Order theory advocates that leveraging is a way to reply for a punctual demand for funds, nor-mally when the internal cash flows are not enough to finance new investment opportunities, simply a cost-benefit decision.
2.2 Cash Holdings.
Opler, Pinkowitz, Stulz, and Williamson (1999) ar-gue that managers that maximize shareholder value would set the firm’s cash level such that the marginal benefits of cash equals the marginal costs of holding these assets. The benefits of holding cash are mainly that the firm saves transaction costs when raising fun-ds, also avoiding liquidating assets to make payments, and further because firm has independency to finance investments with these liquid assets, not being harmed when other sources are not available. The main cost of holding cash arises from the liquidity premium dis-count, also defined as the opportunity cost of holding cash. Clearly, this is a static trade-off approach.
On the other hand, under a pecking order theory assumption, firms would not have target cash levels. Instead, cash is used as buffer between retained ear-nings and investment needs. Basically, when retained earnings are not enough to finance new investments, firms use cash holdings to do so, and in the last cir-cumstance, they issue debt (Ferreira & Vilela, 2004). Furthermore, there is a fixed cost of accessing external funding, so firms raise external capital infrequently, therefore relying more often on cash holdings to finan-ce projects (Opler et al., 1999).
Furthermore, by holding more cash, managers incre-ase the amount of assets under their control and gain more power over the firm investment decision. Mana-gers also would escape from raising capital externally, which in turns allows them to not disclose information about investment projects to the outside investor ma-rket (Ferreira & Vilela, 2004).
Bates, Kahle, and Stulz (2009) point out four basic reasons why firms would hold cash. The first reason would be the transaction costs motive, in the sense that firms hold cash to avoid incurring in the costs of con-verting a non-financial cash asset into a more liquid asset, to have resources to meet payments due. The se-cond reason is called the precautionary motive, as fir-ms hold cash to better cope to adverse shocks when external financing is costly.
The third reason is about taxes, because by holding more cash firms can mitigate tax burdens of repatria-ting profits from foreign operations (this reason is clo-sely linked to multinational firms). Finally, the fourth reason would be agency implications, as we discussed before, because entrenched managers tend to build more excess cash balances.
One first determinant of cash holdings would be the magnitude of the costs to access external funding. Firms with facilitated access to capital markets and good credit rating from rating agencies should have lower transaction costs when accessing debt markets, so they are expected to hold less cash. On the other hand, following Acharya et al. (2007), financially cons-trained firms, which can be firms with less easy access to capital markets or firms that are already paying a very high cost of debt due to escalated risk of existing outstanding debt, seeking to avoid to be short of funds to finance investments, would hold more cash.
In a similar fashion, firms facing high investment opportunities are likely to hold more cash, because the cost of being short of cash is letting these projects go away (Han & Qiu, 2007). So to possess the required re-sources for investing in positive NPV projects, firms would hold excess cash. Also, the type of investments may matter, as firms investing more in R&D and ex-pending more in advertising, sales expenses and other discretionary outflows are likely to hold more cash, because the cost of financial distress for these firms is higher, due to a higher proportion of intangible assets in comparison to hard assets (Opler et al., 1999).
Con-versely, higher asset tangibility is associated to lower cash holdings (John, 1993).
Another determinant of cash holdings strictly linked to cash availability is the uncertainty of cash flows. Hi-gher uncertainty of cash flows, or risk, should imply more cash holdings (Ozkan & Ozkan, 2004), as uncer-tainty leads to more situations in which the firm has more outlays then expected.
For firm size, Ferreira and Vilela (2004) argue that depending on the theory approach the expected cash holdings may be opposite. Under a static trade-off as-sumption, there are economies of scale in cash manage-ment; so bigger firms would hold less cash then smaller ones, also because recurring to external funding is usu-ally less costly for large firms. However, under a pe-cking order analysis, larger firms are prone to be more successful, and hence should hold more cash, after con-trolling for investment.
Mikkelson and Partch (2003) discuss whether large cash holdings can hinder operating performance, in the sense that large cash reserves could induce managers to deploy assets in a less efficient way, because there is too much cash available to spend. They find that, actually, higher cash re-serves are associated to higher operating performance.
Prior studies on US public companies showed that fir-ms commit thefir-mselves to regular payment of dividends, to reduce managerial agency costs, as firms must regularly come back to equity market to raise new funds to finance investments. Thus, firms do not adjust their payout po-licy due to performance very frequently, and the expected result between cash holdings and dividends payment is a negative relationship (Bigelli & Sanchez-Vidal, 2012).
Finally, more levered firms are expected to hold less cash, as debt grows when investment exceeds re-tained earnings and falls when investment is less than retained earnings. Cash holdings follow the inverse tendency, falling when investment needs exceeds re-tained earnings and growing when the opposite takes place. However, as pointed by Portal, Zani, and da Silva (2012) and Acharya et al. (2007), when firms are sub-ject to high external financing costs (constrained fir-ms), internal and external funds are more complemen-tary than substitute forms of financing, so the inverted relation between cash holdings and leverage may not prevail, as cash holdings and cash flows are positively related (a similar discussion to the difficulty to access external financing we did previously).
3 METHODS
3.1 Sampling and Data.
Our sample consists of all non-financial firms listed in the Brazilian stock market (BOVESPA – São Paulo Sto-ck Exchange), in the period between 2002 and 2012. The sample includes firms from all non-financial sectors of the economy, and hence we consider it as a good repre-sentation of Brazilian business environment. We collected yearly observations for each firm, in a panel that spans
from 10 years, which allows capturing a whole decade of business activity. We did not restrict firms in the sample to contemporaneous listing, to maximize the heterogenei-ty of the sample. As a result, the panel is unbalanced, as many firms went public exactly during the period covered by the sample, so we don’t have the same quantity of ob-servations for all firms sampled.
Tool. We removed outliers that presented inconsistent financial ratios which let us understood that could be caused by imprecise figures in the database (like ex-plosive financial ratios), and we also eliminated obser-vations which let us understood that would not fit a study of capital structure, like firms reporting negative equity due to accumulated losses. For the variables that we managed to build the largest panel possible, we run models with up to 2.038 observations concerning 288 different firms during 2002-2012 (having some firms presented missing variables in some years). When in-cluding some controlling variables that were not avai-lable in the database of Economatica for some firms, or for some years, models had reduced numbers of ob-servations, but no less than 1.101 observations for 209 different firms. Hence, we considered that for both the largest and the smallest panels we used to estimate the regression models, the sample was comprehensive and heterogenic enough.
3.2 Empirical Models.
In this section we present the regression models we es-timated. Following Wooldridge (2004) and Gujarati (2006), we employed panel data regressions using the Fixed Effects estimator, generally defined as:
Y is the dependent variable for firm i in time t; alpha is the firm-varying linear coefficient (constant); betas are the angular coefficients;
X and W are independent (explanatory) variables; epsilon is the residual.
To ensure that the models were estimated respecting the main assumptions of the linear regression’s model, we conducted appropriated tests. To prevent problems with heteroskedasticity, we used heteroskedastic robust stan-dard errors. To test for serial autocorrelation of residuals, we used the Durbin Watson statistic. Finally, we checked for possible cases of multicollinearity among regressors by analyzing the correlation coefficient among them, making sure there were no strong correlations that could signal multicollinearity.
The first model relates capital structure to cash holdin-gs, also controlling for important variables. Model 1 is pre-sented below:
D/Cap is Debt to Capital, defined as the book value of total debt divided by the book value of equity plus the book va-lue of total debt;
C/TA is cash holdings, defined as cash divided by the total book value of assets;
lnTA is the log of Total Assets;
Yit =αi + β1Xit + ... + β2Wit+ εit 1
D/Capit =αi + β1C/TAit + β2lnTAit + β3ROICit + β4EB/TAit
+ β5NetCapex/TAit + β6FE/EBit + β7FE/EBit + β8Liqit + εit 2
2
ROIC is the Return on Invested Capital;
EB/TA is the ratio of gross cash flows (EBITDA) divided by Total Assets;
NetCapex/TA is Capital Expenditures net of depreciation divided by Total Assets;
FE/EB is Financial Expenses divided by EBITDA, linear and quadratic forms;
Liq is the liquidity ratio, calculated by dividing the stock’s trading volume in R$ millions by the Market Value of Equi-ty in R$ Millions;
Epsilon is the residual.
Debt to Capital is the dependent variable of the mo-del, and was defined as previously explained. The main independent variable of interest is Cash Holdings. For controlling purposes we used the natural log of Total Assets (lnAT) for size, Net Capex to Total Assets is a proxy for growth / investment opportunities. Return on Invested Capital (ROIC) is the proxy for profitabili-ty. EBITDA over Assets (EB/TA) is a measure for gross cash flow generation capacity. Financial Expenses di-vided by EBITDA (FE/EB) in its linear and quadratic form control for the effect of escalating costs of debt service on the debt level, and finally the Liquidity (Liq) controls for stocks’ traded volume.
The second model relates cash holdings to long-term and short-long-term debt, controlling for important variables that may impact cash holdings. Model 2 is described next:
C/TA is cash holdings;
stD/Cap is short-term debt to capital1;
ltD/Cap is long-term debt to capital2;
sqrtMVE is the square root of the market value of equity; NetCapex/TA is Capital Expenditures net of depreciation divided by Total Assets;
PPE/TA is Property, Plant & Equipment divided by Total Assets;
SGA/NOR is Selling, General & Administrative expenses divided by Net Operating Revenue;
NOR/TA is Net Operating Revenue divided by Total As-sets, the Assets Turnover;
Beta is the beta coefficient of firm’s stock; DivYld is the dividend yield;
Constr is a dummy for potential financially constrained firms.
In the model exposed above, Cash Holdings is the dependent variable, and Short and Long-term Debt to Capital are the main independent variables. We split debt into short and long-term debt to assess whether the debt maturity can have a different impact on cash holdings, as suggested by Ferreira and Vilela (2004).
C/TAit =αi + β1stD/Capit + β2ltD/Capit + β3sqrtMVEit
+ β4NetCapex/TAit + β5PPE/TAit
+ β6SGA/NORit + β7NOR/TAit
+ β8Betait + β9DivYldit + β10Constrit + εit 3
The other variables in the model were used for con-trolling purposes, to allow for a ceteris paribus effect of debt on cash holdings.
The square root of market value of equity (SqrtMVE) is controlling for size, following Amihud (2002), being in-cluded, in accordance with the literature, as smaller firms are likely to hold less cash (Ferreira & Vilela, 2004; Opler et al., 1999). NetCapex/TA captures the real investment, as investment may affect cash positively, because firms investing more are more likely to better investment op-portunities, and thus would hold more cash (Han & Qiu, 2007). PPE/TA is a proxy for asset tangibility, as firms with a more tangible assets base are likely to keep lower cash balances (John, 1993).
SGA/NOR is a proxy for discretionary expenses, like advertisement and other general and selling expenses, building on insights that firms with more discretiona-ry expenses must hold more cash to cope with these cash outlays (Fresard, 2010). NOR/TA or Asset Turns is a proxy for operating performance / efficiency, follo-wing insights of Mikkelson and Partch (2003) that too much cash reserves could affect efficiency negatively. Beta was used to proxy for firm’s risk, as riskier firms should hold more cash (Ferreira & Vilela, 2004), and DivYld is our variable to proxy for firm’s payout po-licy, building on the prediction that dividend payment should be associated to lower cash holdings (Bigelli & Sanchez-Vidal, 2012).
The variable Constr is a dummy for financially constrained / unconstrained firms. To define if a firm is potentially financially constrained / unconstrained we used a different approach compared to prior stu-dies, and the insight to use it came from ex post our estimation of the model on debt. Anticipating some of the results, we found that Debt to Capital and Financial Expenses over EBITDA3 present an inverted U-shaped
curve relationship. It means that after the leverage le-vel is associated to a high cost, as a higher fraction of gross cash generated (EBITDA), is necessary to pay the service of debt, the debt level starts to marginally fall. In other words, on average, there is a threshold for the cost of debt that maximizes the leverage level of firms. From that point, leverage falls.
The idea is that growing levels of committed gross cash flows to pay debt would create a situation of fi-nancial constraint, because the firm could not contract more debt4. If the firm presented a value for
FE/EBI-TDA on the 75% percentile of sample, we considered that a high fraction of cash flows was allocated to pay debt service, and the value of 1 was designated for it, being the firm considered potentially constrained. If the value for FE/EBITDA was inferior to the 75%
per-centile, the value designated for the dummy was zero. D’Mello et al. (2008) also used a dummy variable to capture possible capital constraints, but they used a bi-nary rule for rated debt, instead.
To double check for the intuition that we could cap-ture financial constraint by this method, in one of the models developed in the study we regressed the Market-To-Book ratio against the dummy Constr, among other explanatory variables, to assess if investors would dis-count the value of financially constrained firms (as de-fined in our methodology) differently from financially unconstrained firms. We are going to present the output for this regression in the later section of results, but we anticipate that the firms we set as potentially constrained were further discounted in comparison with the ones we set as unconstrained5.
The third model explores the relationship among firm value, capital structure and cash holdings, controlling for important variables. Model 3 is presented next:
MKB is the Market to Book ratio (Market value of assets divided by book value of assets);
stD/Cap is short term debt divided by total capital6;
ltD/Cap is long term debt divided by total capital7;
C/TA is cash to assets (cash holdings);
C/TA squared is cash to assets in the quadratic form; Constr is the dummy for potentially financially constrai-ned / unconstraiconstrai-ned firms;
(Constr)x(stD), (Constr)x(ltD) and (Constr)x(C/TA) are interactions between the dummy Constr and short-term debt, long-term debt and cash holdings;
lnNOR is the natural log of Net Operating Revenue (Size); Net Capex to Total Assets is the variable for investment op-portunities;
ROIC is return on invested capital, for profitability; Liq is the liquidity ratio, controlling for stock’s liquidity; Epsilon is the residual.
Market-to-Book ratio (MKB) is the dependent variable, Cash Holdings (C/TA), in linear and quadratic forms, Short and Long-term Debt to Capital (ltDebt/Cap; stDebt/Cap) and Financial Constraint (Constr) are the main indepen-dent variables. We also control for the impact of Liquidity (Liq), Size (lnNOR), Investment Opportunities (NetCapex/ TA) and Profitability (ROIC) on firm value. We also allo-wed for interactions between the Constr dummy with Cash Holdings and Short and Long-term Debt.
It is important to discuss our choice to use distinct
3 Financial Expenses over EBITDA is commonly used as a covenant in debenture issues to signal high levels of risk due to growing debt costs that would trigger an earlier liquidation of the debenture. Usually it is stated as EBITDA / FinExp, but we inverted it to have a ratio, thus facilitating the comparison of the elasticity to the debt-to-capital ratio.
4 In this approach we are considering that irms are debt-constrained. We did not incorporate any measure of equity constraint, for example.
5 Besides, we further correlated the Constr dummy with other three variables that according to past studies would be negatively correlated to inancially constrained irms (Acharya et al., 2007; Almeida & Campello, 2007): a) NetCapex/Assets, as a proxy for current investment (Corr=-0.08, p-value < 0.01). b) Market-To-Book, as proxy for future investment opportunities (Corr=-0.11, p-value <0.01). c) ln Tangible Assets (Total Assets – Liquid Assets): (Corr.=-0.21, p-value < 0.01). The negative and statistically signiicant correlations further suggest that we captured at least partially the inancial constraint with our dummy. 6 Short term debt is the sum of short term loans, inancings and debentures divided by total capital, which is total debt plus the book value of equity.
7 Long term debt is the sum of Long term loans, inancings and debentures divided by total capital, which is total debt plus the book value of equity. 2
MKBit =αi + β1stD/Capit + β2ltD/Capit + β3C/TAit
+ β4C/TAit + β5Constrit + β6(Constr)x(stD)it
+ β7(Constr)x(ltD)it + β8(Constr)x(C/TA)it + β9lnNORit + β10NetCapex/TAit
models in the study, instead of employing simultaneous equations. There is theoretical support for a model su-ggesting that capital structure and cash holdings may affect firm value (mainly the static trade-off theory, as discussed previously). However, to test the converse, that cash holdings and capital structure may be caused by the firm value is a more complicated relationship that has no such strong theoretical support, being not reaso-nable to assume beforehand that this relationship may hold for the models proposed in this study. Some studies documented that the market value of the firm may serve as collateral for borrowing, causing some endogeneity between firm value and leverage, but it applies to pure financial firms (Adrian & Shin, 2010). However, our sample does not contemplate this kind of firms.
Furthermore, if the information regarding leverage and cash policy influences firm value, this information conveys relevant news to investors and thus must have a price. If we assume that firm value, leverage and cash holdings are set simultaneously, at the moment inves-tors price a firm’s stock they should know what are the relevant figures for cash and leverage, but as these fi-gures are proprietary information of the management of the firm, the best investors can do is to try to guess what these values are, but they don’t know for sure, being exactly this the reason why firm value should ad-just ex post to information on cash policies and levera-ge when these are released. Thus, having no theoretical base to suggest reverse causality or simultaneity among firm value, cash holdings and capital structure, neither, prior evidence of endogeneity among the three varia-bles, we preferred to use separate equations.
Former studies suggested a possible endogeneity of leverage in the determination of cash holdings, as cash could be negative debt. However, as argued by Acharya et al. (2007), cash holdings are an important component of firms’ optimal financing structure, being correlated to firm value, growth opportunities, risk and performance. Cash policies would be affected by a range of aspects, from access to capital markets to laws protecting minority investors, but literature largely suggests that cash holdings should not be seen as negative debt for a large fraction of firms, as cash would fulfill an important economic role. Moreover, the standard valuation models that give intui-tion for cash to be just negative debt assume fricintui-tionless in financing markets. If we assume that contracting and information frictions entail additional costs to external financing (Acharya, Almeida, & Campello, 2007), cash holdings will hardly be just negative debt, having an auto-nomous economic value. Considering the Brazilian finan-cing market case, credit restrictions are very pronounced, especially for small and medium sized firms, building on the argument of Terra (2003). Thus, in a restrictive finan-cing market, we understand that it is more likely that cash holdings indeed play a role, weakening the argument that cash holdings is just the reverse side of debt.
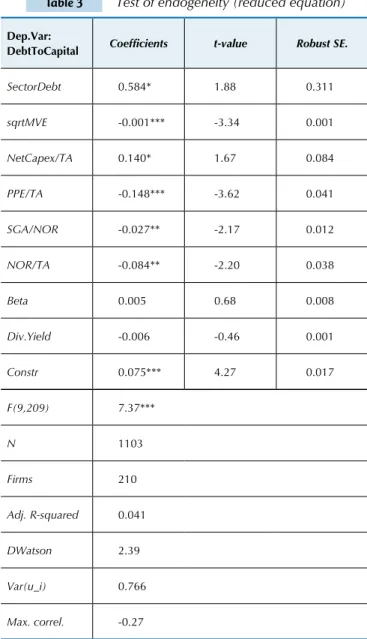
To provide support to this view, we tested for the en-dogeneity of leverage in the determination model of cash
holdings, using the instrumental variables approach, as suggested by Wooldridge (2004). The instrument for le-verage we used was the Ale-verage Sector Lele-verage ratio, following D’Mello et al. (2008), as it affects firm choice for leverage, because firms target their industry’s leverage ratio when deciding on their own ratio (being a relevant instrument), but it does not affect the cash policy directly, acting on the dependent variable only through the pos-sible endogenous variable, which is leverage (being exo-genous). For simplicity we used the total Debt to Capital, instead of dividing it between short and long term, to fa-cilitate the implementation of the instrument.
The main idea of the test is to first estimate a reduced equation, which is similar to the structural equation (the equation we want to estimate initially, in our case, the mo-del for cash holdings), but the dependent variable in this reduced equation is the possible endogenous variable (le-verage), the main independent variable is the instrument (Sector Average Debt), and the controlling variables are the other regressors of the structural equation. The reduced equation is shown below:
One important condition is that the coefficient for the instrument must be statistically different from zero to en-sure relevance (in our model, coefficient beta1 for Avg-SectorDebt). After estimating the reduced equation, the residual of this regression is to be included as a regressor in the structural equation, and in the case that the residu-al of the reduced equation is correlated with the residuresidu-al of the structural equation (being a significant regressor in the structural equation regression), indeed the hypothesis of endogeneity holds. The residual of the structural equa-tion becomes a funcequa-tion of the residual of the reduced equation (Vit) plus an error term (Nit).
Finally, we replace the residual epsilon, as defined abo-ve, in the structural equation:
The main condition for the endogeneity to hold is that the coefficient Gamma1 must be statistically different from zero. We rejected this hypothesis, thus concluding for the model of cash holdings we specified that leverage is not en-dogenous (results are reported in the next section). This finding suggested that using separate equations would be more appropriate, as in the absence of endogeneity among variables, the Fixed Effects estimator is more efficient than the Instrumental Variables or Two-Stage Least squares esti-mators, as the Fixed Effects estimator applies OLS after the demeaning of variables (Wooldridge, 2004).
D/Capit =αi + β1AvgSectorDebtit + β2sqrtMVEit
+ β3NetCapex/TAit + β4PPE/TAit
+ β5SGA/NORit + β6NOR/TAit
+ β7Betait + β8Div.Yldit + β9Constr.Firmsit + εit 5
εit = γ1 vit + ηit
C/TAit = β1D/Capit + β2sqrtMVEit + β3NetCapexAssetsit
+ β4PPE/TAit + β5SGA/NORit + β6NOR/TAit
+ β7Betait + β8DivYldit + β9Constrit + γ1 vit + ηit 6
4 RESULTS
4.1 Descriptive Statistics.
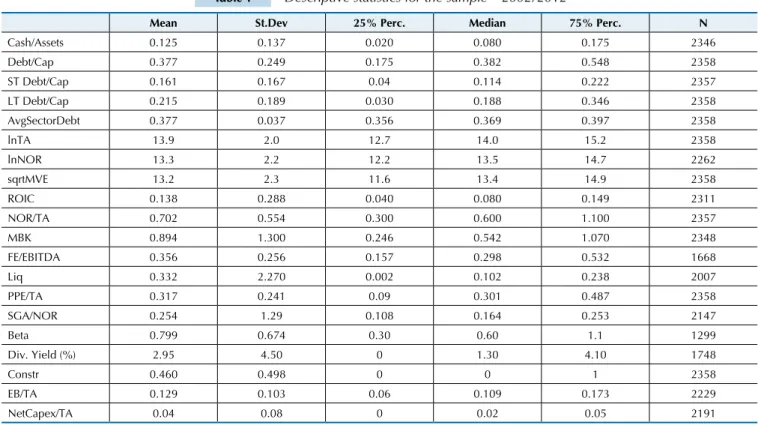
Table 1 Descriptive statistics for the sample – 2002/2012
Mean St.Dev 25% Perc. Median 75% Perc. N
Cash/Assets 0.125 0.137 0.020 0.080 0.175 2346
Debt/Cap 0.377 0.249 0.175 0.382 0.548 2358
ST Debt/Cap 0.161 0.167 0.04 0.114 0.222 2357
LT Debt/Cap 0.215 0.189 0.030 0.188 0.346 2358
AvgSectorDebt 0.377 0.037 0.356 0.369 0.397 2358
lnTA 13.9 2.0 12.7 14.0 15.2 2358
lnNOR 13.3 2.2 12.2 13.5 14.7 2262
sqrtMVE 13.2 2.3 11.6 13.4 14.9 2358
ROIC 0.138 0.288 0.040 0.080 0.149 2311
NOR/TA 0.702 0.554 0.300 0.600 1.100 2357
MBK 0.894 1.300 0.246 0.542 1.070 2348
FE/EBITDA 0.356 0.256 0.157 0.298 0.532 1668
Liq 0.332 2.270 0.002 0.102 0.238 2007
PPE/TA 0.317 0.241 0.09 0.301 0.487 2358
SGA/NOR 0.254 1.29 0.108 0.164 0.253 2147
Beta 0.799 0.674 0.30 0.60 1.1 1299
Div. Yield (%) 2.95 4.50 0 1.30 4.10 1748
Constr 0.460 0.498 0 0 1 2358
EB/TA 0.129 0.103 0.06 0.109 0.173 2229
NetCapex/TA 0.04 0.08 0 0.02 0.05 2191
The Table 1 presents the main descriptive statistics for the variables analyzed in the study:
In the analysis of descriptive statistics we focus on cash holdings and debt levels, as they are the main va-riables of interest of the study. Average Cash to Assets ratio was 12.5% of cash over total assets. Firms in the lowest 25% percentile had on average only 2% of cash out of total assets. Median cash holdings was 8% of cash out of total assets, whereas firms in the 75% percentile had cash positions of over 17% of cash out of total assets. Comparing these numbers with prior studies, Opler et al. (1999) reported that the average cash-to-assets ratio (assets net of cash) for their sample of US publicly traded firms was 17%, with median of 6%. Ozkan and Ozkan (2004) reported a cash-to-assets ratio of 10% for publi-cly traded UK firms. Bigelli and Sanchez-Vidal (2012) found cash-to-assets ratio of 10% of privately held Ita-lian firms. Ferreira and Vilela (2004) reported 14.8% of cash-to-assets ratio for European firms. We can notice that cash holdings of Brazilian firms are roughly in the same pattern, being slightly higher comparing the mean with the UK evidence and the median with the US evi-dence. Compared with European firms, cash holdings of Brazilian firms are roughly in the same proportion.
For Debt to Capital, the mean was 37% of debt out of to-tal capito-tal. Low debt firms in the 25% percentile had 17% of debt to total capital, whereas firms in the 75% percentile pre-sented debt to capital ratios of over 55%. Opler et al. (1999) reported 21% of debt to assets ratio, whereas Ferreira and Vi-lela (2004) documented 24% for the same variable. For better
comparison sake, Debt to Assets for Brazilian firms was 28%, a figure close, but slightly higher than for US and for Europe-an firms. Long-term Debt was 21.5% of total capital, whereas Short-term debt was 16.1% of total capital employed.
4.2 Results of Regressions.
Table 2 Determinants of debt
Dep.Var:
Debt/Capital Coeficients t-value Robust SE.
C/TA -0.100* -1.67 0.059
lnTA 0.068*** 5.28 0.013
NetCapex/TA 0.088* 1.87 0.047
ROIC -0.001 -0.62 0.001
EBITDA/TA 0.044 0.56 0.080
FE/EBITDA 0.356*** 4.19 0.085
(FE/EBITDA)sq -0.169* -1.96 0.086
Liq 0.006 0.77 0.008
F(8,280) 14.4***
N 1574
Firms 275
Adj. R-squared 0.2113
DWatson 2.40
Var(u_i) 0.7581
Max. correl.8 0.57
*** Significant at 0.01 level; ** Significant at 0.05 level; *Significant at 0.1 level
Table 2 summarizes results for Model 1. Debt to Ca-pital ratio is the dependent variable, whereas Cash Hol-dings is the main independent variable in which we are interested. The regression is statistically significant, pre-senting an Adjusted R-squared of 0.2113. Cash Holdings, measured by Cash-to-Assets ratio is negatively related to leverage (-0.10; p-value < 0.1). Firm size, measured by the natural log of assets, is positively related to leverage (0.06; p-value <0.01). Leverage is increasing in growth / investment opportunities, as measured by the NetCa-pex/TA (0.08; p-value < 0.1). Profitability (ROIC) and Gross Cash Flows to Total Assets (EB/TA) were not sta-tistically different from zero. The relationship between Financial Expenses to EBITDA (FE/EBITDA) and leve-rage is not linear, as both the linear and quadratic forms of the variable are statistically significant (Linear form: 0.356; p-value < 0.01; Quadratic form: -0.169; p-value < 0.1). Liquidity of stocks traded, measured by the variable Liq (volume traded divided by Market Value of Equity), is not statistically significant.
The finding that leverage is decreasing in cash hol-dings is in line with finhol-dings of other prior studies (Opler et al., 1999; Ferreira & Vilela, 2004; Bigelli & Sanchez-Vidal, 2012; D’Mello et al., 2008). Also, it makes sense in light of Pecking Order, as these sources of funds can be considered alternative resources one to the other, because firms holding more cash would use this cash reserves to finance projects, having a lower need for external financing and hence employing less debt (Sunder & Myers, 1999).
Leverage as an increasing function of size is in line with former studies. Following Rajan and Zingales (1995), larger firms can use their assets base as a colla-teral, and borrow more money at lower relative costs, hence being able to use more debt financing. Debt being increasing in investments signals that firms are financing growth opportunities with debt rather than with internal resources.
he last discussion on the irst model is about the rela-tionship between debt and debt cost or gross cash low com-mitment to pay the debt service (Financial Expenses over EBITDA). he econometric model supports an inverted U-shaped relationship between these two variables, or, in other words, there would be a given level of gross cash low com-mitment to repay debt that would maximize the debt level, as the coeicient for the liner term of FE/EBITDA is positive and the coeicient for the quadratic term for the variable is negative, being both statistically signiicant. Further, from that given point, it could be the case that debt becomes too expensive and, at the margin, starts to decrease. his result is in synergy with the argument of D’Mello et al. (2008), that irms paying higher service on their debts are more likely to face inancial distress, so debt levels are expected to fall at the margin as debt service cost rises.
This result, however, does not imply that firms over this maximum threshold are necessarily debt-constrai-ned, as the result is derived from an average-median behavior. But the econometric result gives some
intui-tion that firms that commit too much of their gross cash flow generation paying financial expenses are likely to become constrained if this commitment becomes too elevated. This was the intuition that led us to set firms only in the 75% percentile of FE/EBITDA, instead of using the mean or median as a threshold, as candidates for being financially constrained firms when we desig-ned the dummy we used for the model of Cash Holdin-gs and Firm Value.
he second model we estimated had Cash Holdings, measured by Cash-to-Assets ratio as dependent variable, and short and long-term debt to capital as the main in-dependent variables. Before presenting the results of this model, we present the results for the test of endogeneity of leverage and cash holdings:
Table 3 Test of endogeneity (reduced equation)
Dep.Var:
DebtToCapital Coeficients t-value Robust SE.
SectorDebt 0.584* 1.88 0.311
sqrtMVE -0.001*** -3.34 0.001
NetCapex/TA 0.140* 1.67 0.084
PPE/TA -0.148*** -3.62 0.041
SGA/NOR -0.027** -2.17 0.012
NOR/TA -0.084** -2.20 0.038
Beta 0.005 0.68 0.008
Div.Yield -0.006 -0.46 0.001
Constr 0.075*** 4.27 0.017
F(9,209) 7.37***
N 1103
Firms 210
Adj. R-squared 0.041
DWatson 2.39
Var(u_i) 0.766
Max. correl. -0.27
*** Significant at 0.01 level; ** Significant at 0.05 level; *Significant at 0.1 level
Table 4 Test of endogeneity (structural equation)
Dep.Var:
CashAssets Coeficients t-value Robust SE.
DebtToCapital -0.112*** -2.78 0.045
sqrtMVE -0.001 -0.65 0.001
NetCapex/TA -0.040 -0.64 0.063
PPE/TA -0.118** -2.19 0.056
SGA/NOR 0.011*** 12.80 0.001
NOR/TA -0.035 -1.33 0.028
Beta 0.005 1.27 0.004
Div.Yield 0.001 0.10 0.006
Constr 0.007 0.27 0.027
Vit 0.205 0.28 0.2920
F(10,208) 108.64***
N 1102
Firms 209
Adj. R-squared 0.087
DWatson 2.29
Var(u_i) 0.745
Max. correl. 0.28
*** Significant at 0.01 level; ** Significant at 0.05 level; *Significant at 0.1 level
he regressor of interest in this regression is Vit, exac-tly the residual of the reduced equation. As the coeicient for this variable is not statistically diferent from zero, the conclusion is that leverage and cash holdings are not endo-genous, according to the test speciication presented in the previous section.
he next table brings the results for the regression that has cash holdings as dependent variable:
Table 5 Determinants of cash holdings
Dep.Var:
Cash Holdings Coeficients t-value Robust SE.
stD/Cap -0.128*** -3.60 0.035
ltD/Cap -0.100** -2.02 0.049
SqrtMVE -0.001* -1.75 0.000
NetCapex/TA -0.030 -0.68 0.045
PPE/TA -0.130*** -4.30 0.030
SGA/NOR 0.011*** 22.9 0.000
NOR/TA -0.041*** -3.44 0.012
Beta 0.006 1.61 0.003
Div.Yield 0.000 0.01 0.000
Constr.Firms 0.013 1.07 0.012
Short and long-term Debt to Capital had both a ne-gative marginal effect on Cash Holdings (-0.12; p-value < 0.01 / -0.10; p-value < 0.05, respectively), being the ne-gative effect of short-term debt more pronounced. The proxy for Size (sqrtMVE) was negatively correlated to Cash Holdings (-0.001; p-value < 0.1), but with a coeffi-cient close to zero. Net Capex to Assets (NetCapex/TA), our proxy for Growth / Investment Opportunities was not statistically significant. Tangible Assets (PPE/TA) had negative effect on Cash Holdings (-0.13; p-value < 0.01), whereas Discretionary Expenses (SGA/NOR) marginally increase Cash Holdings (0.01; p-value < 0.01). Asset Turns (NOR/TA), the variable for operating efficiency, had negative relationship to Cash Holdings (-0.04; p-value < 0.01), while Beta, the proxy for firm risk, was not statistically different from zero, the same for the variables Dividend Yield and Constr (the dummy variable for potentially constrained firms).
The result that Cash Holdings is decreasing in debt is in line both with the previous result we found having Debt to Capital as dependent variable and Cash Holdin-gs as independent variable, and also with prior studies. (Opler et al., 1999; Ferreira & Vilela, 2004; Bigelli & San-chez-Vidal, 2012). Because we split the Debt to Capital ratio to encompass the debt maturity, we could assess if the maturity of debt magnifies or reduces the negative impact of debt into cash holdings. Results suggest that Short-Term Debt has a slightly more negative impact on Cash Holdings than Long-Term Debt (coefficients are -0.12 x -0.10, respectively). If we assume that short-term debt is more likely to be used to finance immediate cash shortages, like for working capital necessities, and that long term debt is more likely to be used to finance invest-ments, this result makes some sense, as cash holdings are liquid assets that firms can use in case of an immediate need to cover working capital shortage, as short-term debt, at least in Brazil, is quite expensive money. But as the difference in the coefficients is small, we leave this finding as possibility to be further developed.
According to the regression results, firms holding more tangible assets are likely to hold less cash, in line with John (1993). On the other hand, firms with more discretionary expenses, like advertising, research, selling expenses, etc, hold higher cash balances, which is in line with former studies (Opler et al., 1999).
Regar-F(10,215) 119.9***
N 1101
Firms 209
Adj. R-squared 0.091
DWatson 2.27
Var(u_i) 0.7448
Max. correl. 0.36
*** Significant at 0.01 level; ** Significant at 0.05 level; *Significant at 0.1 level
continuous
ding to Operating Efficiency / Performance, we found that Asset Turns and Cash Holdings are negatively cor-related. Instead, previous studies suggested that firms holding larger cash balances usually are more efficient (Mikkelson & Partch, 2003).
Cash Holdings is decreasing in Size, implying that smal-ler irms are likely to hold larger cash reserves, in synergy with former studies (Ferreira & Vilela, 2004; Opler et al., 1999; D’Mello et al., 2008).
The dummy variable we used to capture financially constrained firms showed positive coefficient, sug-gesting cash holdings would be increasing in financial constraints. Unfortunately, because the coefficient is not statistically significant, we cannot corroborate this important result of prior research (as in Acharya et al., 2007; Almeida & Campello, 2007).
However, it is possible that we captured some part of the idea of financially constrained firms with other variable in the model, which is size. It is reasonable to assume that smaller firms are likely to suffer more from financial constraints, as they do not have valuable assets to offer as a collateral to back the debt service, and may run out of cheap debt loans. This is especially pronoun-ced in Brazil, building on Terra (2003). Thus, as the mo-del supports that cash holdings is decreasing in size, and assuming that financially constrained firms are likely to be smaller, the model may have indirectly captured some of the positive relationship between financial constraint and cash holdings, as suggested by Acharya et al. (2007), D’Mello et al. (2008), among others.
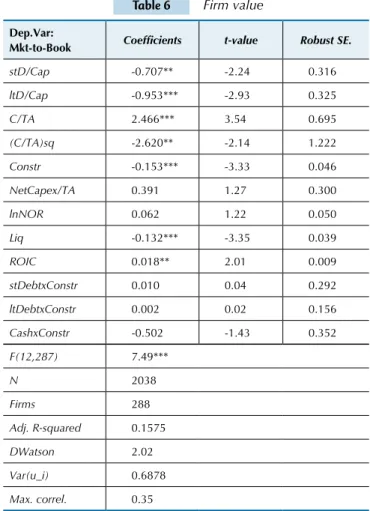
Table 6 Firm value
Dep.Var:
Mkt-to-Book Coeficients t-value Robust SE.
stD/Cap -0.707** -2.24 0.316
ltD/Cap -0.953*** -2.93 0.325
C/TA 2.466*** 3.54 0.695
(C/TA)sq -2.620** -2.14 1.222
Constr -0.153*** -3.33 0.046
NetCapex/TA 0.391 1.27 0.300
lnNOR 0.062 1.22 0.050
Liq -0.132*** -3.35 0.039
ROIC 0.018** 2.01 0.009
stDebtxConstr 0.010 0.04 0.292
ltDebtxConstr 0.002 0.02 0.156
CashxConstr -0.502 -1.43 0.352
F(12,287) 7.49***
N 2038
Firms 288
Adj. R-squared 0.1575
DWatson 2.02
Var(u_i) 0.6878
Max. correl. 0.35
*** Significant at 0.01 level; ** Significant at 0.05 level; *Significant at 0.1 level
Table 6 reports the results for the third model estima-ted. Recalling, the idea of this model was to evaluate how investors perceive financing and cash policies, by assessing the impact of these policies on the firm value.
The Market-to-Book ratio is decreasing in Short-Term Debt to Capital (-0.70; p-value < 0.05) and in Long-Term Debt to Capital (-0.95; p-value <0.01). For Cash Holdings, the relationship is positive for the linear form (2.46; p-value < 0.01), but decreasing for the qua-dratic form (-2.62; p-value < 0.05). Constrained Firms have their market value further discounted by inves-tors when compared to unconstrained firms (-0.15; p-value < 0.01). The controlling variables for profitability (ROIC) and for liquidity (Liq) were statistically signi-ficant in the regression. The controls for size (log of Net Operating Revenues), investment (NetCapex/TA), as well as the interactions between short and long-term debt and cash holdings with the dummy for constrai-ned firms were not statistically significant.
The result that both short and long-term debt causes marginal discounting in the market value of firms may reflect some kind of risk aversion of investors, trying to interpret that as an averaged behavior, as higher leve-rage tends to be associated with higher stock volatility (Lewellen, 2006). Indeed, as the Brazilian stock market is marked by high volatility (Perez & Famá, 2006), one possibility is that investors would prefer firms to finan-ce their investments with other securities than debt, like equity or internally generated funds, to mitigate the already present problem of volatility, making re-turns more stable. As firms, instead, must employ at least some level of debt in their financing structure, the negative marginal effect of debt into market value could be possibly interpreted as a risk-aversion reply from investors.
Firm value was found to be increasing in the linear form of Cash Holdings, but decreasing in the quadratic form, suggesting an inverted U-shaped curve relationship. Prior evidence suggested that cash holdings are value-enhancing if cash balances are optimal (Ferreira & Vilela, 2004; Opler et al., 1999). In other words, static trade-off theory predicts that there is a target-level of cash holdings that maximizes firm value. The results of the model give support to static trade-off theory, in the sense that it su-pports the existence of an optimum value of cash. Firm value would be increasing in cash up to a given threshold value, but, from that point, value would start to be dis-counted. Investors may value the precautionary feature of high cash balances, as argued by Bates et al. (2009), but not in a monotonic way, as excess cash balances may sig-nal high opportunity costs of funds, or also an inefficient payout policy, because holding cash may have non-zero cost, and some part of the excess cash could be distributed as dividends (Opler et al., 1999). One further reason for the discount on higher values of cash could be linked to the agency problem of leaving too much cash in the ma-nagers’ hand, as they could invest in low-profit projects and spend the excess cash in perquisites (Jensen, 1986).
In the Brazilian context, we understand that an optimum point of cash makes sense, because there is a marked restriction in credit markets, specially for small firms, but also a high opportunity cost of capital, as interest rates are historically higher when compared to more developed economies. Then too little cash can be viewed as a bad thing, but also too much cash may not be the best option, suggesting there should be a ba-lance point.
The dummy variable we set to differentiate potentially constrained firms versus unconstrained firms showed to be statistically significant and had negative coefficient. Interpretation is that constrained firms have lower ma-rket value, when compared to the baseline-unconstrai-ned firm. This result is consistent with the hypothesis of risk aversion that we proposed for the negative impact of debt in the market value, as firms paying a high fraction of their gross cash generated in debt servicing may be more prone to face financial distress, thus being riskier, and hence suffering further discounting. The interaction between this dummy and short and long-term debt, as well as the interaction with cash holdings, were not sta-tistically significant.
5 CONCLUSIONS, LIMITATIONS AND FURTHER RESEARCH
The objective of this study was to analyze how capital structure and cash holdings are related in the Brazilian firms setting, and further evaluate the impact of these important financial variables on the firm value. We found evidence that leverage and cash holdings are negatively related at the margin. Higher levels of cash balances are associated to less leverage, and more levered firms are likely to hold less cash. The finding was in line with former researches, and can also be interpreted in light of Pecking Order theory, as fir-ms would prefer to finance investments with retained ear-nings (encompassed by cash holdings), recurring to debt as a second option to finance investments when they run short of cash. Hence, it makes sense those higher levels of cash to be associated to lower debt ratios, and vice-versa.
We also found evidence that higher levels of leverage end up constraining firms to issue more debt, as the gross cash generated that is committed to repay debt, once it reaches a given threshold, causes debt to fall at the mar-gin. If we consider that small firms are more likely to be financially constrained, as former research and theory suggest, we found indirect evidence that more constrai-ned firms hold more cash.
Regarding to the impact of leverage (short and long-term) and cash holdings on firm value, the results of this study suggest that leverage causes firm value discounts, whereas cash balances are valued positively by investors, but up to a certain level. Further from that given level, the market value of firm is decreasing in cash holdings. Additionally, the firms we set as financially constrained were further discounted in their market values, when compared to the ones set as unconstrained.
We interpreted these results as signaling a somewhat
risk-averse behavior of investors with respect to levera-ge, because leverage could induce an even higher vola-tility to stock returns, and financially constrained firms are more subject to financial distress risks. Regarding to cash holdings, the results suggest that the accumulation of cash balances is positive, as it potentially shields the firm’s future investments against possible future cash constraints, but not in a monotonic fashion: too much cash causes market discounts, possibly due to escalated opportunity costs of money, inefficient payout policy or agency costs of leaving too much cash disposable to ma-nagers’ spending.
We point out that our study has some important li-mitations. First, we addressed the issue of financially constrained firms using a different approach when compared to prior studies, mainly due to data availabi-lity. The dummy variable we used may not have subs-tantially captured the capital constraint faced by firms, despite the fact that we understand that the dummy cap-tured some features of the problem, and some other fe-atures were indirectly captured by other variable (size). Second, also related to financial constraints, we failed to conciliate it with sensitivity to cash flows, invest-ment and tangibility, in light of prior studies (Acharya et al, 2007; Almeida & Campello, 2007). These more robust relationships should be addressed in future stu-dies. Another variable that we failed to conciliate in our study is the role of taxes in both cash holdings and leverage determinants. Further papers should include this variable in the analysis.