1
Dissertation presented as partial requirement for obtaining
the Master`s degree in Information Management, with
specialization in Marketing Intelligence
THE IMPACT OF REVIEW VALENCE, RATING AND TYPE
ON REVIEW HELPFULNESS
Morino Xavier de Barros Neto
2 NOVA Information Management School
Instituto Superior de Estatística e Gestão de Informação Universidade Nova de Lisboa
THE IMPACT OF REVIEW VALENCE, RATING AND TYPE ON REVIEW
HELPFULNESS
A TEXT CLUSTERING AND TEXT CATEGORIZATION STUDY
by
Morino Xavier de Barros Neto
Dissertation presented as partial requirement for obtaining the Master`s degree in Information Management, with specialization in Marketing Intelligence
Orientador: Diego Costa Pinto
4
ABSTRACT
Consumers trust on online reviews to help them making their purchasing decisions. Online reviews provide consumers with clues about the quality of the products that they want to buy. Consumers rely on clues, such as, review helpfulness votes and rating to infer product quality. In this study, we perform a Text Clustering and a Text Categorization analysis to uncover the review characteristics and to predict the review rating, helpfulness votes and the product price, based on review corpus. We use a dataset with 72 878 reviews of unlocked mobile phones sold on Amazon.com to perform this analysis. The main goal of this research is to understand the impact of review valence, rating and type on helpfulness votes on Amazon, for unlocked mobile phones. This research aims, also to understand the impact of price on customer satisfaction and the relationship between customer satisfaction and ratings.
Our results suggest that positive reviews that emphasize the feature level quality of the products receive more helpful votes than the positive reviews that contain mainly subjective expressions or negative reviews. Another important finding of this research is on the influence of the price of the product. The phones with high price tend to receive more positive reviews and more helpful votes. These findings have important managerial and theoretical implications. To best of our knowledge, our study is the first one to analyze the effect of the combination of valence, rating and subjectivity of the review text on helpful votes.
KEYWORDS
Online Reviews; Helpfulness; Rating; Valence; Review Type; Text Clustering; Text Categorization
6
INDEX
1. INTRODUCTION ... 9 2. THEORETICAL BACKGROUND ... 12 2.1. TEXT CLUSTERING ... 12 2.2. HELPFULNESS... 14 2.3. PRICE ... 16 2.4. RATING ... 17 3. METHOD ... 19 3.1. DATA PREPARATION ... 19 3.2. TEXT CATEGORIZATION ... 21 3.2.1. STUDY 1 SPECIFICATIONS ... 21 3.2.2. STUDY 2 SPECIFICATIONS ... 22 3.2.3. STUDY 3 SPECIFICATIONS ... 23 3.3. TEXT CLUSTERING ... 234. RESULTS AND FINDINGS ... 24
4.1. STUDY 1 RESULTS ... 24 4.2. STUDY 2 RESULTS ... 26 4.3. STUDY 3 RESULTS ... 32 4.4. STUDY 4 RESULTS ... 39 5. DISCUSSION ... 45 6. REFERENCES... 49
7
LIST OF FIGURES
Figure 1. Text Categorization Model created on SAS Enterprise Miner 14.2. ... 21
Figure 2. Price distribution by rating. ... 31
Figure 3. Review Votes by Rating. ... 38
Figure 4. Visualization for Cluster distribution. Note: Cluster 1: Sim Card and International Usage; Cluster 2: Bad Battery Experience and Bad Phone; Cluster 3: Unhappy Buyers; Cluster 4: Very Happy Customers; Cluster 5: Feature Level Reviews. ... 40
Figure 5. Pie Chart for the 5 Clusters. Note: Cluster 1: Sim Card and International Usage; Cluster 2: Bad Battery Experience and Bad Phone; Cluster 3: Unhappy Buyers; Cluster 4: Very Happy Customers; Cluster 5: Feature Level Reviews. ... 40
Figure 6. Number of Helpfulness votes by Cluster. ... 43
Figure 7. Price distribution by Clusters. ... 44
8
LIST OF TABLES
Table 1. The distribution of reviews and helpful votes for each Brand. ... 20
Table 2. Descriptive statistics for numeric review variables. ... 20
Table 3. Values for the Text Rule Builder node test... 22
Table 4. Cluster tests by number of clusters and SVD Resolution. ... 24
Table 5. Results of the Text Rule Builder node tests for the Helpful target variable. ... 24
Table 6. Results of the Text Rule Builder node for the study with Helpful as target variable. First 10 rules obtained. ... 25
Table 7. Results of the Text Rule Builder node tests for the Price as target variable. ... 26
Table 8. Results of the Text Rule Builder node for the study with Helpful as target variable. First 10 rules obtained for the LOW price. ... 27
Table 9. Results of the Text Rule Builder node for the study with Helpful as target variable. First 10 rules obtained for the HIGH price rules. ... 29
Table 10. Results of the Text Rule Builder node for the study with Helpful as target variable. More 10 rules obtained for the HIGH price rules. ... 30
Table 11. Results of the Text Rule Builder node tests with Rating as target variable. ... 32
Table 12. Results for the Text Rule Builder Node for the study with Rating as target variable. First 10 rules obtained for Rating = 1. ... 33
Table 13. Results for the Text Rule Builder Node for the study with Rating as target variable. First 10 rules obtained for Rating = 5. ... 34
Table 14. Results for the Text Rule Builder Node for the study with Rating as target variable. First 10 rules obtained for Rating = 3. ... 35
Table 15. Results for the Text Rule Builder Node for the study with Rating as target variable. First 10 rules obtained for Rating = 4. ... 36
Table 16. Results for the Text Rule Builder Node for the study with Rating as target variable. First 10 rules obtained for Rating = 2. ... 37
Table 17. Clusters obtained and Top 15 terms in each of 5 clusters. ... 41
9
1. INTRODUCTION
The increasing usage of the internet by consumers along their purchasing journey allowed the proliferation of consumer online product reviews. According to a recent survey (Podium, 2017) 93% of consumers say online reviews have an impact on their purchasing decision. Another recent survey (BrighLocal, 2017) shows that 85% of people trust online reviews as much a personal recommendation.
Online reviews are conditioned by acquisition bias - only costumers with a positive disposition toward a product will acquire the product - and underreporting bias - consumers who are very satisfied or very dissatisfied are more likely to write a review (Hu, Pavlou, & Zhang, 2017). Consumers post online reviews duo their desire to share opinion with others, to show their enjoyment (Sian, Hu, & Clemons, 2010) and for self-enhancement (Hennig-thurau, Gwinner, Walsh, & Gremler, 2004). On the other hand, consumers read online reviews because they consider it credible (Jiménez & Mendoza, 2013) and it generates more product interest than corporate websites (Bickart & Schindler, 2001).
Online review valence has been subject of several studies in the past years. The main research focus have been on its impact on sales (Chevalier & Mayzlin, 2006; Floyd, Freling, Alhoqail, Cho, & Freling, 2014; Forman, Ghose, & Wiesenfeld, 2008; Ho-dac, Carson, & Moore, 2013; Maslowska, Malthouse, & Bernritter, 2017; Schlosser, 2011), purchase intention (Jing Yang, Sarathy, & Lee, 2016), hotel booking intention (Cheng Chu Chan, Lam, Chow, Fong, & Law, 2017), attitude changes (S. H. Lee & Ro, 2016), product attitude (Pang & Qiu, 2016), perceived helpfulness (Pan & Zhang, 2011), purchasing decision (Purnawirawan, Eisend, Pelsmacker, & Dens, 2015), consumer choice (Kostyra, Reiner, Natter, & Klapper, 2016) and perceived quality (Kwark, Chen, & Raghunathan, 2014).
10
The effect of review rating on sales (Clemons, Gao, & Hitt, 2006; Hu, Koh, & Reddy, 2014; Maslowska et al., 2017; Zhu & Zhang, 2010), software downloads (Zhou & Duan, 2016), perceived helpfulness (Mudambi & Schuff, 2010; Schlosser, 2011), persuasiveness (Schlosser, 2011) and movie sales (Duan, Gu, & Whinston, 2008) has also been largely studied in the past years.
Researches have been focusing on the impact of some variables on review helpfulness, such as, review type (Qazi et al., 2016), review depth (S. Lee & Choeh, 2014), length (Chua & Banerjee, 2016; Pan & Zhang, 2011), sentiment (Salehan & Kim, 2016), readability (Chua & Banerjee, 2016; Ghose & Ipeirotis, 2011; Liu & Park, 2015; Singh et al., 2017), time (Cao, Duan, & Gan, 2011; Salehan & Kim, 2016), valence (Cao et al., 2011; Chua & Banerjee, 2016; Liu & Park, 2015; Pan & Zhang, 2011; Purnawirawan et al., 2015; Jun Yang & Mai, 2010) and subjectivity (Ghose & Ipeirotis, 2011; Singh et al., 2017).
Current research on online reviews can be divided on two main groups: one group focusing on the direct impact of review characteristics, such as, valence, volume and ratings on purchasing intention or actual sales (Duan et al., 2008; Maslowska et al., 2017; Zhu & Zhang, 2010); and a second group focusing on the effect of other reviews characteristics, such as, the level of detail, length and argument quality on purchase intention and helpfulness (Jiménez & Mendoza, 2013; Salehan & Kim, 2016; Zhang, Zhao, Cheung, & Lee, 2014).
However, to the best of our knowledge, there is a gap on studies about the influence of the review characteristics valence and rating, moderated by review type, on helpfulness.
Past studies show conflicting results regarding to the helpfulness of positive and negative reviews, the effect of subjectivity in online reviews, the influence of price in user satisfaction and on the impact of reviews with extreme ratings on helpfulness votes.
11
Categorization and Text Clustering analysis that will allow us to obtain robust answer to those questions. This research adds value to the scientific knowledge. First, we include the impact of review type on the helpful votes on Amazon, besides of the valence and ratings.
Second, we examine the impact of price of unlocked mobile phones bought on Amazon.com website in user satisfaction. Our results suggest that products with high price are associated with higher user satisfaction and products with low price are associated with lowest user satisfaction. Third, our cluster analysis suggests that the cluster that include reviews from the most satisfied buyers have the highest average rating, but those reviews are not considered helpful.
Regarding to the managerial implications, our results suggest that companies can invest more money on research and development, so they can produce mobile phones with high quality and they should encourage the most satisfied customers to post their reviews of their favorite product features, such as, camera, screen and memory. Those positive reviews, that contains an objective analysis of the product features will be helpful for readers and it can generate more product interest.
The remainder of this paper is organized as follow. We first review the literature, for the theoretical background and develop our hypothesis. In section 3 we describe our data and we create both Text Categorization and Text Clustering models. In section 4 we present the results and in section 5 we conclude this paper with the discussion of the results and we present the main contributions and limitations of this paper.
12
2. THEORETICAL BACKGROUND
2.1. TEXT CLUSTERING
Text clustering is a useful technique that aims at organizing large document collections into smaller meaningful and manageable groups, which plays an important role in information retrieval, browsing and comprehension (Wei, Lu, Chang, Zhou, & Bao, 2015). Many researchers have tried to find the most appropriated algorithm for text clustering in the past and some recent papers propose interesting methods.
Jia et. al. (2018) propose WordCom, a novel concept composition method, which is based on the identification of semantic word communities using a k-means type community detection method. The authors found that WordCom is more accurate than state-of-the-art algorithms and that the top 10 words based on centrality in each detected word community have revealed the community topic in most cases (Jia, Carson, Wang, & Yu, 2018). WordCom is robust to sparse short texts, but this method has difficulty dealing with long texts.
Abualigah et. al. (2017) discovered that using dynamic reduction method and Length Feature Weight in any feature selection method will improve the performance of produced features and text document clustering technique, such as k-mean, will be more accurate and result in better F-measurements (Abualigah, Khader, Al-Betar, & Alomari, 2017).
Li et. al. (2017) conducted a text clustering study by using the Latent Dirichlet Allocation model. The authors found that the combination of space vector model based on td-idf weighted value and textual clustering algorithms based on LDA model has a higher computation accuracy. The LDA Model extract the latent topics of texts, traversing three layers from documents to topics to characteristic words. The Dunn validation index and
13
silhouette coefficient indicates the textual clustering based on LDA model is superior to the conventional methods (C. Li, Yang, & Jiang, 2017).
Wei et. al. (2015) research were able to solve several problems in text clustering, such as, the disambiguation of the polysemous and synonymous words, the high dimensionality, the determination of the number of clusters, and the assignation of the appropriate description for the generated cluster (Wei et al., 2015).
Alghamdi et. al. (2014) proposed the BV-k-means approach and compared it with the standard k-means. They have been able to increase purity by 85% compared to the standard k-means algorithm and they were able to bring down the runtime using the proposed approach by 95% comparing to the standard k-means algorithm (Alghamdi, Selamat, & Karim, 2014). Li et. al (2008) proposed the text clustering algorithm CFWS (Clustering based on Frequent Word Sequences). The results showed that frequent word sequences discovered from the document set can represent the topics covered by the documents very well and the documents containing the same frequent word sequences are clustered together. The authors suggest that the CFWS algorithm is scalable (Y. Li, Chung, & Holt, 2008).
Abualigah and Khader (2017) proposed a feature selection method using H-FSPSOTC algorithm and the results proved that it improved the performance of the text clustering in almost all given datasets according to the evaluation measurements. The authors suggest that Using hybrid PSO for the proposed feature selection method will increase the performance of produced text features and text clustering technique, such as the k-mean algorithm, will be more accurate and result in better accuracy and F-measure (Abualigah & Khader, 2017).
14 2.2. HELPFULNESS
Major websites, like Amazon, ask readers to rate the helpfulness of the reviews of products and make that information available (Qazi et al., 2016). Such reviews are useful for better and well-informed decisions, and, hence, maximize users' satisfaction (Kohli, Devaraj, & Mahmood, 2004).
Review type significantly influences the effect of review length over helpfulness (Qazi et al., 2016). Review depth in terms of word count have a positive impact on review helpfulness (S. Lee & Choeh, 2014). Pan & Zhang (2011) results suggests that review length positively affects the helpfulness of utilitarian products reviews, but not experiential products and the level of specificity in reviews does not contribute to review helpfulness for experience products (Chua & Banerjee, 2016). Lengthy unfavorable reviews for experience products are likely to be voted as helpful (Chua & Banerjee, 2016). Showing conflicting results, Qazi et. al. (2016) suggests that longer reviews are less helpful than concise ones.
Sentiment negatively influences review readership (Salehan & Kim, 2016). Higher readability is associated with higher review votes (Chua & Banerjee, 2016; Ghose & Ipeirotis, 2011; Liu & Park, 2015; Singh et al., 2017). Sentiment negatively influences review helpfulness, because consumers may perceive emotional content to be less rational and thus less helpful (Salehan & Kim, 2016).
Time has a positive effect on reviews on Amazon, older reviews receive more helpful votes (Salehan & Kim, 2016). Contradicting results are shown by Cao et. al. (2011), the longer the review has been posted, the fewer votes it´s likely to receive. Readers may consider up-to-date reviews more helpful than older ones.
Positive reviews have higher probability of being rated as helpful than negative ones (Pan & Zhang, 2011). Positive reviews are perceived as more helpful than negative or moderated ones
15
(Liu & Park, 2015). Purnawirawan et. al. (2015) results confirm that consumers give more weight to positive than negative reviews. Chua & Banerjee (2016) also found that favorable reviews attract more helpfulness votes. Showing conflicting results, Cao et. al. (2011) revealed that the number of words in cons parts of the review on TripAdvisor have positive influence on review helpfulness votes. The more words it has, more votes the review receives. It means that consumers may pay more attention to the negative part. Readers tend to pay more attention to negative reviews in online videogame industry (Jun Yang & Mai, 2010).
Although there are conflicting results regarding to the helpfulness of positive and negative reviews, previous studies suggesting that positive reviews are more helpful to the readers show stronger arguments and results shown on Chua & Banerjee (2016) are very related to this research. Therefore, we propose the following hypothesis:
Hypothesis 1: Positive reviews are considered more helpful by readers than negative ones.
The estimates for some SVD variables are positive while others are negative, this indicates that some words have positive impact encouraging review votes, while others have negative impact (Cao et al., 2011).
The extent of subjectivity in a review has a statistically significant effect on the extent to which users perceive the review to be helpful. Highly subjective reviews are rated as less helpful (Ghose & Ipeirotis, 2011). Consumers may consider it more related to personal experience and thus, less helpful. For featured-based products users prefer reviews that contains mainly objective information with only few subjective sentences (Ghose & Ipeirotis, 2011). Reviews that describes key products aspects of search products are likely to be voted as helpful (Chua
16
& Banerjee, 2016). Showing conflicting results, Singh et. al. (2017) shows that reviews with more subjective statements and opinions receives more votes.
Previous studies suggest users prefer objective reviews for feature-based products, like the mobile phones reviews used on this paper (Ghose & Ipeirotis, 2011). Thus, we hypothesize the following:
Hypothesis 2: Objective reviews tend receive more helpful votes than subjective ones.
2.3. PRICE
Price has an impact on perceived value and quality (Ye, Li, Wang, & Law, 2014) and both quality and price have impact on purchase decision (X. Li & Hitt, 2010). Popularity can have a positive effect on the perceived value of the product and can increase the average value customer would be willing to pay for the product (Elberse, 2008). Online reviews reduce the influences of price on costumer’s choices and it reduces price sensitivity and risk perception (Kostyra et al., 2016).
Therefore, we propose the following:
Hypothesis 3: Products with high price are associated with higher user satisfaction.
For products with a low proportion of negative reviews, consumers with a purchase goal have a significantly higher price satisfaction and purchase intention than those without a
goal (Weisstein, Song, Andersen, & Zhu, 2017).
When consumers’ perceptions can be influenced by price, firms have an additional strategic consideration in deciding how to position their products for sale. For products that are of intermediate quality, firms may benefit by reducing their prices to boost their ratings in
17
systems that cannot distinguish price from quality, although the existence of these price effects does not always benefit firms in that they may be worse off in a scenario in which this type of review bias is present (X. Li & Hitt, 2010).
Firms can strategically respond to self-selection biases by adjusting their prices. When consumers have low prior product quality expectations, the firm can lower the first-period price to attract more consumers to purchase and subsequently write more positive reviews, which will raise their second-period product quality expectation. Then the firm can charge a higher price in the second period to extract more profits (Hu et al., 2017). But, companies should be careful on this, because sales decreases as price of products on Amazon increases (Ghose & Ipeirotis, 2011).
To convert the most browsers into buyers, the retailer should set the prices low for products with their highest ratings and review number. Retailers serving both switcher and loyal customer should price trending products lower when the switcher customers are affected by the trending status of a product. Retailers serving both switcher and loyal customer should price products with higher ratings and reviews low because of the higher conversion rate of such positive reviews (Kocas & Akkan, 2016).
2.4. RATING
Hu, N. et al. (2014) results suggest that the impact of average ratings on sales is not significant, because ratings have more importance in the begin of the consumer journey and sentiment have more impact on the evaluation and purchase stage. Duan et al. (2008) results also suggests that higher ratings do not leads to sales. Consumers do not trust on the mean average rating on reviews duo the self-selection bias and firm´s profits may suffer from that (Hu et al., 2017). On the other hand, Zhu, F. and Zhang, X. (2010) results shows that the effect of rating
18
on sales of less popular and online games is positive and significant and the highest ratings are a good predictor of future sales (Clemons et al., 2006).
In a recent study, Maslowska, E. et al. (2017) results suggests that products with the average star rating of 4.5 through 5 are less likely to be purchased than those between 4 and 4.5 stars and a product with an average of 3.8 - 4.2 stars rating is more likely to be purchased than one with 5 stars. An increase in professional rating has a positive direct impact on software downloads and users are more willing to write reviews on products with higher professional ratings, and this leads indirectly to more downloads (Zhou & Duan, 2016).
Reviews with extreme opinions receive more helpful votes than reviews with mixed or neutral opinions (S. Lee & Choeh, 2014). Cao et. al. (2011) also suggests that reviews with extreme opinions have higher probability to receive helpful votes. Moderate reviews are voted has less helpful than clearly positive or negative reviews (Forman et al., 2008).
Showing conflicting results, Schlosser (2011) suggest that consumers consider two-side reviews (reviews with pros and cons arguments) as being more helpful than one-side review. Mudambi & Schuff (2010) suggest that reviews with extreme rating are associated with lower levels of helpfulness than reviews with moderate star ratings. Reviews with pros and cons arguments are more helpful and persuasive when rating is moderated. That means that reviews with extreme ratings, but with both positive and negative aspects is perceived as being less helpful and persuasive (Schlosser, 2011).
There are conflicting results on the helpfulness of extreme and moderated reviews. But studies suggesting that extreme reviews are more helpful than moderated ones show more consistent results. Therefore, we hypothesize the following:
19 Hypothesis 5: The cluster that include reviews of the most satisfied users are the one with the
highest average rating.
3. METHOD
In this four-stage study, this research analyzes the impact of review valence, rating and type on helpfulness votes of online reviews regarding to unlocked mobile phones on Amazon. We developed three Text Categorization studies to access the characteristics of the online reviews regarding to each one of the target variables used for each study. Namely, price, rating and helpfulness. With the results of this studies we aim to predict the helpfulness votes, ratings and the product price, based on the review characteristics for each of those variables. A Text Clustering study was also developed. The objective of this study is to group similar reviews into clusters, in order to access the characteristics of each cluster created.
The tests made on our hypothesis in these studies allows us to obtain highly accurate results.
3.1. DATA PREPARATION
We use a dataset with 72 878 reviews of unlocked mobile phones sold on Amazon.com downloaded from the website www.kaggle.com. The original dataset consisted on more than 400 thousand reviews. We cleaned duplicated data (292,482) and reviews with missing information (121,336). In the data set we can access information about the product name, price, rating, reviews and review votes.
20
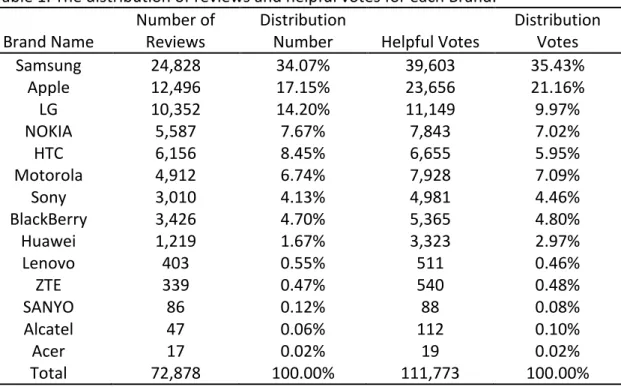
Table 1. The distribution of reviews and helpful votes for each Brand. Brand Name
Number of Reviews
Distribution
Number Helpful Votes
Distribution Votes Samsung 24,828 34.07% 39,603 35.43% Apple 12,496 17.15% 23,656 21.16% LG 10,352 14.20% 11,149 9.97% NOKIA 5,587 7.67% 7,843 7.02% HTC 6,156 8.45% 6,655 5.95% Motorola 4,912 6.74% 7,928 7.09% Sony 3,010 4.13% 4,981 4.46% BlackBerry 3,426 4.70% 5,365 4.80% Huawei 1,219 1.67% 3,323 2.97% Lenovo 403 0.55% 511 0.46% ZTE 339 0.47% 540 0.48% SANYO 86 0.12% 88 0.08% Alcatel 47 0.06% 112 0.10% Acer 17 0.02% 19 0.02% Total 72,878 100.00% 111,773 100.00%
Samsung, Apple and LG are the most popular brands from the dataset. Those brands received the highest number of reviews and received also the highest number of helpful votes. On the other hand, Sanyo, Alcatel and Acer are the less brands of the review set. Those brands received the lowest number of reviews.
The dataset includes, also, reviews of unlocked mobile phones from Nokia, HTC, Motorola, Sony, BlackBerry, Huawei, Lenovo, ZTE and Sanyo.
Table 2. Descriptive statistics for numeric review variables.
Variable Mean
Standard
Deviation Minimum Median Maximum
Rating 3.65 1.61 1 4 5
Helpfulness 1.57 8.67 0 0 524
Price 226,83 242.01 2.99 163.87 2,408.73
The descriptive statistics are described in Table 2. The overall rating of the reviews is positive, with an average rating of 3.65. The maximum of votes that a review received was 524 and the average number of votes was 1.57. The cheapest mobile phone from the dataset costs $2.99 and the most expensive one costs $2,408.73. The average price of the products on the review set is $226.83.
21 3.2. TEXT CATEGORIZATION
The objective of the Text Categorization study is to create a model that will allow us to categorize future reviews based on the knowledge obtained with our training data.
3.2.1. STUDY 1 SPECIFICATIONS
We did a text categorization analysis on SAS Enterprise Miner software to understand the characteristics that differentiate the reviews that received helpful votes from the ones that didn´t receive.
Figure 1. Text Categorization Model created on SAS Enterprise Miner 14.2.
We introduced a new column to the dataset with the values 0 – for reviews that didn´t receive any helpful votes – and 1 – for reviews that received the votes and we named this column “Review Votes – Target”. The File Import node was used and the variable “Review Votes – Target” was chosen as the target variable.
The Data Partition node was used to break the data into train – 50% –, validation – 30% – and test – 20% – data. The partitioning method chosen was Stratified. This is the most appropriated one for situations where a target variable is selected. The Text Parsing node was used to break the documents in terms and attributes a role to each term, such as: “abbr.”, “adj”, “Adv”, “noun”, “verb” and “prop”. The Text Filter node was used to reduce the number of terms used in the analysis. Part of speech and terms like “be”, “not” and “have” were
22
excluded because they are not useful for further analysis. The Text Rule Builder was used for generating an ordered set of rules that together are useful in describing and predicting the Helpfulness Votes.
We did a test using five different configurations to the train data, according to the generalization, purity of rules and exhaustiveness. According to SAS Help Guide, the Generalization Error determines the predicted probability for rules that use an untrained data set to prevent overtraining. Higher values do a better job of preventing overtraining at a cost of not finding potentially useful rules. The Purity of Rules determines how selective each rule is by controlling the maximum p-value necessary to add a term to a rule. Selecting Very High results in the fewest, purest rules. Selecting Very Low results in the most rules that handle the most terms. The Exhaustiveness determines how many potential rules are considered at each step. A higher Exhaustiveness increases the probability of overtraining the model.
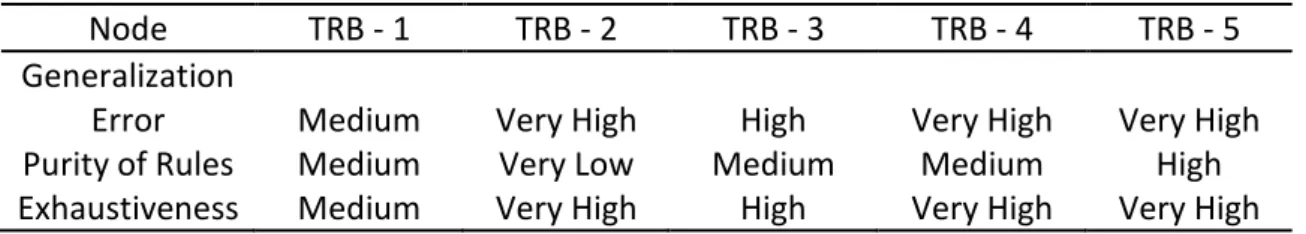
In the Table 3 it´s possible to see the different configuration tested: Table 3. Values for the Text Rule Builder node test.
Node TRB - 1 TRB - 2 TRB - 3 TRB - 4 TRB - 5
Generalization
Error Medium Very High High Very High Very High
Purity of Rules Medium Very Low Medium Medium High
Exhaustiveness Medium Very High High Very High Very High
3.2.2. STUDY 2 SPECIFICATIONS
We did the same analysis in Study 2, but this time with the Price as the target variable. The objective of this study is to understand the difference between the reviews of the mobile phone models with the highest price and the ones with the lowest price and to predict new reviews for that products. We calculated the Median of the price and introduced a new column to the dataset to split the products in two separated groups. We called the ones with
23
the price highest than the median as “High” and the ones with the price lowest than the median as “Low”.
3.2.3. STUDY 3 SPECIFICATIONS
A third study was made using the same model, but with the Ratings as target variable this time. The objective of this study is to identify the characteristics of the reviews according to the rating it received and to predict the rating for new reviews based on the corpus of the review.
3.3. TEXT CLUSTERING
The objective of this text cluster analysis is to group the review documents into clusters by similarity, discover the interpretable clusters and identify how this clusters relates to the target variables used in the previous analysis.
We use SAS Enterprise Miner software to do the clusters analysis. We first used the Text Import node to insert the review documents. Then the Text Parsing node was used to identify terms and their instances in a data set. The Text Filter node was used to reduce the number of terms used to remove irrelevant terms of the analysis and to group similar meaning. Terms like “great”, “greatest” and “greater” were combined into “great”.
The Text Cluster node was used to group the documents into clusters by similarity. The clustering method that we are using is the Expectation-Maximization clustering. Jung et al 2014 found it´s has a higher accuracy of results and a higher speed of computation when compared to k-means (Jung, Kang, & Heo, 2014).
Several tests were performed in order to find the most appropriate SVD Dimension and number of clusters to better describe the review data set.
24
In table 4 it´s possible to see the different number of clusters and SVD Resolution tested:
Table 4. Cluster tests by number of clusters and SVD Resolution. Number of
Clusters SVD – 1 SVD – 2 SVD – 3 SVD – 4
3 5 10 15 20
4 5 10 15 20
5 5 10 15 20
We are testing the results for three different numbers of clusters, 1, 2 and 3. The SVD dimensions being tested are: 5, 10, 15 and 20.
4. RESULTS AND FINDINGS
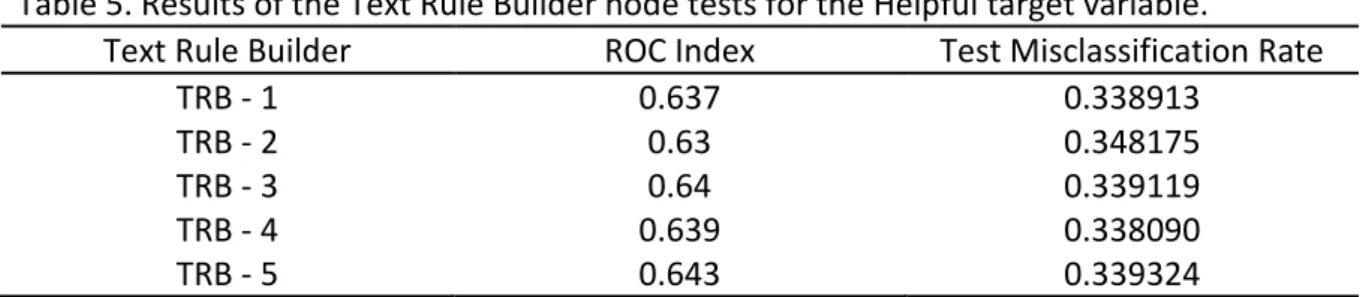
4.1. STUDY 1 RESULTSIn the Table 5 we present the results obtained in the Model Comparison Node: Table 5. Results of the Text Rule Builder node tests for the Helpful target variable.
Text Rule Builder ROC Index Test Misclassification Rate
TRB - 1 0.637 0.338913
TRB - 2 0.63 0.348175
TRB - 3 0.64 0.339119
TRB - 4 0.639 0.338090
TRB - 5 0.643 0.339324
The ROC Index is the selection criteria chosen in this research. The ROC Index value reflects the quality of the model in discriminating between the different values of the target variable. In this case, the helpful votes.
The TRB – 5 has the highest ROC Index, in this way, we choose this node to obtain and analyze the results.
25
Table 6. Results of the Text Rule Builder node for the study with Helpful as target variable. First 10 rules obtained.
Target
Value Rule # Rule Precision Recall
F1 Score True Positive/Total Valid Positive/Total 0 1 excellent product 81,53% 0,75% 1,49% 181/228 115/145 1 2 card & run 79,34% 0,77% 1,53% 96/121 44/65 1 3 phone & screen & watch 81,25% 1,36% 2,68% 83/98 40/59 1 4 day & different 80,50% 2,09% 4,08% 105/132 54/78 1 5 sticker 80,19% 2,67% 5,17% 78/97 35/58 1 6 huawei 79,31% 3,33% 6,40% 95/121 45/61 1 7 want & talk 79,66% 3,75% 7,17% 62/74 27/44 1 8 review & seller 78,36% 4,55% 8,60% 118/158 55/93 1 9 apps & android 76,78% 5,46% 10,19% 169/230 108/153 1 10 day & sd 77,09% 5,80% 10,78% 89/104 36/46
Precision, Recall and F1-Score are used to evaluate the accuracy of text categorization results. Precision is the proportion of the correctly classified documents to the classified documents. Recall is the proportion of the correctly classified documents to the test data that have to be classified and he F-measure is a harmonic combination of the precision and recall values used in information retrieval.
The Rule number one stands that documents that contain the expression “excellent product” won´t receive any helpful vote. This rule can be confirmed by looking into the dataset. There are 497 reviews that include this expression. Only 108 (22%) of those reviews received Helpful votes. The second rule with the highest precision is the rule number 3 that stands that reviews that contains the expressions “phone”, “screen” and “watch” will receive helpful votes, with a precision of 81.25%.
26
Results show that reviews that include the subjective expression “excellent phone” won´t receive helpful votes. Hypothesis 2 “Objective reviews tend receive more helpful votes than subjective ones.” is supported. Our results are supported by previous results found on Ghose & Ipeirotis (2011) which suggested that highly subjective reviews are rated as less helpful. On the other hand, reviews that include more objective sentences, using expressions like “phone”, “screen”, and “watch” tend to receive helpful votes. This results are supported by previous studies suggesting that reviews that describes key products aspects of search products are likely to be voted as helpful (Chua & Banerjee, 2016).
4.2. STUDY 2 RESULTS
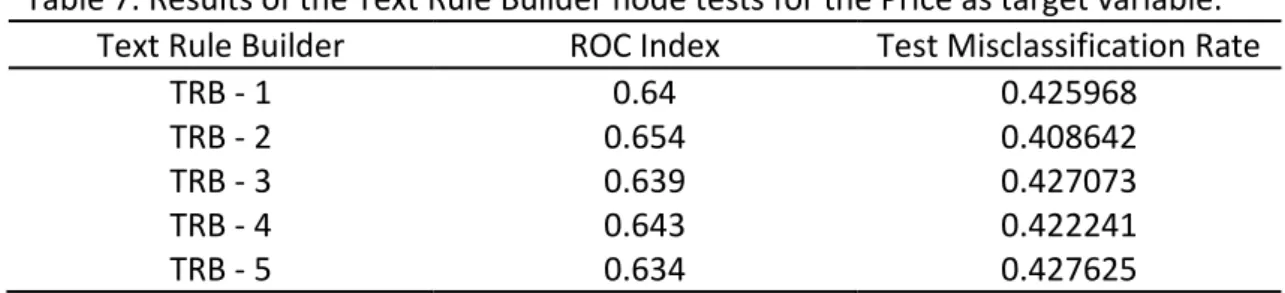
In the Table 7 we present the results obtained in the Model Comparison Node: Table 7. Results of the Text Rule Builder node tests for the Price as target variable.
Text Rule Builder ROC Index Test Misclassification Rate
TRB - 1 0.64 0.425968
TRB - 2 0.654 0.408642
TRB - 3 0.639 0.427073
TRB - 4 0.643 0.422241
TRB - 5 0.634 0.427625
The ROC Index value reflects the quality of the model in discriminating between the different values of the target variable. In this case, the price.
The TRB – 2 has the highest ROC Index, in this way, we choose this node to obtain and analyze the results.
27
Table 8. Results of the Text Rule Builder node for the study with Helpful as target variable. First 10 rules obtained for the LOW price.
Target Value
Rule
# Rule Precision Recall
F1 Score True Positive/Total Valid True Positive/Total LOW 1 lumia 88.62% 0.78% 1.54% 152/179 90/109 LOW 2 phone & ~fingerprint & ~samsung & ~huawei &
text & ~camera 86.27% 1.98% 3.87% 232/275 140/172 LOW 3 windows 86.86% 2.67% 5.18% 179/215 99/131 LOW 4 phone & ~fingerprint & ~samsung & ~huawei & ~nexus & ~sony & ~awesome & ~well phone & basic 84.35% 4.04% 7.72% 297/376 177/231 LOW 5 3gs 84.81% 4.22% 8.04% 34/35 20/22 LOW 6 phone & ~fingerprint
& ~sony & ~samsung & ~huawei & lock 85.10% 4.43% 8.43% 52/57 22/31 LOW 7 lumia 85.49% 4.57% 8.68% 33/35 23/26 LOW 8 evo 85.81% 4.76% 9.02% 36/39 26/29 LOW 9
text & ~lte & ~galaxy & ~camera & ~samsung & ~love 84.65% 6.74% 12.49% 465/574 258/338 LOW 10 window & ~samsung 84.26% 7.53% 13.82% 231/290 162/214
The first rule is “lumia”, a mobile phone model from Nokia. In the training data, 179 documents contained the term “lumia” and 152 of them were flagged as associated to a review of a product with a “LOW” price. This produces a precision value for this rule of 152/179 = 84.92%. On the other hand, the training data has 19,487 training observations with
28
Target Value = LOW, so recall for this rule is 152/19 487 = 0.78%. When the term “lumia” is present in a document, it is almost certainly a review for a low-price product, but there are many reviews of low-price products that do not use the term. We use the F1 statistic as the harmonic mean of precision and recall. In SAS code the F1 Score is calculated as follow:
F1=1/(0.5*(1/Precision)+0.5*(1/Recall)).
The F1 value measures the trade-off between precision and recall and gets larger as precision and recall get closer to each other in value. Because recall is so small, the F1 value for the first rule is small: F1 = 1.54%.
The statistics presented above are cumulative. The rule number 2 is phone & ~fingerprint & ~samsung & ~huawei & text & ~camera which is interpreted to apply when a document contains the word “phone” and “text” and does not contain the word “fingerprint”, “Samsung”, “Huawei” and “camera”. It means that after removing the 179 training documents that contain the term lumia, there are 275 documents that satisfy the rule and 232 have the Target Value = LOW. To calculate the overall precision of the two first rules we use the following formula:
Precision = (True Positive Rule 1 + True Positive Rule 2) / (Total Rule 1 Match + Total Rule 2 Match)
The overall precision for the first two rule is (152 + 232) / (179 + 275) = 84.58% In the table 9 we present the data for the Target Value equals to HIGH:
29
Table 9. Results of the Text Rule Builder node for the study with Helpful as target variable. First 10 rules obtained for the HIGH price rules.
Target Value
Rule
# Rule Precision Recall
F1 Score True Positive/Total Valid True Positive/Total HIGH 263 fingerprint 93.95% 1.18% 2.33% 203/218 115/121 HIGH 264 s6 93.90% 1.88% 3.69% 134/142 88/92 HIGH 265 huawei 94.41% 2.46% 4.80% 106/110 68/70 HIGH 266 s7 95.11% 2.83% 5.50% 87/89 61/61 HIGH 267 watch 94.02% 3.57% 6.89% 136/154 87/100 HIGH 268 s5 92.55% 4.42% 8.43% 181/207 76/84 HIGH 269 s6 92.78% 4.72% 8.98% 63/65 36/39 HIGH 270 nexus 90.90% 5.65% 10.64% 209/252 145/180 HIGH 271 6s 90.97% 5.93% 11.13% 61/65 26/30 HIGH 272 g3 90.35% 6.39% 11.93% 91/110 47/60
The first rule for the target HIGH is the rule number 263 “fingerprint”, a mobile phone feature. In the training data, 218 documents contained the term “fingerprint” and 203 of them were flagged as associated to a review of a product with a “HIGH” price. The precision value for this rule of 93.95%. The recall for this rule is 1.18%. When the term “fingerprint” is present in a document, it is almost certainly a review for a high-price product, but there are many reviews of high-price products that doesn’t contain that term. The F1 Score for the rule is 2.33%. The rule number 264 is s6 and the precision of this rule is 93.90%.
In an overall analysis, it´s possible to say that reviews that include terms like “lumia”, “phone”, “text” and “windows” and that doesn’t contain terms like “Samsung”, “Huawei”, “Sony” “camera”, “fingerprint”, “love” and “awesome” are associated to products with the lowest price. It makes sense in a way that Samsung, Huawei and Sony are brands associated to premium products, that costs higher than the average. Fingerprint technology is a feature present only in more advanced models. Reviews that contain the terms “fingerprint”, “Huawei”, “S7”, “S6”and “S5” are associated to products with higher price. It´s important to notice that S5, S6 and S7 are most expensive models from Samsung.
30
Table 10. Results of the Text Rule Builder node for the study with Helpful as target variable. More 10 rules obtained for the HIGH price rules.
Target Value Rule # Rule Precisio n Reca ll F1 Score True Positive/Tota l Valid True Positive/T otal HIGH 288
love & ~text & ~cortana & ~htc
& ~window &
beautiful 86.80% 10.8 1% 19.23% 78/108 34/58 HIGH 289 camera & ~windows & ~htc & ~verizon
& ~flash & ~window & ~e71 & great
camera 86.43% 11.1 3% 19.73% 72/92 31/50 HIGH 290 scanner 86.48% 11.2 6% 19.92% 102/108 61/62 HIGH 291 samsung & ~nokia & ~contract & ~sturdy & ~text
& ~htc & note 86.28% 11.5
1% 20.32% 86/107 47/56
HIGH 292 amazing phone 85.65%
11.9
4% 20.96% 95/133 48/73
HIGH 293 hot & ~phone 85.53%
12.1
7% 21.30% 45/55 17/30
HIGH 294
awesome & ~interface & ~contact & ~old
& ~window & ~buy & ~time &
~seller & camera 85.27% 12.5 2% 21.84% 82/103 41/62 HIGH 295 international version 84.91% 12.8 5% 22.33% 114/151 100/120 HIGH 296 watch 84.99% 12.9 4% 22.45% 25/25 14/14 HIGH 297 heat 84.88% 13.0 9% 22.69% 53/68 31/44
31
Results show that after the rule number 288, the obtained rules for the classification of products with high price include terms such as, “love”, “beautiful”, “great”, “amazing” and “awesome”.
Reviews for products with low price tend not to have emotional terms, like “love” and “awesome”. It indicates that the buyers of those products may not be satisfied with their purchase. On the other hand, the rules obtained for the products with high price include terms like, “love”, “beautiful”, “great”, “amazing” and “awesome”. Those terms indicate that the buyers of products with high price tend to be satisfied with their purchase and share this satisfaction on their product reviews. Hypothesis 3 “Products with high price are associated with higher user satisfaction.” is, thus, supported.
To confirm this result, we present the figure 2 with the price distribution by rating.
Figure 2. Price distribution by rating.
Results show that there are more products with high price receiving reviews with the highest ratings and more products with low price receiving reviews with the lowest ratings. Our results
32
contradicts previous studies that suggested that companies have the tendency to set lower prices for products with the highest ratings (Hu et al., 2017; Kocas & Akkan, 2016; X. Li & Hitt, 2010).
4.3. STUDY 3 RESULTS
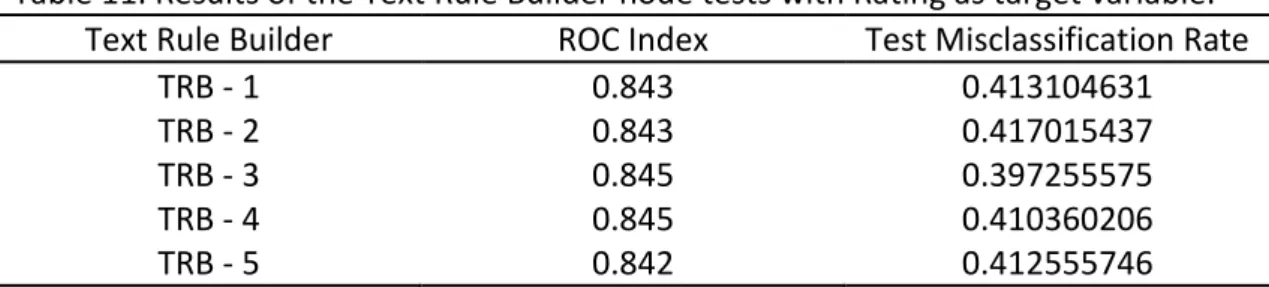
In Table 11 we present the results obtained on the Model Comparison Node: Table 11. Results of the Text Rule Builder node tests with Rating as target variable.
Text Rule Builder ROC Index Test Misclassification Rate
TRB - 1 0.843 0.413104631
TRB - 2 0.843 0.417015437
TRB - 3 0.845 0.397255575
TRB - 4 0.845 0.410360206
TRB - 5 0.842 0.412555746
The ROC Index value reflects the quality of the model in discriminating between the different values of the target variable. In this case, the rating.
The TRB – 3 and TRB – 4 rules obtained the same value for ROC Index, 0.845. In this case, we use the Misclassification Rate to decide on the Text Rule Builder node that we will choose to analyze. Test Misclassification Rate of the TRB – 3 is lower than the one of TRB – 4, so, we choose the TRB – 3 to obtain and analyze the results.
33
Table 12. Results for the Text Rule Builder Node for the study with Rating as target variable. First 10 rules obtained for Rating = 1.
Target Value
Rule
# Rule Precision Recall F1 Score
True Positive/ Total Valid True Positive/Tot al 1 1 waste 88.98% 2.79% 5.42% 215/251 137/155 1 2 money & ~good & ~great & back 88.19% 4.27% 8.14% 123/144 72/95 1 3 month & ~good & ~love & ~great & stop 85.94% 5.77% 10.82% 121/150 76/98 1 4 scam 86.41% 6.34% 11.82% 45/51 26/31 1 5 cheat 87.12% 6.84% 12.68% 42/48 24/28 1 6 return & ~great & ~love & ~nice & ~small & ~exactly & ~great & ~overall & ~little & day 85.85% 8.47% 15.42% 144/180 70/100 1 7 fraud 86.31% 8.80% 15.98% 32/34 15/16 1 8 junk 86.62% 9.99% 17.91% 114/155 57/82 1 9 steal & ~great & report 86.93% 10.44% 18.64% 41/44 18/20 1 10 bad phone 85.90% 11,58% 20.41% 109/151 53/71
The first rule for the Target Value Rating 1 is “waste”, this rule has a precision of 88.98%, a recall of 2.79% and a F1 score of 5.42%. The rule number 2 is “money & ~good & ~great & back”, this rule has a precision of 88.19%, a recall of 4.27% and a F1 score of 8.14%. The rule number 3 has a precision of 85.94%, a recall of 5.77% and a F1 score of 10.82%.
34
Table 13. Results for the Text Rule Builder Node for the study with Rating as target variable. First 10 rules obtained for Rating = 5.
Target Value
Rule
# Rule Precision Recall
F1 Score True Positive/ Total Valid True Positive/Tot al 5 107 excellent & ~phone & excellent product 95.70% 1.00% 1.97% 180/189 131/136 5 108 perfect & ~phone 93.45% 2.87% 5.58% 342/375 183/210 5 109
well phone &
~buy 93.08% 4.73% 9.01% 337/370 179/202 5 110 awesome phone 92.36% 5.68% 10.70 % 182/209 115/135 5 111 recommend & highly 91.46% 7.07% 13.12 % 306/355 181/218 5 112
love & ~star & ~return & ~issue & ~problem &
~battery & ~disappoint
& ~time & ~contact & ~receive & ~screen & ~allow & ~network & ~few 88.47% 18.31 % 30.34 % 2,144/2, 482 1,264/1,468 5 113 excellent & ~return & ~star & ~back
& ~lose &
~phone 88.35% 21.46 % 34.53 % 789/887 512/558 5 114 fast & ~battery & ~return & ~usa & ~work
& love 88.48% 21.72 % 34.87 % 132/141 65/73 5 115 excelent 88.47% 22.26 % 35.57 % 108/123 68/75 5 116 exactly & ~return & ~phone 88.43% 23.25 % 36.82 % 216/250 143/161
35
The first rule obtained for the rating 5 is the rule number 107 “excellent & ~phone & excellent product”. This rule has a precision of 95.70%, a recall of 1% and a F1 Score of 1.97%. The second rule obtained is the rule number 108 “perfect & ~phone”. This rule has a precision of 93.45%, a recall of 2.87% and a F1 score of 5.58%. The rule number 109 has a precision of 93.08%, a recall of 4.73% and a F1 score of 9.01%.
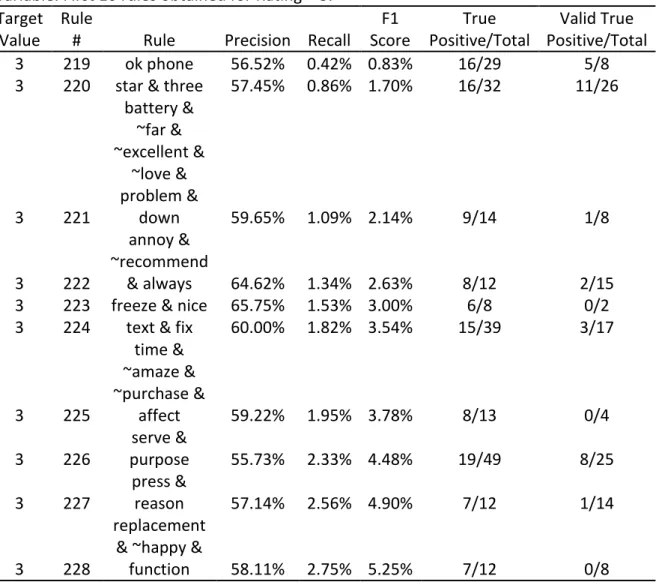
Table 14. Results for the Text Rule Builder Node for the study with Rating as target variable. First 10 rules obtained for Rating = 3.
Target Value
Rule
# Rule Precision Recall
F1 Score True Positive/Total Valid True Positive/Total 3 219 ok phone 56.52% 0.42% 0.83% 16/29 5/8
3 220 star & three 57.45% 0.86% 1.70% 16/32 11/26
3 221 battery & ~far & ~excellent & ~love & problem & down 59.65% 1.09% 2.14% 9/14 1/8 3 222 annoy & ~recommend & always 64.62% 1.34% 2.63% 8/12 2/15
3 223 freeze & nice 65.75% 1.53% 3.00% 6/8 0/2
3 224 text & fix 60.00% 1.82% 3.54% 15/39 3/17
3 225 time & ~amaze & ~purchase & affect 59.22% 1.95% 3.78% 8/13 0/4 3 226 serve & purpose 55.73% 2.33% 4.48% 19/49 8/25 3 227 press & reason 57.14% 2.56% 4.90% 7/12 1/14 3 228 replacement & ~happy &
function 58.11% 2.75% 5.25% 7/12 0/8
The first rule obtained for the Target Value Rating 3 is the rule number 219 “ok phone”. This rule has a precision of 56.52%, a recall of 0.42% and a F1 Score of 0.83%. The second rule obtained is the rule number 220 “star & three”. This rule has a precision of 57.45%, a recall of
36
0.86% and a F1 score of 1.70%. The rule number 221 has a precision of 59.65%, a recall of 1.09% and a F1 Score of 2.14%.
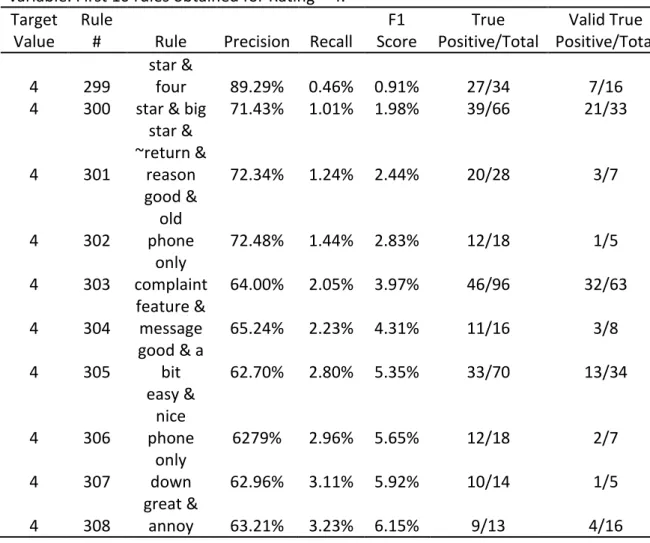
Table 15. Results for the Text Rule Builder Node for the study with Rating as target variable. First 10 rules obtained for Rating = 4.
Target Value
Rule
# Rule Precision Recall
F1 Score True Positive/Total Valid True Positive/Total 4 299 star & four 89.29% 0.46% 0.91% 27/34 7/16
4 300 star & big 71.43% 1.01% 1.98% 39/66 21/33
4 301 star & ~return & reason 72.34% 1.24% 2.44% 20/28 3/7 4 302 good & old phone 72.48% 1.44% 2.83% 12/18 1/5 4 303 only complaint 64.00% 2.05% 3.97% 46/96 32/63 4 304 feature & message 65.24% 2.23% 4.31% 11/16 3/8 4 305 good & a bit 62.70% 2.80% 5.35% 33/70 13/34 4 306 easy & nice phone 6279% 2.96% 5.65% 12/18 2/7 4 307 only down 62.96% 3.11% 5.92% 10/14 1/5 4 308 great & annoy 63.21% 3.23% 6.15% 9/13 4/16
The first rule obtained for the Target Value Rating 4 is the rule number 299 “star & four”. This rule has a precision of 89.29%, a recall of 0.46% and a F1 Score of 0.91%. The second rule obtained is the rule number 300 “star & big”. This rule has a precision of 71.43%, a recall of 1.01% and a F1 score of 1.98%. The rule number 301 has a precision of 72.34%, a recall 1.24% of and a F1 score of 2.44%.
37
Table 16. Results for the Text Rule Builder Node for the study with Rating as target variable. First 10 rules obtained for Rating = 2.
Target Value
Rule
# Rule Precision Recall
F1 Score True Positive/Total Valid True Positive/Total 2 383 refund & understand 83.33% 0.21% 0.41% 7/8 1/2 2 384 shut & annoying 83.33% 0.41% 0.82% 7/8 1/2 2 385 week & excite 78.26% 0.74% 1.47% 9/16 2/8 2 386 message & decide 75.76% 1.03% 2.03% 9/16 2/10 2 387 hear & ~fast & break 73.91% 1.40% 2.75% 10/19 1/14 2 388 hour & ~great & new battery 68.33% 1.69% 3.29% 9/17 4/13 2 389 disappoint & 2g 70.15% 1.93% 3.76% 9/11 0/1 2 390 spend & difficult 72.22% 2.14% 4.16% 6/8 0/4 2 391 problem & ~far & faulty 69.05% 2.39% 4.61% 8/15 1/11 2 392 problem & ~far & dead 67.01% 2.67% 5.14% 9/20 1/7
The first rule obtained for the Target Value Rating 2 is the rule number 383 “refund & understand”. This rule has a precision of 83.33%, a recall of 0.21% and a F1 Score of 0.41%. The second rule obtained is the rule number 384. This rule has a precision of 83.33%, a recall of 0.41% and a F1 score of 0.82%. The rule number 385 has a precision of 78.26%, a recall of 0.74% and a F1 score of 1.47%.
In an overall analysis it´s possible to say that in the reviews of products that received the Rating 1, the lowest rating, contains terms like “waste”, “money”, “cheat”, “return”, “junk”, “fraud”, “steal” and “bad phone” and doesn’t contain terms like “good”, “great”, “love” and “nice”.
38
The reviews of products that received the rating 5 contains terms like “excellent”, “perfect”, “awesome”, “recommend”, “love” and “fast” and doesn’t contain terms like “issue”, “problem”, “return”, “disappoint” and “lose”.
The reviews of products that received the rating 3 contains terms like “ok phone” and “nice” and doesn’t contain terms like “happy”, “recommend”, “excellent” and “love”.
Reviews of products that receive the rating 4 contain the term “only complaint”. Maybe this complaint is the reason why the rating is 4 and not 5.
Reviews of products that receive the rating 2 contain terms like “refund”, “break”, “disappoint” and “annoying” and doesn’t contain terms like “fast” and “great”.
To support this study analysis and to test with higher accuracy the hypothesis 4 “Reviews with extreme ratings receive more helpful votes than moderated ones.” we present the graph below with the information of the helpful votes by rating.
Figure 3. Review Votes by Rating.
Results show that reviews with extreme ratings – 1 and 5 – receive more helpful votes than moderated ones. Hypothesis 4 is, thus, supported. Our results are supported by previous
39
studies that suggested that reviews with extreme opinions tend to receive more helpful votes than moderated ones (Cao et al., 2011; Forman et al., 2008; S. Lee & Choeh, 2014).
Reviews that received rating 1 tend to include very negative terms, such as, “waste money”, “back”, “cheat”, “return”, “fraud”, “junk” and “bad phone” and tend to not include positive terms, like, “good”, “great”, “love” and “nice”. On the other hand, reviews of products that received rating 5 tend to include very positive terms, like, “excellent”, “excellent product”, “perfect”, “awesome phone”, “recommend” and “love” and tend to not include negative terms, such as, “return”, “issue”, “problem” and “disappoint”.
4.4. STUDY 4 RESULTS
In the tests the number of clusters that better described the reviews were 5 and the best SVD Dimension were also 5. In order to confirm our choice, we did a test with 5 clusters, the SVD Resolution was set to Medium and we tested with the SVD Dimensions 5 and 7. None of this tests had a better result than the one with the Text Cluster node set with SVD Resolution High, SVD Dimensions 5 and the Number of Clusters 5, so we decided to choose this node to analyze the results.
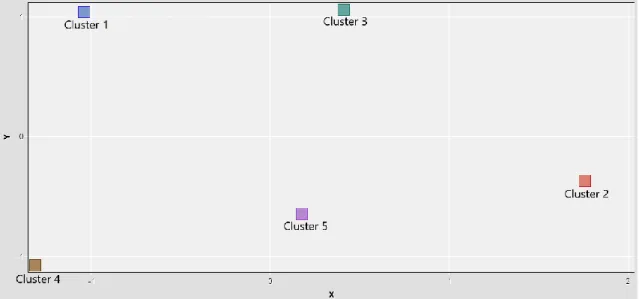
The visualization of the 5 clusters generated are displayed in the Figure 4, which shows that each of the 5 clusters is in its own non-overlapping region. This indicates that there´s no correlation between the 5 clusters. Each cluster is unique and informative.
40
Figure 4. Visualization for Cluster distribution. Note: Cluster 1: Sim Card and International Usage; Cluster 2: Bad Battery Experience and Bad Phone; Cluster 3: Unhappy Buyers; Cluster 4: Very Happy Customers; Cluster 5: Feature Level Reviews.
In Figure 5 we display the clusters and corresponding percentage of reviews in each cluster. Clusters 4 and 5 own most of the reviews, clusters 1 and 2 have the lowest number of reviews and cluster 3 has almost ¼ of the reviews.
Figure 5. Pie Chart for the 5 Clusters. Note: Cluster 1: Sim Card and International Usage; Cluster 2: Bad Battery Experience and Bad Phone; Cluster 3: Unhappy Buyers; Cluster 4: Very Happy Customers; Cluster 5: Feature Level Reviews.
41
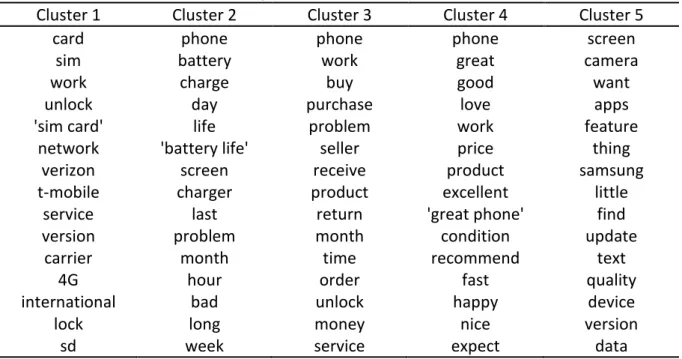
In Table 17 we show the 5 clusters obtained and the top 15 most descriptive terms for each cluster. In Cluster 1 there´s a prevalence of terms like “card”, “sim”, “work”, “unlock” and “international” that describes the sim card usage and international functionalities, so we refer Cluster 1 as “Sim Card and International Usage”. Cluster 2 contains terms describing a bad battery performance and an also a bad phone it-self. It consists in terms like “phone”, “battery”, “charge”, “problem” and “bad”, so we call it “Bad Battery Experience and Bad Phone”. Cluster 3 contains terms describing a very poor buying experience by the users. Terms like “buy”, “purchase”, “problem”, “seller”, “return” and “money” are user to describe this cluster, so we name this cluster as “Unhappy Buyers”. In Cluster 4 we find words describing the happiest customers. Terms like “great”, “good”, “love”, “excellent”, “great phone”, “recommend”, “fast” and “happy” are user to describe this cluster, so we call it “Very Happy Customers”. Finally, Cluster 5 contains terms related to the mobile features, such as “screen”, “camera”, “apps”, “feature” and “device”, so we refer to this cluster as “Feature Level Reviews”.
Table 17. Clusters obtained and Top 15 terms in each of 5 clusters.
Cluster 1 Cluster 2 Cluster 3 Cluster 4 Cluster 5
card phone phone phone screen
sim battery work great camera
work charge buy good want
unlock day purchase love apps
'sim card' life problem work feature
network 'battery life' seller price thing
verizon screen receive product samsung
t-mobile charger product excellent little
service last return 'great phone' find
version problem month condition update
carrier month time recommend text
4G hour order fast quality
international bad unlock happy device
lock long money nice version
42
We performed a further exploration of the cluster´s data to better a better testing to the hypothesis 1,2,3 and 5.
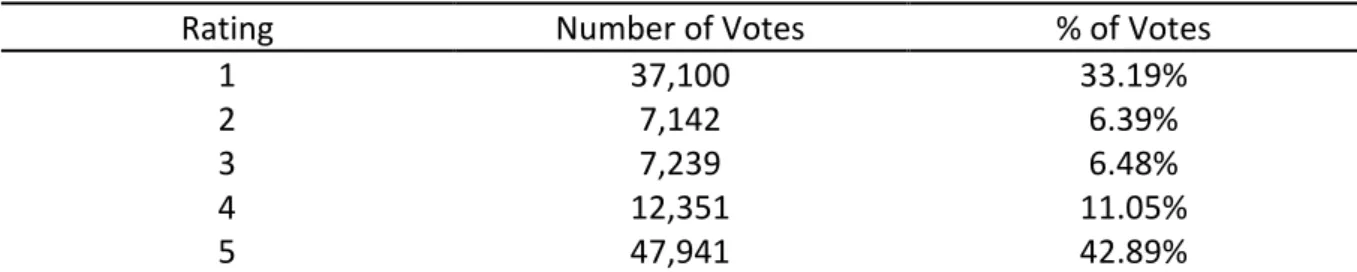
The table 18 show the number and percentage of helpful votes received by reviews distributed by their ratings.
Table 18. Review Distribution by Rating.
Rating Number of Votes % of Votes
1 37,100 33.19%
2 7,142 6.39%
3 7,239 6.48%
4 12,351 11.05%
5 47,941 42.89%
Results show that positive reviews receive more helpful votes (53.94%) than negative ones. these results provide support to the hypothesis 1 “Positive reviews are considered more helpful by readers than negative ones.” Previous studies also suggest the positive reviews have higher probability of being rated as helpful than negative ones (Chua & Banerjee, 2016; Liu & Park, 2015; Pan & Zhang, 2011; Purnawirawan et al., 2015).
Although this result allows us to develop very straight forward conclusions, the findings of our cluster analysis are not that clear. Reviews from cluster number 3, that are related to negative experiences regarding to the product, receives more helpful votes than the reviews from cluster 4, that includes reviews from the most satisfied customers. The test on hypothesis 2 may help on the analysis of this contradicting results.
The text categorization result suggests that subjective reviews tend to receive less helpful votes that objective ones. The cluster analysis confirms this finding. In the graph below, we present the number of helpful votes that the reviews for each cluster received.
43
Figure 6. Number of Helpfulness votes by Cluster.
Reviews from clusters 1 and 5, that describes the product features and its usage received more votes than the reviews from cluster 4, which reviews include subjective terms such as, “great”, “love”, “excellent” and “happy”. These findings confirm the findings from the Text Categorization analysis on Study 1, objective reviews tend to receive more helpful votes than subjective ones. This result provides a strong support to the hypothesis 2.
To clarify the contradicting findings from studies 1 and 4 regarding to the valence that tends to receive more helpful votes, we can conclude that positive reviews tend to receive more helpful votes, unless it has many subjective expressions. In that case, the tendency is to receive less votes.
In the next figure we present distribution of products by cluster and the proportion of products with high and low price for each cluster.
44
Figure 7. Price distribution by Clusters.
Results from the cluster analysis confirm the results from the text categorization analysis and provide stronger support on our hypothesis 3 test. These results confirm that products with high price are associated with highest level of satisfaction and products with low price are associated with lowest level of satisfaction. In cluster 4 – Very satisfied customers – there´s a higher proportion of reviews for products with the price high and in clusters 2 – Bad battery experience and bad phone – and 3 – Unhappy buyers – there´s a higher proportion of reviews for low price products.
To test the hypothesis 5 “The cluster that include reviews of the most satisfied users are the one with the highest average rating.” we present in the graph below the results of the average rating by cluster.
45
Figure 8. Average review rating by cluster.
Cluster 4, that include reviews from the most satisfied buyers, have the highest average rating (4.71). This result support our hypothesis 5. Also, clusters 2 and 3, that include reviews from the unhappy buyers and users that had a bad product experience, have the lowest average rating, 2.78 and 2.83 respectively.
5. DISCUSSION
The importance of online reviews on consumer decision process is increasing in the last years and the tendency is for it to keep growing. In a recent survey, 93% of consumers respond that online reviews have an impact on their purchasing decision survey (Podium, 2017).
In this research we used a Text Categorization analysis to access the characteristics of the reviews and to predict the helpfulness votes and ratings according to the review text and the product price, as well.
46
The main objective of this research was to access the impact of review valence, rating and type on helpfulness of reviews. We studied, also, the impact of the price on customer satisfaction and the relationship between customer satisfaction and ratings.
Our empirical results reveal that objective reviews tend to receive more helpful votes than subjective ones. This finding is supported by previous research (Chua & Banerjee, 2016; Ghose & Ipeirotis, 2011).
Consumers who bought the most expensive phones tend to post positive reviews using emotional terms, like, “love”, “beautiful” and “amazing phone”. On the other hand, consumers who bought the products with low price tend to post reviews without emotional expressions. Our results also show that products with high price tend to receive more reviews with the highest ratings, while products with low price tend to receive more reviews with the lowest ratings.
Reviews with extreme ratings – 1 and 5 – receive more helpful votes than moderated ones. This result is supported by previous studies (Cao et al., 2011; Forman et al., 2008; S. Lee & Choeh, 2014). Positive reviews receive more helpful votes than negative ones. Previous studies also suggest the positive reviews have higher probability of being rated as helpful than negative ones (Chua & Banerjee, 2016; Liu & Park, 2015; Pan & Zhang, 2011; Purnawirawan et al., 2015). Our results show an interesting finding. Positive reviews that don´t contain subjective expressions receive more helpful votes than positive reviews that contain subjective expressions.
The cluster that include reviews from the most satisfied buyers, have the highest average rating and the clusters that include reviews from the unhappy buyers and users that had a bad product experience, have the lowest average rating.
47
This research provides some important contributions to the literature. While previous research focused on the impact of the variables valence and rating on online reviews (Cao et al., 2011; Forman et al., 2008; S. Lee & Choeh, 2014; Moore, 2015; Mudambi & Schuff, 2010; Pan & Zhang, 2011; Purnawirawan et al., 2015; Salehan & Kim, 2016; Schlosser, 2011; Singh et al., 2017), this research combines the findings from a Text Categorization and a Text Clustering studies in order to provide more robust results, mainly by including the impact of review type, jointly with ratings and valence on review helpfulness.
Previous studies suggested that positive reviews tend to receive more helpful votes (Chua & Banerjee, 2016; Liu & Park, 2015; Pan & Zhang, 2011; Purnawirawan et al., 2015). This research confirms this result but includes one new factor, that is the subjectivity of the arguments. Subjective reviews tend to not receive helpful votes, even when they are positive.
To the best of our knowledge, our study is the first to suggest that mobile phones bought on Amazon.com website, that have a high price, are associated with higher level of user satisfaction, while mobile phones with low price are associated with the lowest level of user satisfaction. This indicates that the price of product is a very important factor of user satisfaction and it influences the ratings and the text of the online reviews they post on Amazon.
The result of the cluster analysis provides new finding for the community. It shows that the cluster that include reviews from the most satisfied buyers, have the highest average rating, but those reviews are not considered helpful.
Our results present valuable managerial implications. High price doesn’t seem to be a problem for the customers, as they don´t mind to expend more money on products that will satisfy their needs. Companies can invest more on Research and Development, in order to be able to produce mobile phones with better quality that will better satisfy its customers and they can
48
charge a higher price for that products. Companies should encourage their most satisfied customers to post positive reviews on Amazon detailing their experience with the mobile phone and specifying their evaluation on some features, such as, camera, screen and memory. One practical example of that can be: a firm invest money to develop a mobile phone with the best camera on the market and they should be able to communicate that. After the product being launched, they should encourage their most satisfied customers to post reviews explaining their opinions about some features. A company can post on their product page on Amazon a message like this: “let us know what you think about the camera of our newest model X”. With a process like this, the firm should be able to have many positive reviews with objective sentences on Amazon. Those reviews will be voted as being helpful by potential buyers and this can generate a positive impact on the buying process.
The findings of this research open space for further studies. It would be interesting to apply the same model of this study to find discrepancies from the results of this analysis made for search products (mobile phones) compared to experience products from the travel site TripAdivisor. It would be interesting to have a sentiment analysis study to analyze the actual sentiment expressed on the review and the impact of the sentiment valence on helpful votes. Although our results are very robust on the analysis of user satisfaction based on the expressions used on review corpus, it would be interesting to have a sentiment analysis study on reviews of products with high and low price, in order to better access customer´s satisfaction based on review text.