Master Thesis
The Impact of Ownership Structure on Firm Performance:
Evidence from Europe
Student | José Manuel de Freitas
Programme | MSc Double Degree in Management and International Business Track | Strategy and Innovation
Maastricht University Supervisor | Prof. Dr. Wilko Letterie Nova University Supervisor | Prof. Miguel Ferreira
2 Abstract
The ownership structure of a company has been identified as a key mechanism in corporate governance. The present study investigates the impact of ownership concentration and ownership identity on company economic performance. The sample consists of a unique database of 749 listed Continental European companies. The empirical results show that ownership concentration has a U-shaped relationship with firm performance. The effect of ownership concentration on corporate performance is also found to be negatively mediated by R&D investment and to vary across different legal settings. Furthermore, this research proposes and supports the hypothesis that the identity of the controlling shareholder has implications for corporate strategy and performance. In fact, corporate and state ownership have a positive and negative impact, respectively, on firm performance. Thus, the findings of this study suggest that ownership structure matters, particularly in a Continental European institutional setting.
Keywords: Ownership Structure, Ownership Concentration, Owner Identity, Agency
3 Table of Contents
1 Introduction ... 5
2 Literature Review and Hypothesis ... 8
2.1 Corporate Governance Theory ... 8
2.1.1 Principal-Agent Theory ... 8
2.1.2 Principal-Principal Theory ... 9
2.2 Ownership Structure and Corporate Performance ... 9
2.2.1 Ownership Concentration and Corporate Performance ... 9
2.2.2 Owner Identity and Corporate Performance... 13
2.3 The Mediating Role of R&D ... 15
2.4 Variations Across Regions ... 15
3 Methodology ... 19
3.1 Research Design ... 19
3.2 Data Source and Sample Selection Procedure ... 19
3.3 Variables and Measures ... 20
3.3.1 Dependent Variable ... 20 3.3.2 Independent Variables ... 21 3.3.3 Mediator Variable ... 22 3.3.4 Control Variables ... 22 3.4 Analytical Strategy ... 24 4 Results ... 26 4.1 Descriptive Statistics ... 26 4.1.1 Sample Characteristics ... 26
4.1.2 Checking Statistical Assumptions ... 27
4.2 Empirical Results ... 29
4.2.1 Control Variables and Firm Performance ... 30
4.2.2 Ownership Structure and Firm Performance ... 30
4.2.3 Mediating role of R&D ... 31
4.2.4 Variations across Regions ... 33
5 Discussion ... 35
5.1 Discussion of Empirical Findings ... 35
5.2 Implications ... 38
5.3 Limitations and Further Research ... 39
6 Conclusion ... 41
References ... 42
4 List of Figures
Figure 1: Conceptual Model ... 19
Figure 2: Firm Performance Measure ... 21
Figure 3: Ownership Structure Measures ... 22
Figure 4: Mediation Model for H4a ... 31
Figure 5: Mediation Model for H4b ... 32
Figure 6: Scatterplot of Stake vs. lnTobin ... 52
List of Tables Table 1: Literature on Ownership Concentration and Firm Performance ... 12
Table 2: List of Variables and Codes ... 23
Table 3: Descriptive Statistics of the Scale Variables ... 27
Table 4: Correlation Matrix of the Scale Variables ... 27
Table 5: Descriptive Statistics of the Deflated Variables ... 28
Table 6: Regression Results (DV = lnTobin) ... 29
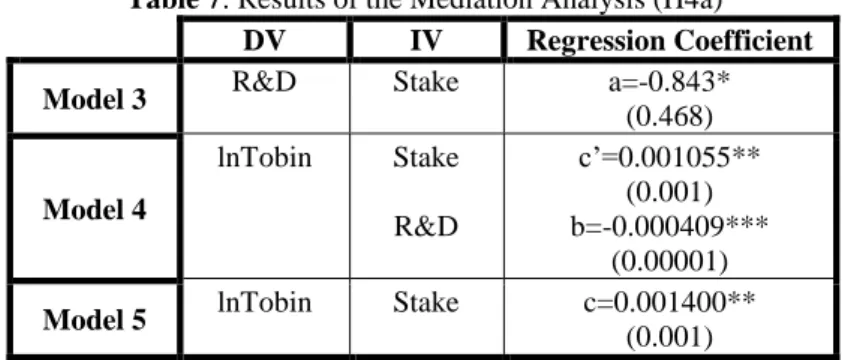
Table 7: Results of the Mediation Analysis (H4a) ... 31
Table 8: Results of the Mediation Analysis (H4b) ... 33
Table 9: Descriptive Statistics of Ownership Concentration by Region ... 33
Table 10: Correlation Matrix... 34
Table 11: Regression Results (DV =lnTobin) ... 34
Table 12: List of Countries Included in the Sample ... 49
Table 13: Frequency Table of Region ... 50
Table 14: Frequency Table of Ownership Identity ... 50
Table 15: Frequency Table of Industry ... 50
Table 16: Variance Inflation Factors ... 51
Table 17: Durbin-Watson and Modified White Test Results ... 51
Table 18: Bootstrap for Coefficients (DV=lnTobin) ... 52 List of Abbreviations
OLS – Ordinary Least Squares 2SLS – Two-Stage Least Squares UK – United Kingdom
US – United States
EFES - European Federation of Employee Share Ownership R&D – Research and Investment
et al. - (Latin et alii) and others ROA – Return on Assets
SIC – Standard Industrial Classification R2 - R Squared (Coefficient of Determination)
5 1 Introduction
The gap between ownership and control is a phenomenon that is at the heart of many large companies and precipitates conflicts of interest between principals (owners) and agents (managers). While principals are focused on enhancing the value of the firm, agents prefer to pursue their own short-term and financial interests (Berle & Means, 1932). Jensen and Meckling (1976) described this divergence of interests as the agency theory. Corporate governance provides a guarantee to those that supply capital to a company that they will get a return on their investment (Shleifer & Vishny, 1997) and it can be described as the process by which investors attempt to minimize agency costs (Coase, 1937).
Ownership structure is an important component of corporate governance (Shleifer & Vishny, 1986). The ownership structure of a firm is explained by ownership concentration, which provides quantitative data about the stake of the shareholder(s), and ownership identity, which provides qualitative data regarding the character of the shareholder(s). Concentrated and dispersed ownership can both lead to agency problems between different shareholders or stakeholders (Isik & Soykan, 2013) and different types of owners will differ in the objectives, risk preferences, and investment horizons they set for the firm, leading to dissimilar types of outcomes in terms of performance (Hautz et al., 2013). The controlling owner, defined as the largest shareholder, has the highest importance in the firm. Previous research argues that the controlling owner receives more attention from firm management and has access to more information than other shareholders (Useem, 1996; Schnatterly et al., 2008). Subsequently, the controlling owner may be in a privileged position to monitor, discipline and influence agents (Muller-Kahle, 2013).
R&D activities are very important to create a sustainable competitive advantage and enhance firm performance (Hall & Oriani, 2006). However, these can also be associated to agency costs. Even though R&D investments might result in higher performance, agents might tend to underinvest into R&D investments compared to principals, due to the high risk of failure and the long-term horizon associated with these investments (Holmström, 1989). Nonetheless, the literature has not gathered consensus whether controlling owners are long-term oriented and promote R&D investments (Chen, 2010).
The relationship between ownership structure and economic performance has been one of the most widely researched areas in management (Demsetz & Villalonga, 2001). Regardless of the massive volume of empirical work available on this topic, scholars have
6 not reached an agreement, with different authors achieving inconsistent and even contradictory empirical evidence (Džanić, 2012). This research has considered mainly an Anglo-Saxon corporate governance structure (Gugler et al., 2008), which is not necessarily representative for continental Europe where the legal/institutional environment is quite different (Pedersen & Thomsen, 2003), corporate governance mechanisms are nearly non-existent in some countries (Shleifer & Vishny, 1997), share ownership is much more concentrated (Isik & Soykan, 2013), and stock markets are less developed (Pedersen & Thomsen, 2003). Although recent studies have moved towards analyzing the relationship between ownership structure and performance in Europe (Lisboa & Esperança, 2008), they study Europe as a unit and therefore disregard regional specificities such as macroeconomic instability and investors legal protection (Thomsen & Perdersen, 2000). A meta-analysis by Wang and Shailer (2015) supports the need for comparative studies of the relationship between ownership structure and firm performance across countries with similar corporate governance environments.
Thus, there are several research gaps on prior research concerning the ownership of corporations (Boyd & Solarino, 2016). This paper contributes to the literature by extending previous work to the different regions of continental Europe, allowing to compare the effect of ownership structure as a corporate governance mechanism within different institutional and legal settings. The results may boost the consistency and reliability of previous findings and provide information that can be used to achieve a more accurate definition of optimal ownership structure. Moreover, this research seeks to improve our understanding of how R&D investment mediates the relationship between ownership structure and firm performance, which is an aspect that was neglected by previous studies. Investigating the unknown impact of R&D investment may provide new insights to the existing literature. Furthermore, this study builds on the relatively limited literature on the impact of controlling ownership (Filatotchev & Wright, 2001; Muller-Kahle, 2013).
The objective of this study is to provide empirical evidence on whether and how corporate ownership structure influences the performance of European listed companies, focusing on the role and identity of the controlling shareholder. The research question for this study is as follows: What is the effect of ownership structure on the performance of European
listed companies? Furthermore, it has been divided into four sub-questions: 1. How does
7 identity impact the performance of European firms? 3. Does R&D investment mediate the interaction between ownership structure and firm performance? 4. Can differences across countries explain variation in performance?
The rest of this thesis is organized as follows: chapter two discusses the theoretical foundations underpinning the present research and presents the hypothesis that will be tested in this study; chapter three describes the data sources and statistical methods used; chapter four reveals the research findings per hypothesis; chapter five discusses the results of this study by comparing it to previous literature, provides implications for academics, managers and policy makers, and discusses the limitations of the study; chapter six answers the problem statement, providing an overview of the empirical results obtained.
8 2 Literature Review and Hypothesis
The following chapter, which is divided into four sub-sections, aims to discuss the theoretical foundations supporting every hypothesis development. As a result, it: (i) provides a general overview of the corporate governance theory and the relevant literature within the field, to draw up the universe within which this research is constructed; (ii) elaborates on the relationship between ownership structure and firm performance, supporting it with findings from empirical research; (iii) explores R&D investment in the context of the ownership literature; and (iv) elaborates on corporate governance differences across Continental European regions, supporting it with findings from previous studies.
2.1 Corporate Governance Theory
Corporate governance can be described as the various mechanisms that investors use to reduce agency costs (Coase, 1937). The existing literature considers that ownership structure is an important mechanism of corporate governance (Shleifer & Vishny, 1997). The lack of corporate governance systems in less developed capital markets increases the risk of managers not following the stakeholder approach, where they make decisions according to the interests of the firm’s stakeholders as a whole (Shleifer & Vishny, 1997; Driver & Thompson, 2002). Corporate governance mechanisms are usually linked with the existence of agency costs, being essential to overcome potential principal-agent and principal-principal problems.
2.1.1 Principal-Agent Theory
Agency theory is the approach that is used more often when studying ownership issues (Boyd & Solarino, 2016). Berle and Means (1932) were the first to introduce the concept of agency theory, stating that the interests of firm’s managers often differ from the interests of the shareholders of the company. An agency cost occurs when there is a separation of ownership and management. In other words, agency theory states that the principal and the agent both want to maximize their utility and by doing so they will not act in the best interest for each other (Jensen & Meckling, 1976). Jensen and Meckling (1976) define agency costs as the value lost by shareholders due to the divergent interests between principal and agent.
To avoid the negative impact of agency costs on firm value, it is important to align principal and agent interests (Fama & Jensen, 1983). Nevertheless, due to the imperfect nature of contracts, it is impossible to develop a contract that accounts for every possible
9 action of an agent (Shleifer & Vishny, 1997; Nyberg et al., 2010). The absence of an alignment between both parties can lead to several adverse outcomes. For example, managers may favour strategic actions, such as mitigating risk, in order to increase their own financial rewards, potentially at the cost of shareholder return and the firm’s long-term performance (Baumol, 1967; Boyd & Solarino, 2016).
The two main types of principal-agent problems described in the literature are adverse selection and moral hazard. Whilst the first occurs ex ante writing the contract and arises due to hidden information, the latter exists ex post writing the contract and happens due to hidden action (Arrow, 1984). Adverse selection describes a situation where the principal is unable to observe the qualities of the agent in an accurate way (Furubotn & Richter, 2005). This asymmetry of information often leads to the principal, which has less information, to make bad decisions. On the other hand, the problem of moral hazard occurs because the principal is unable to completely evaluate the causes of the outcome of the agent’s actions, since these can be influenced by internal as well as external factors (Arrow, 1984; Jensen & Meckling, 1973). Consequently, this will lead to a situation where agents will act on their own incentives at the cost of the principal (Jensen & Meckling, 1973).
2.1.2 Principal-Principal Theory
The traditional agency model has led to the development of the principal-principal agency theory which explains the conflict between controlling owners and minority investors (Young et al., 2008). This theory states that in less developed capital markets principal-principal conflicts may occur. These conflicts arise when the controlling owner emphasizes his own goals, expropriating value from minority shareholders. This results in the transfer of value from minority shareholders to the controlling shareholder (Morck et al., 2005; Shleifer & Vishny, 1997). Thus, although controlling shareholders reduce the agency cost of managers, whether their presence is beneficial for companies depends on their expropriation behaviours (La Porta et al., 2000). According to Young et al. (2008), principal-principal conflicts are caused by concentrated ownership and control, weak legal protection of minority shareholders and inefficient corporate governance systems.
2.2 Ownership Structure and Corporate Performance
The effect of ownership structure, in terms of ownership concentration and ownership identity, on firm performance has been extensively researched in the literature. The
10 interconnection between ownership and management is an efficient substitute for costly corporate governance mechanisms (Schulze et al., 2002), reducing or even eliminating the existence of agency costs such as adverse selection and moral hazard. Nevertheless, presently most public companies have a concentrated ownership structure and are controlled by a dominant shareholder (La Porta et al., 1999), named as controlling shareholder.
2.2.1 Ownership Concentration and Corporate Performance
Ownership concentration is defined as the number of shares owned by a firm’s shareholders and measures if these shares are widely or closely held by the listed companies (OECD, 1993; Demsetz & Villalonga, 2001). Scholars have defined two conflicting paradigms in the literature: the alignment theory and the expropriation theory. Whilst the first states that ownership concentration has a positive influence on company performance, the latter defends the contrary effect.
The alignment theory defends that controlling shareholders have more motivation to monitor the actions of managers, allowing the firm to achieve a better performance due to lower agency costs (Shleifer & Vishny, 1997; Jensen & Meckling, 1976). When shareholders own a larger stake of the company’s stocks there are more incentives for them to control managers, since they could be more affected by the actions of these (Denis & McConnell, 2003). In other words, large shareholders achieve more benefits by staying informed than the cost, in terms of time and money, required to be able to obtain the information. Shleifer and Vishny (1997) argue that large shareholders can improve firm performance by changing the strategy of the company or by negotiating with or replacing the management team. These authors state that managers maximize profits imperfectly and therefore large shareholders can find improvements that the incumbent management is not aware of. Moreover, ownership concentration can work as a substitute for weak legal and institutional environments, with a positive effect on firm performance (Wang & Shailer, 2015; Perotti & von Thadden, 2006).
On the other hand, the expropriation theory argues that concentrated ownership may increase the probability of conflicts between large shareholders and minority shareholders (Denis & McConnell, 2003). Thus, controlling shareholders can act in their own interest and use their power to benefit themselves at the expense of minority shareholders (Shleifer & Vishny, 1997). Naturally, pursuing the interests of the dominant shareholders may lead to worse firm performance, since interests of controlling shareholders and firm
11 interests may diverge (Leung & Horwitz, 2009). Additionally, concentrated ownership may imply lower performance due to less access to external finance and a negative impact on other corporate governance mechanisms, such as the board of directors (Wang & Shailer, 2015).
Although many researches have tried to examine the impact of large shareholders, these have often found contradicting or mixed results (Al-Najjar, 2015), failing to shed light on to which extent ownership concentration pays off. In fact, some researchers do not find any impact at all of the ownership structure on firm performance (Demsetz & Villalonga, 2001; Chen et al., 2005). These scholars defend that the optimal ownership structure highly depends on the environment the company is incorporated in (Becker, 1962). According to this viewpoint, companies that have an inefficient ownership structure will be eliminated by the market competition.
Yet, many papers have found a positive relationship between ownership concentration and firm performance (Brailsford et al., 2002; Edwards & Weichenrieder, 2004). These results indicate that companies should increase stocks owned by dominant shareholders indefinitely. A less significant portion of studies, have found ownership concentration to be prejudicial for corporate performance (Dyck et al., 2004; Burkart et al., 1997; Pervan et al., 2012). This means that ownership concentration should be discouraged due to its detrimental impact on firm performance. More recently, there has been a focus on the possibility of a non-linear relationship between ownership concentration and firm performance, suggesting that the two previous viewpoints might in fact complement each other. Studies concluded that at first there is an increasing effect of ownership concentration on firm performance and then a decreasing effect of ownership concentration on firm performance, documenting an inverted U-Shaped relationship (Thomsen & Pedersen, 2000; Liu et al., 2012; Arosa et al., 2010; Kapopoulos & Lazaretou, 2007). Thus, this stream of research argues that ownership concentration has two conflicting effects on company performance (Gugler et al., 2008).
12
Author Year Sample Performance
Measure
Ownership
Measure Key Findings
Demsetz and Villalonga
2001
223 firms from all sectors of the US economy Tobin’s Q Percentage of shares owned by 5 largest shareholders No significant relation between ownership concentration and performance Edwards and Weichenrieder 2004 97 listed German corporations from 1992 Value of corporate equity First and second largest shareholder control rights Positive effect on minority shareholders of ownership concentration Pervan et al. 2012 Listed Croatian firms during the period from 2003 – 2010 ROA Concentration of the 4 largest shareholders Report a negative influence of concentration on firm performance Thomsen and Pedersen 2000 435 of the largest European companies in 1990 Shareholder value and profitability Ownership share of the largest owner Large shareholders’ ownership has an inverted U-shaped relation
Table 1: Literature on Ownership Concentration and Firm Performance
Although empirical results have diverged, as can be understood from the explanation above, there are two main theoretical predictions that give rise to a non-linear relationship between ownership concentration and firm performance. According to the alignment
theory, concentrated ownership may minimize the agency problems that occur between
controlling shareholders and the managers of the firm. Consequently, concentrated ownership may have a positive impact on firm performance due to the monitoring effect. On the other hand, the expropriation theory states that when ownership concentration exceeds a certain level, controlling shareholders may extract private benefits at the cost of other stakeholders, leading to a decrease in corporate performance. This said, it is expected that there is an increasing effect of ownership concentration on firm performance until a certain point and then a decreasing effect of ownership concentration on firm performance.
H1: A higher share of ownership of the controlling shareholder decreases firm
13 H2: The share of ownership of the controlling shareholder has an inverted U-shaped
relationship with firm performance.
2.2.2 Owner Identity and Corporate Performance
The identity of a firm’s owner is one of the most important factors affecting the strategy and performance of a company (Xia & Walker, 2015). Each type of owner has different incentives and consequently imposes different type of goals in terms of profit, dividends, capital structure, and growth rates (Thomsen & Pedersen, 2000). Consequently, it is important, not only how much equity a shareholder owns, but also who that shareholder is. This thesis will focus on four owner identities: family, state, corporate, and institutional. These are among the main ownership types of publicly-traded companies around the world (Munari & Sobrero, 2010).
2.2.2.1 Family Ownership
Family firms are usually linked to a double role for the family as owners and managers of the firm (Thomsen & Pedersen, 2000). Thus, families act on their own behalf and therefore they can pursue more focused strategies than other type of owners (Gomez-Mejia et al., 2010). The fact that families make large firm-specific investments in human capital (Maug, 1996) and invest a large proportion of their personal wealth in a single company (Gomez-Mejia et al., 2010) leads to them being risk-averse and unwilling to give up control (Hautz et al., 2013).
Claessens et al. (1999) documented high conflicts of interest between minority shareholders and controlling family, resulting in inferior company performance. These results suggest that families may attempt to expropriate minority shareholders. Nevertheless, most studies have found a positive association between family ownership and firm performance (Anderson & Reeb, 2003; Wenyi, 2011; Chu, 2011; Boyd & Solarino, 2016). The in-depth knowledge that families have of the firm enables efficient monitoring, which in turn reduces the principal-agent problem.
H3a: Family ownership has a positive impact on firm performance. 2.2.2.2 State Ownership
In many countries, especially in industries considered of public interest, the state owns some listed firms. The objective of state-owned corporations is less profit-oriented and more focused on maximizing social welfare (Shen & Lin, 2009). Hence, governments
14 may invest in private firms to achieve political, economic, or social goals (Shleifer & Vishny, 1994; Cuervo & Villalonga, 2000), which are often associated with poor financial performance and low firm value (Hart et al., 1997). State-owned companies may benefit from some competitive advantages by having the government as their controlling shareholder, such as tax exemptions (Capobianco & Christiansen, 2011), easier access to credit (Tian & Estrin, 2008) or the creation of new regulations in favour of the firm (Borisova et al., 2012). Nonetheless, these benefits are overcome by the role these companies assume of correcting market failures (Thomsen & Pedersen, 2000). For example, the government may disregard profit in favour of reducing unemployment, extracting tax revenues, or contributing to the stability of the financial system (Borisova et al., 2012). The visibility of the social benefits pursued, which are highly dependent on regional differences, is critical to politicians (Shleifer & Vishny, 1996; Shleifer & Vishny, 1994).
Most of the empirical studies conclude that government ownership has a negative impact on performance (Thomsen & Pedersen, 2003; Dewenter & Malatesta, 1998; Goldeng et al., 2008). These results seem to indicate that the various competitive advantages these firms have could discourage monitoring, which in turn can trigger agency problems. This may happen because the monitoring costs are higher than the political payoff (Shen & Lin, 2009).
H3b: State ownership has a negative impact on firm performance. 2.2.2.3 Corporate Ownership
Corporations may hold a large stake of shares in other companies as part of cross-ownership or company group structures (Ghemmavat & Khanna, 1998; Kester, 1992). Although corporate ownership can provide access to valuable technology or capital that might improve the value of the allied companies (Kester, 1992), the target firm also loses some level of control and flexibility (Connelly et al., 2010).
Previous research has not gathered consensus on whether the benefits of corporate ownership outweigh the costs associated (Demsetz, 1983). Thomsen and Pedersen (2000) found a negative relationship between corporate ownership and firm value, stating that corporate owners are more concerned with firm survival rather than shareholder value. Nevertheless, there seems to be more evidence that support a positive relationship between corporate ownership and firm value in continental European firms (Pedersen &
15 Thomsen, 2003; Connelly et al., 2010; Bauguess et al., 2009). In fact, this stream of research states that corporate ownership brings capital that can be used for growth, which in turn could lead to a better firm performance (Connelly et al., 2010).
H3c: Corporate ownership has a positive impact on firm performance. 2.2.2.4 Institutional Ownership
Institutional ownership is defined as “the fraction of a firm’s shares that are held by institutional investors” (Chung & Zhang, 2011, p.250). Scholars have distinguished two categories of institutional investor: pressure resistant and pressure sensitive (Kochhar & David, 1996). The former (e.g. pension, hedge, and mutual funds) does not have any business relationship with the firm, whilst the latter (e.g. banks, and insurance companies) is constrained by regulatory requirements and subsequently has less ability to influence firms (Brickley et al., 1988; Boyd & Solarino, 2016). Institutional investors provide easy access to capital, have low risk aversion, are normally specialists in business, and are highly concerned with shareholder value, since their performance is often measured in terms of financial success (Pound, 1988; Thomsen & Pedersen, 2000). Moreover, scholars have pointed out the informational and analytical advantages of institutional investors compared with other types of owners (Yuan et al., 2009).
In general, researchers have found a positive impact of institutional ownership on firm performance (McConnell & Servaes, 1990; Thomsen & Pedersen, 2003; Tuggle et al, 2010). These findings have been associated to both categories of institutional investors, namely pressure resistant and pressure sensitive (Boyd & Solarino, 2016). These results indicate that institutional ownership may enhance firm performance through superior monitoring, since many fiduciary responsibilities are involved.
Hypothesis 3d: Institutional ownership has a positive impact on firm performance. 2.3 The Mediating Role of R&D
R&D expenditures are investments in activities that contribute to product innovation, process innovation or the managing of innovations (Kastl et al., 2013). R&D investments have unique characteristics that make them different from other kind of investments (Singh & Faircloth, 2005). First, they are long-term investments, requiring a continuous input of human and financial resources (Munari et al., 2010). Second, R&D activities are specialized and can only be fully deployed in its original company (Williamson, 1988). Third, they are associated with high failure rates and can generate negative cash flows for
16 long periods (Munari et al., 2010). Surprisingly, there is very little empirical research on the interplay between ownership structure, R&D investments, and firm performance. In fact, this study is the first to empirically examine whether R&D plays a significant role in mediating the performance of a firm in relation to its ownership structure.
According to agency theory, the corporate R&D strategy may result in principal-agent conflicts. Managers focus on short-term gains through efficiency-seeking investments and therefore may be reluctant to the long-term nature and high failure rate of R&D projects (Mansfield, 1968). On the other hand, high investment in R&D is generally attractive for shareholders since they forestall a positive effect on firm performance and they can reduce inherent risk by promoting a diversified investment portfolio (Hay & Morris, 1979). Ownership “represents a source of power that can be used either to support or oppose management, depending on how it is concentrated” (Salancik & Pfeffer, 1980, p.655). Consequently, ownership concentration has important strategic implications for R&D investments. In fact, since controlling shareholders have more power over management than minority shareholders (Cubbin & Leech, 1983), these have more incentives to monitor managers in order to guarantee that value-enhancing investments such as R&D are pursued. Accordingly, the general findings in the literature demonstrate that ownership concentration has a positive effect on R&D intensity (Cho, 1998; Hill & Snell, 1988; Barker & Mueller, 2002).
The differences in the owner’s preferences, behaviours, and investment horizons lead to divergent effects on innovation development (Hoskisson et al., 2002; Munari & Sobrero, 2010). Although the empirical findings from research confirmed the existence of a significant relationship between ownership identity and R&D investment, whether the impact is positive or negative is highly contingent on the institutional environment that affects the company. Institutional ownership is usually positively associated with R&D expenditure, although the effect is stronger for pressure resistant investors (Boyd & Solarino, 2016). This indicates that institutional investors assume a long-term perspective and are able to induce companies to be more innovative (Zahra, 1996; Aghion et al., 2013). Mixed results have been yield for corporate ownership, with studies suggesting that this type of ownership can both increase or decrease the level of R&D investment (Domadenik et al., 2008; Allen & Phillips, 2000). The investment horizons and the desire to generate the public good of knowledge, favours the tendency of state-controlled firms to invest in R&D (Munari et al., 2010; Munari et al., 2002). Family-controlled firms are
17 generally associated with more conservative strategies in terms of R&D investment (Boyd & Solarino, 2016). This could be explained by the fact that families classically invest a significant amount of their own capital in the company and therefore leads to them becoming risk-averse (Rossi & Cebula, 2015)
Scholars have thoroughly explored the relationship between R&D investments and firm performance and once again the results have been contradictory. Yet, the consensus seems to be that investment in R&D is vital for the survival and growth of firms, although this highly depends on the industry and market the firm is competing in (Lee & O’Neill, 2003). Companies that invest in R&D activities can differentiate themselves from competitors, in terms of product innovation or even cost efficiency, which could result in more profits (Ting et al., 2016). Thus, several scholars have confirmed this intuition and demonstrated that R&D investments have a positive impact on firm performance (Lau, 1998; Hill & Snell, 1988).
H4a: R&D investment mediates the relationship between ownership concentration and
firm performance.
H4b: R&D investment mediates the relationship between ownership identity and firm
performance.
2.4 Variations Across Regions
The relationship between ownership structure and firm performance is dependent on the national institutions companies are embedded in (La Porta et al., 2002). This way, the efficiency of the ownership structure as a corporate governance mechanism, varies with the institutional structure at the country level (Young et al., 2008). The geographical position, the legal and regulatory system, industrial development, and cultural characteristics, along with other factors, influence the impact of ownership structure on firm performance (Pedersen & Thomsen, 1997). The legal protection of investors is the most important determinant of regional differences in ownership effects (La Porta et al., 2000; Lisboa & Esperança, 2008). As mentioned previously, when there is a lack of investor protection, a conflict of interest occurs between the controlling shareholder and minority shareholders. This could lead to the controlling shareholder favouring private benefits over corporate performance (Shleifer & Vishny, 1997).
The ownership structure of a company could have a dissimilar impact on firm performance, depending on the legal system in place. The various regions of Continental
18 Europe have different dominant law systems. The French civil law is common across countries in Southern Europe (Lisboa & Esperança, 2008). In these nations, the quality of the legal rules is low and their enforcement is weak, leading to principal-principal conflicts (La Porta et al., 1998). Consequently, concentrated ownership is desired to avoid expropriations and to increase performance. On the other hand, the Scandinavian civil law is frequent across countries in Northern Europe (Lisboa & Esperança, 2008). These countries have a better quality of law enforcement and investors are better protected (La Porta et al., 1998). Thus, the concentration of ownership is not so important to enhance performance.
H5: Ownership concentration contributes more to firm performance in Southern Europe
19 3 Methodology
The purpose of this chapter is to describe the methodology used to test the hypotheses previously formulated. Therefore, it specifies: (i) the research design adopted; (ii) the process of data collection and the sample drawn for this study; (iii) the variables used to measure financial performance, ownership structure and R&D investment; and (iv) the analytical strategy followed.
3.1 Research Design
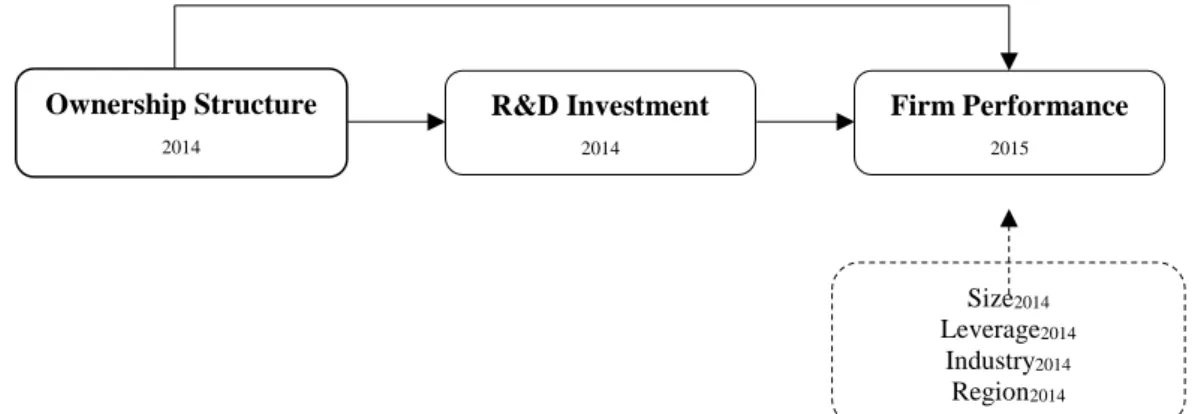
This study makes use of quantitative data and methods to investigate the relationship between ownership structure and firm performance. According to Blumberg et al. (2014), research can be classified as formal or exploratory. This research can be classified as a formal study, because it aims to examine the effect of ownership structure on the performance of companies. As the focus of previous research has been on countries with an Anglo-Saxon corporate governance structure (Gugler et al., 2008), the geographical setting of this study is based on companies of Continental Europe. The time dimension analysed is constrained due to data availability, making this a cross-sectional study. Hence, this research builds on the following conceptual model:
Figure 1: Conceptual Model
Source: Own Elaboration
3.2 Data Source and Sample Selection Procedure
To conduct this research, two secondary data sources were combined. This research uses the EFES database, an extensive database covering ownership data from 31 countries in Europe, and the Compustat Global database, which is an international database containing financial and market data. While the Compustat Global database is recognized among scholars as a credible and reliable source of information, the EFES database can also be considered as highly accurate, because it is based on each firm’s annual reports.
Ownership Structure 2014 R&D Investment 2014 Size2014 Leverage2014 Industry2014 Region2014 Firm Performance 2015
20 Secondary data availability and constraints in each database contributed to define both the period and the sample size. The raw sample data consists of the 2500 largest European listed companies for which the EFES database provides ownership structure data. Given the context of this study, companies operating in the UK and Ireland were excluded. An overview of the counties included in this study can be found in Appendix I. In addition, data concerning total assets, total equity, net income (loss), employees, market value, R&D expenditures, and SIC codes were retrieved from Compustat Global. Firm performance data was collected for 2015 and used as the dependent variable. The data required for the independent variables, mediator, and control variables were collected for 2014. Given this research design, it is unlikely that the measures for the non-independent variables, which were collected in the earlier period, are impacted by firm performance in the succeeding period (Muller-Kahle, 2013). Thus, reverse causality issues are less probable. Exceptionally, R&D expenditures are considered to be zero when reported as “missing” by Compustat. This assumption has been tested and used by previous scholars (Hirschey et al., 2012; Chauvin & Hirschey, 1993). Companies belonging to the sample are required to have full information over the sampling period for all the other variables. Therefore, the final sample consists of 749 companies from 29 different countries, complying with the following criteria:
Firms belonging to Continental Europe;
Firms with data available simultaneously on EFES and Compustat;
Firms whose data regarding the dependent variable is available for 2015 and data regarding the independent and control variables is available for 2016;
R&D expenditures data reported as “missing” was considered to be zero for all companies included in this study.
3.3 Variables and Measures 3.3.1 Dependent Variable
Firm Performance
Corporate financial performance can be measured using accounting-based measures and market-based measures (Al-Matari et al., 2014). These types of measures “focus on different aspects of performance” (McGuire et al., 1988, p.859). Accounting-based measures reflect the historical performance of the firm, being subject to bias from differences in accounting rules and therefore sensitive to manipulation (Krivogorsky, 2006). On the other hand, market-based measures represent the investors’ expectations
21 concerning future performance rather than past performance (Al-Matari et al., 2014). The choice of a certain type of measure may affect empirical results (McGuire et al., 1988).
Tobin’s Q, which is a market-based measure, is present in the essential academic literature concerning the relationship between ownership structure and firm performance (Morck et al., 1988; McConnell & Servaes, 1995; Hermalin & Weisbach, 1991). This measure is a better performance indicator than return on assets (ROA) or return on equity (ROE), which are accounting-based measures (Morck et al., 1988; Cui & Mak, 2002). A Tobin’s Q above one indicates positive market expectations of the company’s current and future projects and their quality. On the other hand, results bellow one indicate moderate or negative expectations about the company’s plans (Cui & Mak, 2002; Lang et al., 1989). Thus, this study will rely on Tobin’s Q as a measure of firm performance.
Figure 2: Firm Performance Measure
Source: Own Elaboration
3.3.2 Independent Variables
Ownership Structure
Several measures of ownership structure can be found in the literature. The two major dimensions of ownership structure are ownership concentration and ownership identity (Leech & Leahy, 1991). Thomsen and Pedersen (2000) state that the share and identity of the controlling owner is a good measure of ownership structure in European companies. This study uses the EFES database to assess these dimensions.
Ownership concentration is measured by the stake of the controlling shareholder. This research defines a controlling shareholder as the single person holding, directly or indirectly, at least 25 percent of the capital or votes. This is consistent with previous literature, which refers this value as being the minimum stake necessary for a shareholder to have a significant influence on a company’s performance (Wiwattanakantang, 2001). Moreover, this study applies dummy variables to distinguish the four ownership categories described in the literature review: family, state, institutional, and corporate ownership. Firm Performance Measure Tobin’s Q = 𝑻𝒐𝒕𝒂𝒍 𝑴𝒂𝒓𝒌𝒆𝒕 𝑽𝒂𝒍𝒖𝒆 𝑻𝒐𝒕𝒂𝒍 𝑨𝒔𝒔𝒆𝒕𝒔
22
Figure 3: Ownership Structure Measures
Source: Own Elaboration
3.3.3 Mediator Variable
R&D Investment
This research uses R&D expenditures, which represents all costs that relate to a firm’s total annual expenditure in the development of new products or services, to measure R&D intensity. This choice is motivated by the ease and availability of data, as well as the acceptance among scholars (Munari et al., 2010; Filatotchev & Piesse, 2009). Companies with high R&D expenditures can have positive returns in the future and therefore increase their performance (Lau, 1998; Hill & Snell, 1988).
3.3.4 Control Variables
Firm Size
The size of a company is a crucial factor to explain firm-specific heterogeneity. Studies suggest that larger firms have a lower risk of financial distress and achieve economies of scale and synergies. Thus, there is a positive relationship between firm size and firm performance (Claessens et al., 2002; Anderson & Reeb, 2003; Pedersen & Thomsen, 1999). This study will use the natural logarithm of the number of employees as a proxy variable for firm size (Beyer et al., 2011).
Leverage
The financial leverage of a company is calculated through dividing the current and non-current liabilities by equity. Literature has found a positive connection between financial leverage and performance, because debtholders will assume a monitoring role, increasing the effectiveness of a firm’s management (Easterbrook, 1984; Jensen, 1986). Nevertheless, highly leveraged companies tend to cut R&D expenditure to cover their debt, which may also have a negative impact on firm performance (Hansen, 1991).
Ownership Structure Measures Ownership Identity Ownership Concentration Family State Institutional Corporate
23
Industry and Region
Similar studies have demonstrated the importance of distinguishing different industries and nations (Thomsen & Pedersen, 2000; Claessens et al., 2002). Firm performance tends to vary by industry, due to differences concerning the intensity of competition and importance of intangible assets (Pedersen & Thomsen, 2003). The SIC codes will be used to differentiate the different type of industries. In order to simplify the analysis, similar industries were merged together. Hence, five different industries were considered, namely: wholesale and retail, services, construction, primary sector and manufacturing. Besides, corporate performance may differ due to nation effects related to macroeconomic variables (Pedersen & Thomsen, 2003). Consequently, companies were allocated to four different Continental Europe regions: Northern Europe, Western Europe, Eastern Europe, and Southern Europe.
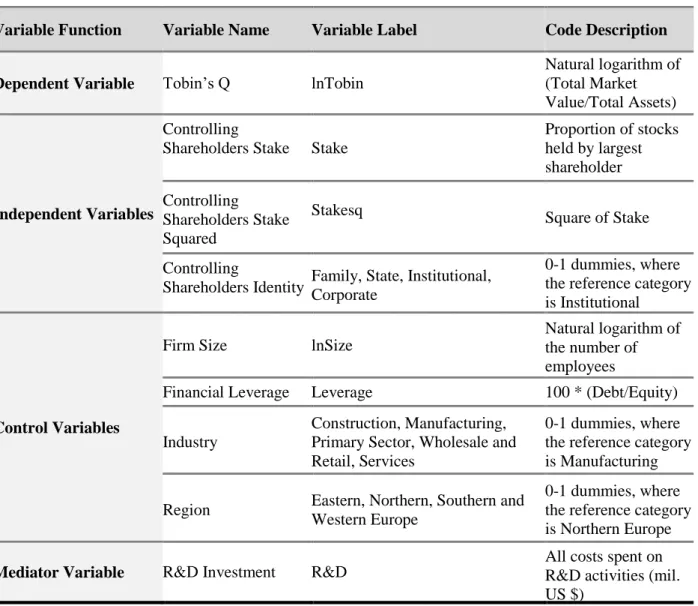
Table 2 summarizes the variables and their codes, as described in the previous section.
Variable Function Variable Name Variable Label Code Description
Dependent Variable Tobin’s Q lnTobin
Natural logarithm of (Total Market Value/Total Assets)
Independent Variables
Controlling
Shareholders Stake Stake
Proportion of stocks held by largest shareholder Controlling Shareholders Stake Squared
Stakesq Square of Stake
Controlling
Shareholders Identity Family, State, Institutional, Corporate
0-1 dummies, where the reference category is Institutional
Control Variables
Firm Size lnSize
Natural logarithm of the number of employees
Financial Leverage Leverage 100 * (Debt/Equity)
Industry
Construction, Manufacturing, Primary Sector, Wholesale and Retail, Services
0-1 dummies, where the reference category is Manufacturing
Region Eastern, Northern, Southern and
Western Europe
0-1 dummies, where the reference category is Northern Europe
Mediator Variable R&D Investment R&D
All costs spent on R&D activities (mil. US $)
24 3.4 Analytical Strategy
This study makes use of several different statistical procedures. Initially, univariate descriptive analysis and bivariate Pearson correlations were used to further explore the data. Furthermore, multivariate linear regressions (using the OLS method) were performed to understand the relationship between ownership structure and firm performance and Baron and Kenny’s (1986) mediation model was used to analyse if R&D investment mediates the relationship between ownership structure and firm performance. Lastly, additional multivariate linear regressions were considered to understand if ownership concentration contributes more to firm performance across different regions.
Having introduced the various methodologies and techniques this study makes use of, the economic specifications of each multivariate linear regression model needed to evaluate the proposed hypothesis will be further explained.
Initially, one regression equation is used to analyse how the control variables are related with firm performance, as follows:
Equation 1: lnTobini = 1 + β2 lnSizei+ β3 Leveragei+ β4 Easterni+ β5 Southerni + β6 Westerni
+ β7 Constructioni + β8 PrimarySectori + β9 RetailandWholesalei + β10 Servicesi + ɛi ,
i=1,…,749
where lnTobini stands for the logarithm of the Tobin’s Q Ratio; Leveragei refers to the
Debt to Equity ratio of a given company; lnSizei is the logarithm of the number of
employees of the company; Easterni, Southerni and Westerni are the dummy variables defining the region of Continental Europe of a certain company, with Northern European companies considered as the reference region category; Constuction, Primary Sector,
Retail and Wholesale and Services are the dummy variables defining industry, being
Manufacturing the reference category; ɛi are the error terms associated with these
regressions.
Secondly, an extended version of the previous equation was tested, to search for evidence on H1, H2, H3a, H3b, H3c, and H3d. With the purpose of understanding the impact the stake held by the controlling owners has on firm performance and the link between the identity of the controlling owner and firm performance, this study estimates the following equation:
Equation 2: lnTobin= 1+ β2 Stakei+ β3 Stakei2+ β4 Corporatei+ β5 Familyi+ β6 Statei+ β7
lnSizei+ β8 Leveragei+ β9 Easterni+ β10 Southerni + β11 Westerni + β12 Constructioni + β13
25 where Stakei, stands for the stake held by controlling owners and Stakei2 is the square of
the stake held by controlling owners; Corporatei, Familyi and Statei are dummy variables
that stand for corporate, family and state ownership, respectively, leaving Institutional as the reference category.
The mediation effects of R&D investment, which refers to H4a and H4b, is tested using Baron and Kenny’s (1986) mediation model. These authors refer three conditions for a variable to be considered a mediator. First, there needs to be a significant effect between the independent variable and the dependent variable. Second, the mediating variable needs to relate significantly to the dependent variable. Third, the mediating variable needs to relate significantly to the independent variable. The control variables were disregarded for both mediation models since this was the interpretation made of Baron and Kenny’s (1986) procedures. The conditions proposed by Baron and Kenny (1986) were assessed using six additional regression analyses:
Equation 3: R&Di= i1+ a Stakei+ ɛi , i=1,…,749
Equation 4: lnTobin= i2+ c’ Stakei+ b R&Di + ɛi , i=1,…,749
Equation 5: lnTobin= i3 + c Stakei+ ɛi , i=1,…,749
Equation 6: R&Di= i1+ a1 Corporatei+ a2 Familyi+ a3 Statei+ ɛi , i=1,…,749
Equation 7: lnTobin= i2+ c1’ Corporatei + c2’ Familyi+ + c3’ Statei+ b R&Di + ɛi, i=1,…,749
Equation 8: lnTobin= i3 + c1Corporatei+ + c2Familyi+ c3Statei + ɛi , i=1,…,749
where R&Di represents all the costs that relate to the development of new products and
services.
To evaluate H5 and statistically compare the impact of ownership concentration on firm performance among different regions, the subsequent equation was formulated:
Equation 9: lnTobini= 1+ 2 STAKENorthi + 3 STAKESouthi + β4 Corporatei+ β5 Familyi+
β6 Statei+ β7 lnSizei+ β8 Leveragei+ β9 Easterni+ β10 Southerni + β11 Westerni + β12
Constructioni + β13 PrimarySectori+ β14 RetailandWholesalei + β15 Servicesi+i i=1,...,303 where STAKENorthi and STAKESouthi are the ownership concentration in Northern
26 4 Results
This chapter explores the empirical results obtained. Therefore, it presents (i) descriptive statistics regarding the sampled companies; (ii) a validation of the statistical assumptions; and (iii) the correlations and regression analysis from the OLS regressions outlined above.
4.1 Descriptive Statistics 4.1.1 Sample Characteristics
The sample consists of 749 Continental European companies. The companies included in this study diverge in terms of region, identity, and industry (Appendix II). Western European firms represent the largest segment among the sample firms (43,3%), followed by Northern European (17,4%), Southern European (23,1%) and Eastern European (16,3%) companies. Furthermore, family ownership (36,4%) and corporate ownership (27,8%) are the predominant owner identities and manufacturing (40,7%) and services (43,8%) the most frequent industry among the firms studied.
Descriptive statistics for all scale variables used in this analysis are presented in Table 3. As elaborated in the methodology section, firm performance is measured by Tobin’s Q. Tobin’s Q for firms included in the sample ranges from 0,22 to 11,28 with an average of 1,31. Comparing the average of the firm performance indicators to findings in related studies shows that the sample is in line with prior research (Demsetz & Villalonga, 2001; Morck et al., 1988). Nevertheless, the slightly higher mean firm performance indicator that this study reveals can be explained due to the sample being characterized exclusively by companies with a stock capitalization of $200M or more, since this value influences the total market value of a company. On the other hand, the ownership concentration level of the firms studied is high. The mean of this variable is 52,93% with a standard deviation of 19,76%. Furthermore, the sample summary statistics reveal more interesting findings regarding the control variables considered. On average, the firms studied have 35.362 employees and spent $64,56M on R&D expenditures during the year considered. The descriptives also reveal that the mean financial leverage is 245,67%, indicating that the companies considered have been heavily taking on debt and thus have high risk.
Table 2 also shows that some of the variables are characterized by high skewness
(measure of the asymmetry of the probability function) and kurtosis (measure of the “tailedness” of the probability function) values, indicating a non-normal distribution of these variables. This will be discussed further in chapter 4.1.2.
27
N Minimum Maximum Mean Std. Deviation Skewness Kurtosis
Statistic Statistic Statistic Statistic Statistic Statistic Std. Error Statistic Std. Error
Stake 749 ,00 100,00 52,9331 19,76397 ,240 ,089 -,468 ,178 R&D 749 ,00 5874,00 64,5615 354,82673 10,836 ,089 141,378 ,178 Tobin's Q 749 ,22 11,28 1,3073 ,97935 4,758 ,089 32,993 ,178 Size 749 18 440809 13223,26 35361,988 6,743 ,089 57,814 ,178 Leverage 749 -123,0000 73,0000 2,456668 7,6765745 -6,058 ,089 119,650 ,178 lnSize 749 2,89 13,00 8,0949 1,72340 -,118 ,089 ,089 ,178 lnTobin’s Q 749 -1,51 2,42 ,1199 ,49928 ,820 ,089 2,221 ,178 Valid N 749
Table 3: Descriptive Statistics of the Scale Variables
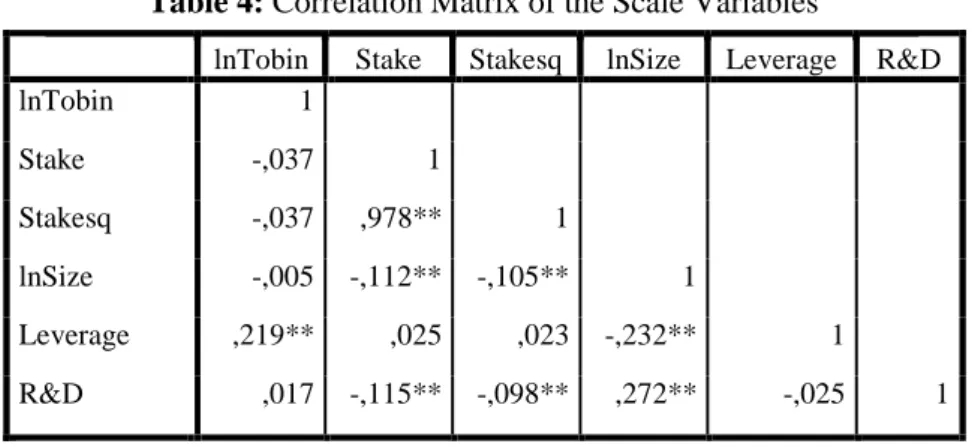
Table 4 shows the Pearson correlations, indicating the direction and strength of linear
relationships between all variables included in this sample. The correlation matrix reveals that some of the variables are correlated with each other. Particularly, Leverage is correlated with lnTobin at 0,219 (p<0,01). There is a strong and significant negative correlation between Stake and R&D (p<0,05), suggesting that companies spend less in R&D expenditures when ownership is concentrated. The natural logarithm of firm size is negatively correlated with Leverage (p<0,01) and positively related with R&D (p<0,01). This indicates that larger firms rely less on debt and allocate more capital to R&D activities. Despite these correlations, multicollinearity should not be of concern, as discussed further in chapter 4.1.2.
4.1.2 Checking Statistical Assumptions
To apply the analytical strategy mentioned previously, assumptions of the original sample data must be validated. These assumptions are those that are usually associated with
Table 4: Correlation Matrix of the Scale Variables
lnTobin Stake Stakesq lnSize Leverage R&D
lnTobin 1 Stake -,037 1 Stakesq -,037 ,978** 1 lnSize -,005 -,112** -,105** 1 Leverage ,219** ,025 ,023 -,232** 1 R&D ,017 -,115** -,098** ,272** -,025 1
**. Correlation is significant at the 0.01 level (2-tailed) *. Correlation is significant at the 0.05 level (2-tailed)
28 regression models: normal distributed errors, collinearity, linearity of parameters, homoscedasticity and independence of errors (West, 2009).
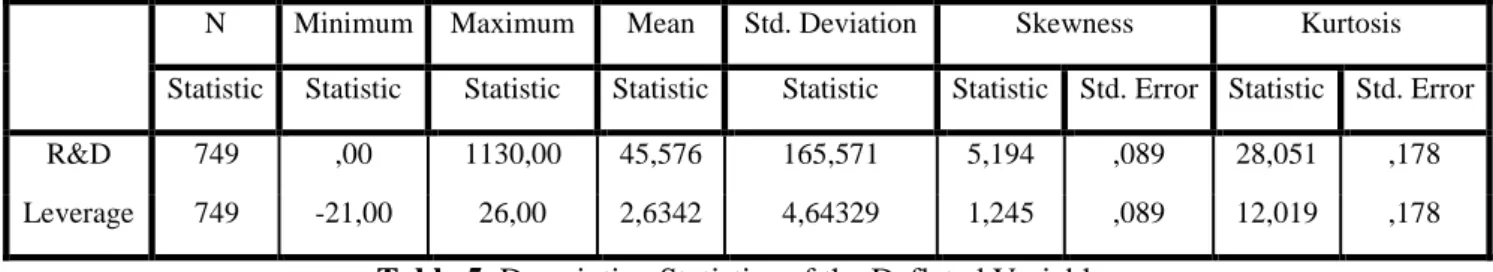
First, ensuring that the sample follows a normal distribution is important to achieve unbiased regression estimates. As illustrated in Table 3 the skewness and kurtosis of some variables indicate that these do not follow a normal distribution. To transform these variables to normality, Tobin’s Q has been subject to a logarithmic transformation, due to this variable being positively skewered, as suggested by Tabachinick and Fidell (2001). Additionally, since R&D and Leverage assume values that are negative or equal to zero, they have been deflated using a technique proposed by Field (2009). This author suggested to substitute the outlier by the value of the next highest/lowest observation, while adding/subtracting one unit. The descriptive statistics of the final deflated variables are shown on Table 5.
Table 5: Descriptive Statistics of the Deflated Variables
Further, multicollinearity occurs when two or more variables in a multiple regression model are highly correlated and therefore do not add explanatory power to the model (Brooks, 2008). Although some of the variables of this study are highly correlated, in an additional analysis by means of the variance inflation factor (VIF), none of these variables exceeds the limit VIF value of 10 which would indicate multicollinearity (Field, 2009), as illustrated by Appendix III. Consequently, any existing multicollinearity poses minimal risk in the accuracy of the model estimates.
Additional required assumptions to conduct multiple linear regressions are the independence of residuals and homoscedasticity. To back this up, the Modified White test as well as the Durbin Watson test were applied (Appendix IV). As the test-statistic of the Durbin Watson test was under the suggested d=2 for all models, there seems to be no autocorrelation. The assumption of homoscedasticity is further proven by a non-significant result in the Modified White test, indicating that the standard errors are robust. This means that the standard deviations of the error terms are constant and independent.
N Minimum Maximum Mean Std. Deviation Skewness Kurtosis
Statistic Statistic Statistic Statistic Statistic Statistic Std. Error Statistic Std. Error
R&D 749 ,00 1130,00 45,576 165,571 5,194 ,089 28,051 ,178
29 4.2 Empirical Results
The empirical regression results are presented in Table 6 and are discussed in the following.
Table 6: Regression Results (DV = lnTobin)
Model 1 Model 2 Variables Regression Coefficient Regression Coefficient
Stake -0.008* (0.004) Stakesq 0.00006396** (0.000034) Corporate -0.100* (0.049) Family -0.025 (0.047) State -0.210*** (0.058) lnSize -0.012 (0.010) -0.003 (0.011) Leverage -0.008** (0.004) -0.008** (0.004) Eastern -0.146** (0.056) -0.099* (0.060) Southern 0.307*** (0.052) 0.327*** (0.054) Western 0.469*** (0.047) 0.483*** (0.048) Construction -0.133 (0.082) -0.171** (0.083) Primary Sector -0.014 (0.084) 0.002 (0.085) Retail and Wholesale -0.057
(0.068) -0.079 (0.069) Services -0.027 (0.036) 0.012 (0.039) R&D -0.00004896 (0.000107) Constant 0.013 (0.087) 0.185 (0.137) N Firms 749 749 R2 0.239 0.258 Adjusted R2 0.230 0.243
Standard errors in parentheses * p < .10, ** p < .05, *** p < .01
30 4.2.1 Control Variables and Firm Performance
Model 1 includes the market-based firm performance indicator, lnTobin, as well as all
control variables. The R2 of this model is 0.239, indicating that the variables in this model
explain 23,9% of the variance in lnTobin. While the association between the indicator of firm performance and lnSize is non-significant (b=-0.012, p>0.10), firm performance is significantly negatively related to the firms’ leverage (b=-0.008, p<0.05). Compared to Northern European companies, the reference category for region, Eastern European companies showed a lower firm performance (b=-0.146, p<0.05). Differing, Southern and Western European companies showed a significantly higher firm performance indicated by lnTobin (Southern European companies: b=0.307, p<0.01; Western European companies: b=0.469, p<0.01). Results for the dummy coded industry variable showed that the investigated industries (construction, primary sector, retail and wholesale, and services) did not differ significantly from the reference category which is manufacturing.
4.2.2 Ownership Structure and Firm Performance
Model 2 explains the impact of ownership concentration on firm performance. The
regression coefficient Stake is significant and negative for lnTobin (b=-0.008, p<0,1). Since this is a quadratic model, the regression coefficient of the variable Stake has no economic interpretation when isolated. The regression coefficient for the quadratic term
Stakesq is positive and significant (c=0.00006, p<0,05). This result demonstrates that the
share of the controlling shareholder has a U-shaped relationship with firm performance, unlike predicted by H2 (Appendix V). This indicates that when ownership concentration increases, on average, 1%, for an ownership concentration up to 62.54% Tobin´s Q decreases but for values above 62.54% it increases. Thus, this model does not provide support for H1 and H2, which are both rejected.
This model also enters dummy coded variables related to ownership identity into the regression model. Family ownership has a positive but insignificant impact on Tobin’s Q
(b1+bFamily=0,16). Thus, H3a is not supported. The association between state ownership
and firm performance is negative and significant (b1+bState =-0,25; p<0,01). This finding
provides evidence for H3b. Corporate ownership is positive and significantly associated to Tobin’s Q (b1+bCorporate=0,085; p<0,1), as assumed by H3c. Institutional ownership,
which is the reference category for the identity variable, has no significant impact on firm performance, although this influence is positive, as predicted (b1=0,185; p<0,1).
31 Therefore, H3d is rejected. Based on these findings, this study concludes that a firm’s owner identity explains a significant variation in firm performance.
4.2.3 Mediating role of R&D
The mediating effect of R&D in the relationship between ownership structure and firm performance is investigated by computing a set of regression analyses, as suggested by Baron and Kenny (1986). In addition, this study uses an indirect mediation test (Preacher & Hayes, 2004).
4.2.3.1 Ownership Concentration
The mediation model presented in Figure 4 will be used to assess if R&D investment mediates the relationship between stake ownership and firm performance.
Figure 4: Mediation Model for H4a
Source: Own Elaboration
Results of the three regression models suggested by Baron and Kenny are presented in
Table 7. There is a significant negative association between the independent variable
Stake and the mediating variable R&D (a=-0.843, p<0.10). The relationship between the
mediator and the dependent variable is also negative and significant (b=-0.0004, p<0.01). The total effect, which measures the impact of the independent variable Stake on lnTobin, revealed a significant positive relationship (c=0.001, p<0.05) and the overall indirect effect, which refers to the effect of R&D on lnTobin, demonstrated a significant association (b=-0.0004, p<0.01). Thus, this model meets the criteria for mediation (Baron and Kenny, 1986).
Table 7: Results of the Mediation Analysis (H4a) DV IV Regression Coefficient Model 3 R&D Stake a=-0.843*
(0.468) Model 4 lnTobin Stake R&D c’=0.001055** (0.001) b=-0.000409*** (0.00001)
Model 5 lnTobin Stake c=0.001400**
(0.001) Standard errors in parentheses
* p < .10, ** p < .05, *** p < .01 Stake c Stake a R&D lnTobin b lnTobin c’
32 In addition, to test the true indirect effect, the output with the indirect mediation test, which provides the 95% bootstrapped confidence interval levels, will be assessed. The bootstrapping technique is a way to overcome some limitations that have been appointed to Baron and Kenny’s (1986) model. In this case, the bootstrapped confidence interval is from 0,000318 to 0,002465 (Appendix VI). Since this interval does not include the zero value, one can conclude that R&D mediates the relationship between ownership concentration and firm performance. The regression coefficients reveal that the stake of the controlling shareholder has a negative influence on R&D investment, which in turn has a negative effect on firm performance. Accordingly, H4a is supported.
4.2.3.1 Ownership Identity
To evaluate the mediating role of R&D investment in the relationship between ownership identity and firm performance another set of regression analyses were conducted. The mediation model is presented in Figure 5.
Figure 5: Mediation Model for H4b
Source: Own Elaboration
The results of the regression analyses can be seen on Table 8. Initially, the association between the dummy-coded independent variable ownership identity and the mediating variable R&D was determined. State and institutional were the only ownership identities to have a significant impact on R&D. The regression model predicting firm performance by ownership identity reveals a significant and positive coefficient for family owned companies (c2= 0.126, p<0.05) and a significant and negative coefficient for state owned companies (c3=-0.167, p<0.01). Nevertheless, the indirect effect, which refers to the impact of R&D on lnTobin, was not significant. Consequently, this model does not meet the criteria for mediation (Baron and Kenny, 1986). Therefore, H4b is rejected.
Corporate Family State a1 a2 a3 b c1 c2 c3 c1’ c2’ c3’ lnTobin R&D lnTobin Corporate Family State
33
Table 8: Results of the Mediation Analysis (H4b) DV IV Regression Coefficient Model 6 R&D Corporate Family State Institutional (intercept) a1=-12,80 (17,531) a2=14,864 (16,627) a3=58,071*** (20,255) 34,719*** (13,326) Model 7 lnTobin Corporate Family State Institutional (intercept) c1=-0,029 (0,052) c2=0,126** (0,050) c3=-0,167*** (0,060) 0,108 (0,040) Model 8 lnTobin Corporate Family State Institutional (intercept) R&D c1’=-0,029 (0,052) c2’=0,125** (0,050) c3’=-0,170*** (0,061) 0,107*** (0,040) b=0,00004259 (0,000109) Standard errors in parentheses
* p < .10, ** p < .05, *** p < .01
4.2.4 Variations across Regions
As illustrated by Table 9, the mean stake of controlling shareholders for Southern European companies is 56.22%, whilst this value is 43.29% for Northern European companies. Thus, the stake of controlling owners is higher in Southern European firms than in Northern European companies, as predicted previously.
Table 9: Descriptive Statistics of Ownership Concentration by Region Region N Proportion (SD)
Northern Europe 130 43.29 (18.86) Southern Europe 173 56.22 (17.10) N – Sample Size, SD – Standard Deviation
There is a moderate correlation between lnTobin and the controlling shareholders stake in Northern and Southern European firms, as presented in Table 10. However, whilst this