The Influence of the Ownership and Control Structure on Corporate
Market Value in Brazil
Daniel Ferreira Caixe
Masters degree from the Department of Business Administration at the University Center of the Coc Institute of Higher Education E-mail: [email protected]
Elizabeth Krauter
Ph.D., Department of Business Administration at the Ribeirão Preto School of Economics, Administration, and Accounting of the University of São Paulo E-mail: [email protected]
Received on 1.4.2013 – Accepted on 3.14.2013 – 2nd version accepted on 5.22.2013
ABSTRACT
The Brazilian model of corporate governance is characterized by a highly concentrated ownership structure, which usually culminates in an overlap between ownership and management. According to the literature, the accumulation of shares by the controller(s) can affect corporate performance due to both the alignment (or incentive) effect and the entrenchment effect. At first, the presence of large sha-reholders is associated with benefits for an organization because it increases the effectiveness of management monitoring. However, very high levels of ownership concentration can allow controllers to dominate the corporation’s decision-making process, which could result in the expropriation of wealth from minority shareholders. The relevance of the ownership structure as an internal mechanism of corpo-rate governance motivates the present study. This article aims to test whether ownership and control concentration influences corpocorpo-rate market value. An unbalanced panel was used for the period from 2001 to 2010, composed of 237 Brazilian non-financial publicly traded companies, totaling 1,199 observations. Dynamic regression models were used, estimated by the System Generalized Method of Moments (Sys-GMM), to mitigate possible sources of endogeneity, such as the omission of variables, the feedback effect, and the simultaneity. A quadratic relationship was found between cash flow rights of the largest shareholder and firm market value. Moreover, the results indicate that the corrected market value of the total shares held by the largest shareholder captured the incentive effect, while voting rights concen-tration captured the entrenchment effect.
1 INTRODUCTION
The relevance of the conflict of interest between owners and managers, especially in relation to the likely conse-quences for firm performance, is reflected in agency the-ory. This theory is based on assumptions such as the absen-ce of complete contracts and the opportunism of economic agents to justify the appearance of agency costs (Jensen & Meckling, 1976). These costs arise from attempts by the owner (the principal) to monitor the activities of the mana-ger (the agent) and create contractual incentives for him, as well as by certain practices of the manager to benefit him-self over the interests of the shareholders, such as focusing on the short term, insider trading, and resistance to actions that are beneficial to the shareholders, including liquida-tions, divisions, and mergers (Jensen & Meckling, 1976; Stulz, 1988; Andrade & Rossetti, 2006).
In Brazil, the ownership and control structure of compa-nies is marked by its high concentration, reached through corporate pyramids, cross shareholdings, shareholder agre-ements, and shares without voting rights (Gorga, 2008). In this situation, agency costs mainly arise from conflicts of interest between controlling and minority shareholders, which may result in the expropriation of the wealth of the latter by the former (Claessens, Djankov, & Lang, 2000; Lins, 2003).
National (Carvalhal-da-Silva & Leal, 2003; Silveira, La-zana, Barros, & Famá, 2004; Okimura, Silveira, & Rocha, 2007) and international (Demsetz & Villalonga, 2001; Cla-essens, Djankov, Fan, & Lang, 2002; Fahlenbrach & Stulz, 2009; Azofra & Santamaría, 2011) empirical studies have tested the existence of a relationship between ownership structure and corporate performance. These studies are ge-nerally differentiated by their approaches, and they present divergent results that lead to different interpretations.
The results of studies such as those by Claessens,
Djankov, Fan, and Lang (2002), Gugler, Mueller, and Yur-toglu (2008), Fahlenbrach and Stulz (2009) and Gárcia-Meca and Sánchez-Ballesta (2011) suggest that there is a relationship between ownership structure and corporate performance. However, other studies, such as those by De-msetz and Lehn (1985), Himmelberg, Hubbard, and Palia (1999) and Demsetz and Villalonga (2001), conclude that the ownership and control structure is an endogenous va-riable that is determined by corporate characteristics and does not influence company performance.
This article seeks to study whether the ownership and control structure influences corporate market value. This study is different from other studies on the ownership structure in Brazil in two ways. The first refers to the use of dynamic models of multiple linear regression that are estimated by the System Generalized Method of Moments (Sys-GMM) in a ten-year panel to try to control possible sources of endogeneity. The second corresponds to the use of the corrected market value of the total shares held by the largest shareholder (LnVPROP1) to capture the alignment effect. This variable was adapted from Gugler et al. (2008) according to characteristics of the Brazilian corporate go-vernance model. The previous national studies, in addition to not testing the variable LnVPROP1, did not use as long of a temporal window and did not try to mitigate the feed-back effect through dynamic models.
This study is structured in five sections, including the introduction. Section 2 refers to the study’s theoretical foundation, which focuses on the relationship between ow-nership structure and firm performance as well as on the econometric problems faced by researchers studying this subject. The methods used are described in Section 3. The results and conclusions of the study are listed in Sections 4 and 5, respectively.
2 THEORETICAL FOUNDATION
Since the findings by Berle and Means (1932) about the separation between ownership and management in large corporations in the United States, different stu-dies have analyzed the conflict of interests between managers and shareholders to try to capture its likely impact on firm performance. Most of the early empiri-cal studies analyzed the insider ownership structure of the companies, mainly the directors’ and officers’ sha-reholdings (managerial ownership), and focused on the incentive (or alignment) effect and the entrenchment effect as constructed by Jensen and Meckling (1976), Morck, Shleifer, and Vishny (1988), Stulz (1988), among others.
However, studies such as those by La Porta, Lopez-de-Silanes, and Shleifer (1999), Claessens, Djankov, and Lang (2000), and Lins (2003) show that widely dispersed ownership is a characteristic only of the Anglo-Saxon model. The study by La Porta et al. (1999), whose sample included 691 companies from the 27 richest countries in
the world (based on per capita income from 1993), sho-wed evidence of the predominance of high ownership concentration in companies that are generally under the control of families and the State. Claessens et al. (2000) found that more than two-thirds of 2,980 firms from nine countries in East Asia, which composed the study’s sample, are controlled by one shareholder. Finally, in a sample of 1,433 companies from 18 developing coun-tries (including 59 Brazilian companies), Lins (2003) showed that 69% of the organizations had at least one controlling block that operated in the management of the companies.
en-trenchment effects of the ownership and control struc-ture on firm value still exist. However, these effects are linked to the ultimate shareholder’s or the controlling block's participation in share capital, as explained by Claessens and Fan (2002) and Andrade and Rossetti (2006):
1. Alignment (or incentive) effect: ownership concentra-tion has a positive impact on corporate performance through the likely decrease in agency costs. This reduc-tion is tied to the possibility of the controllers efficiently monitoring the management, in the sense of balancing the interests of shareholders and managers. Therefore, if the controllers seek private benefits of control by adop-ting practices such as insider trading and self-nomina-tions for posts on the board of directors, the minority shareholders can price the company’s stock at a certain discount, decreasing the large shareholders’ wealth. In this manner, a rise in ownership concentration could increase corporate market value because it signals to investors a satisfactory solution for agency costs due to the greater alignment of interests between the managers and the shareholders.
2. Entrenchment effect: after a certain range of owner-ship and control concentration, as the participation of large shareholders in ownership and control incre-ases, the board of directors and the market for hostile takeovers lose ground to the power exercised by the controlling block. A high concentration in control structure can allow controlling shareholders, due to their dominance over the decision-making process, to expropriate wealth from minority shareholders through practices such as excessive salaries or other self-conceded benefits and resistance to beneficial actions for the other shareholders, including liquida-tions, divisions, and mergers. Therefore, after a cer-tain percentage of concentration in the control struc-ture and as the concentration increases, agency costs increase and firm value decreases.
2.1 Empirical Studies and Econometric
Problems
In empirical studies on the relationship between the ownership and control structure and corporate perfor-mance, researchers encounter different econometric problems that, if not addressed, can result in erroneous inferences on the relationship between the variables. Considering the multiple regression technique, which is the most frequently used technique by researchers working on the subject, three sources of endogeneity must be highlighted that could derail the studies’ results: the omission of variables, the feedback effect, and the reverse causality (“simultaneous determination”) (Börs-ch-Supan & Köke, 2002; Barros, Castro Júnior, Silveira, & Bergmann, 2010). Technically, as explained by Bar-ros, Castro Júnior, Silveira, and Bergmann (2010), the “assumption of exogeneity of the regressors” in the re-gression model excludes the possibility of correlation
between the explanatory variables and the random error term. If this assumption is invalid, the regressors are en-dogenous and should mitigate endogeneity; otherwise, the parameters will be biased.
According to Börsch-Supan and Köke (2002), the omission of variables that are relevant to the estimated model occurs for two reasons: the non-availability of data on potentially important variables for corporate go-vernance studies, and lack of knowledge about the type of function that explains the relationship between the variables. Silveira (2010) noted that the omission of va-riables can result in a spurious correlation between varia-bles of interest, also known as the fallacy of the common cause. The use of control variables and the procedures of Random and Fixed Effects, as in the studies by Claessens et al. (2002) and Fahlenbrach and Stulz (2009), are a way to combat the problem.
Claessens et al. (2002) analyzed the impact of the partici-pation of the largest shareholder in ownership and control on corporate market value. By employing regressions with Ran-dom Effects on a sample of 1,301 companies from eight diffe-rent countries in East Asia, the authors found evidence that ownership concentration and control concentration influen-ced Tobin’s Q positively and negatively, respectively. Thus, the conclusions from the study suggested that the incentive and entrenchment effects can be captured through proxies linked to cash flow and voting rights in organizations.
Fahlenbrach and Stulz (2009) investigated the pos-sible determinants of insider ownership and its impact on the market value of 4,900 companies in the United States for the period from 1988 to 2003. The authors applied probit models and linear regressions, both with Fixed Effects. The results indicated that good stock performance generally decreases managerial owner-ship, and an increase in shares held by managers ten-ds to increase Tobin’s Q. However, a large reduction in managerial ownership did not result in a decline in firm market value.
The feedback effect, or feedback loop of the respon-se variable to the regressors, is another source of endo-geneity in corporate finance studies (Wintoki, Linck, & Netter, 2012). This effect emerges when the past values of the dependent variables influence the contempora-ry and/or future values of the independent variables (Barros, Castro Júnior, Silveira, & Bergmann, 2010). The inclusion of lags for the dependent variable in the regression model and the use of the Generalized Me-thod of Moments (GMM), as performed by Gugler et al. (2008) and Azofra and Santamaría (2011), is a way of mitigating this problem.
Squares (OLS) and the GMM, which led to the follo-wing conclusions: the market value of the shares held by directors and officers captured the alignment effect, because it also positively influenced Tobin’s Q and the ratio of firm's return on investment to its cost of capital; in addition, managerial shareholdings showed a negati-ve relationship with both indicators, thus capturing the entrenchment effect.
Azofra and Santamaría (2011) investigated the re-lationship between ownership structure and the cor-porate performance of 80 Spanish banks between 1996 and 2004. The results of the study’s regression models, estimated by the GMM, indicated that the greater the separation between the largest shareholder’s cash flow and voting rights, the smaller the company’s return on assets, and when there is no divorce between ownership and control, the relationship between the controlling shareholder’s shareholding and the bank’s profitability is not monotonic.
Finally, the simultaneous determination of variables can also skew the parameters of the estimated models. According to Börsch-Supan and Köke (2002), the direc-tion of causality between the ownership structure and company performance is not clear. A higher owner-ship concentration can increase firm value due to more efficient monitoring of the management, avoiding the expropriation of shareholder wealth by the managers. However, well-performing firms could attract new in-vestors and consequently change the company’s owner-ship structure.
Simultaneity can be mitigated with several
instru-ments, as shown in the studies by Drakos and Bekiris (2010) and García-Meca and Sánchez-Ballesta (2011). However, it is very difficult to find a set of valid ins-truments. Although the first assumption (the signifi-cant correlation between the instruments and the en-dogenous regressor) can be easily verified, the second (the lack of correlation between the instruments and the model’s error term) is not easily verifiable because the error term is not directly observable (Barros et al., 2010).
Drakos and Bekiris (2010) studied the impact of ow-nership structure on the market value of 146 companies listed on the Athens Stock Exchange from 2000 to 2004. When regressions estimated by Two Stage Least Squares (2SLS) and Three Stage Least Squares (3SLS) were used, the authors found that inside directors’ shareholdings (members of the Executive Board) and the accumulation of shares by investors who owned more than 1% of the shares and who did not participate in senior management positively influenced Tobin’s Q.
García-Meca and Sánchez-Ballesta (2011) applied piecewise OLS regressions and 2SLS regressions with Random Effects in a non-balanced panel composed of 76 Spanish companies for the period from 1999-2002. The results generally pointed to the existence of a qua-dratic relationship between large shareholders’ sha-reholding (who owned more than 5% of the shares) and Tobin’s Q. An increased in ownership concentration increased the corporate market value up to 60% accu-mulation of the shares, and the market value decreased after that point.
MVCS + MVPS + BVOL Total Assets
Table 1 Theoretical and operational deinitions of the variables for market value
VARIABLES JUSTIFICATION
According to Chung and Pruitt (1994, p. 72), Tobin’s Q (QTOBIN) can be calculated as follows:
QTOBIN =
where
MVCS: Market Value of Common Stock; MVPS: Market Value of Preferred Stock; BVOL: Book Value of Outstanding Liabilities (Current + Non-current) minus Current Assets after excluding stock.
Among the various deinitions of the concept of corporate market value,
Tobin´s Q was chosen because it has been used in many of the studies on ownership structure and therefore allows direct comparison of the results of this study with other works. Because the calculation of Tobin´s
Q is dificult to operationalize, due to the absence of direct observations
of the market value of debt and the replacement value of assets, the approximation proposed by Chung and Pruitt (1994) was chosen, which
was also used by Silveira, Lazana, Barros, and Famá (2004), Okimura,
Silveira, and Rocha (2007), among others.
Enterprise Value over Total Assets (EV) calculated by the following equation:
EV =
(*) Enterprise value = Price*Total Shares + ST (Short Term) and LT (Long Term) Debentures + ST and LT Loans + Advances on Exchange Contracts –
Cash and Short Term Investments. Calculated by Economática®.
EV is an increasingly common indicator to measure company value. It represents an alternative to Tobin´s Q. There is no consensus on the metrics that should be used as a proxy for performance. Börsch-Supan and Köke (2002) suggested using more than one proxy for performance to mitigate this problem.
Enterprise Value* Total Assets
3 METHOD
Table 2 Theoretical and operational deinitions of the variables for corporate structure
VARIABLES JUSTIFICATION
PROP1: percentage of total shares held by the largest shareholder.
This variable is tied to the irm´s ownership structure and indicates the concentration of cash low rights held by
the largest shareholder. It is expected that an increase in this concentration, ceteris paribus, increases the market
value of the company because it signals minimized agency costs to the market. The change in agency costs is based on the possibility that the controlling shareholder can eficiently monitor senior management (Claessens, Djankov, Fan, & Lang, 2002). Therefore, it is assumed that this variable can absorb the incentive effect.
LnVPROP1: natural logarithm of the
market value (in Brazilian reals) of all
shares owned by the largest sharehol-der, corrected by the General Index of Market Prices (Índice Geral de Preços do Mercado - IGP-M) for 2001.
The market value of the shares (adjusted for inlation) owned by the largest shareholder can more directly capture
the impact of the appreciation or depreciation of the stock prices on the largest shareholder’s wealth. The greater the value of LnVPROP1, the greater the loss for the largest shareholder as the securities become devalued. The-refore, the largest shareholder´s commitment to the price appreciation of its shares will be greater. In this regard, ceteris paribus, it is expected that an increase in LnVPROP1 will be relected in the organization´s increased
value, absorbing the incentive effect as suggested by Gugler, Mueller, and Yurtoglu (2008).
CON1: percentage of common shares held by the largest shareholder.
This variable is tied to the company´s control structure and represents the concentration of voting rights of the lar-gest shareholder. It is assumed that an increase in this concentration, ceteris paribus, will decrease the irm´s market
value because of the greater possibility of expropriation of wealth from minority shareholders given the high level
of control over the decision-making process exercised by the largest shareholder (Claessens, Djankov, Fan, & Lang, 2002; Claessens & Fan, 2002). Therefore, it is presumed that CON1 captures the entrenchment effect.
Table 3 Theoretical and operational deinitions of the control variables
VARIABLES JUSTIFICATION
Return on Equity (ROE): calculated by dividing Net Income by Average
Shareholders´ Equity, both measured in nominal Brazilian reals:
The company´s profitability can influence its market value because investors are faced with a trade-off between selling, buying, or
maintai-ning their stock and can prioritize securities from companies that offer more satisfactory accounting profits relative to other companies (Cho &
Pucik, 2005).
Size of Company (LnAT): natural logarithm of Average Total Assets, measured in nominal Brazilian reals.
According to Himmelberg, Hubbard, and Palia (1999), the relationship
be-tween a company´s size, ownership structure, and market value is unclear.
The larger the company, the greater the ratio of the company´s value in relation to the individual wealth of the controlling shareholder, making it
dificult for the controlling shareholder to maintain a high equity interest in the irm´s total capital. However, large corporations may be subject to
greater agency problems and consequently higher monitoring costs, which could result in a lower market value and a higher ownership concentration
to attempt to mitigate these problems (Silveira, Barros, & Famá, 2008).
Special Corporate Governance Stock Index (Índice de ações com Go-vernança Corporativa Diferenciada - IGC): binary variable with a value of 1 if the company participated in IGC during the year and a value of 0
(zero) if it did not participate.
The IGC was created by the Bovespa in June 2001 and includes almost all corporations listed on the New Market and Levels 1 and 2, except the companies whose shares are considered strictly liquid (Bolsa de Valores,
Mercadorias e Futuros de São Paulo - BM&FBovespa, 2001). The companies
that participate in these sectors must follow stricter standards for corporate governance. Thus, the binary variable IGC will be used as a proxy for the quality of the governance practices adopted by the company, which could
inluence market value as well as ownership structure (Klapper & Love, 2004; Black, Jang, & Kim, 2006).
Volatility of monthly returns for stock with the highest liquidity each year (VOLAT):
VOLAT =
where
Si: continuous monthly return of stock i; Sm : average continuous mon-thly return of stock i; n: equal to 12 (1 year).
According to Demsetz and Lehn (1985), variation in company stock prices
could be an indicator of the operational environment. In this sense, the more turbulent the environment, the greater the transaction costs associated with monitoring the management, and consequently the greater the potential
return generated by eficient control. It is expected that the greater the vola -tility of a company´s shares, ceteris paribus, the lower the concentration in the ownership structure because it is more expensive for large shareholders to own shares.
Debt (DEBT): measured by dividing Outstanding Liabilities (Current +
Non-Current) by Total Liabilities, measured in nominal Brazilian reals:
DEBT = × 100%
The relationship between a company´s amount of debt and its performan-ce is ambiguous. On one hand, a more indebted company has greater
inancial risk, which leads the market to apply a higher discount rate on the company’s securities, reducing the irm´s value (Braouezec, 2009). Howe
-ver, debt creates tax beneits because of the deductibility of interest on debt for inancial expenses, which could improve an organization´s performance (Modigliani & Miller, 1963).
Net Income Average Shareholders´ Equity ROE =
Σ (si - sm)2
n-1 √
Outstanding liabilities Total liabilities
VARIABLES JUSTIFICATION
Liquidity Index, calculated by the Economática® system for 12-month
periods based on the volume of cash trades (LIQ):
LIQ = 100 × × ×
where
p: number of days with at least one share trade in the period analyzed; P: total number of days in the period analyzed; n: number of share trades in the period analyzed; N: number of trades of all shares in the period analyzed; v: volume of money traded with shares in the period analyzed; V: volume of money traded with all shares in the period analyzed.
According to Uno and Kamiyama (2009), increased concentration in the
ow-nership and control structure of an organization could decrease its liquidity,
which could reduce its market value.
Type of controlling shareholder (TYPE): set of binary variables that
as-sign a value of 1 for a speciic type of controlling shareholder and 0 for
the others. Six binary variables are used, which were elaborated based
on the classiication used by Okimura, Silveira, and Rocha (2007) and Silveira, Barros, and Famá (2008):
Foreign private ownership (FP): when a foreign multinational or
◆
group of investors is the company´s largest shareholder;
State ownership (State): when the company´s largest shareholder is
◆
the State (union, states, or municipalities);
National private ownership (NP): when a domestic group of
inves-◆
tors is the company´s largest shareholder, except for the founding investors or heirs of the company;
Family owned (Family): when the founding family or a single
◆
investor is the company´s largest shareholder. In this case, controls exercised by foundations or holdings that represent the company´s founders or heirs are included;
Pension funds (PF): when a pension fund is the company´s largest
◆
shareholder;
Financial institutions (FI): when a inancial institution is the
◆
company´s largest shareholder.
The type of largest shareholder (private national, foreign, state, among
others) can inluence the ownership and control structure of an organiza
-tion. For example, a company under state control could be legally required to maintain a minimum concentration of ownership (Silveira, Barros, & Famá, 2008).
Annual dummies (D): dummy variables that assign a value of 1 for a
speciic year and 0 for others. The binary annual variables are codiied
in chronological order; that is, D01 = 2001, D02 = 2002, and so on.
The construction of dummies for each year in the sample aims to isolate any macroeconomic effects that may affect the set of companies (Okimura,
Silveira, & Rocha, 2007).
p P
n N
v V √ continued
To draw inferences on the relationship between ownership structure and corporate market value, this study used a non-balanced panel composed of 237 Bra-zilian non-financial publicly traded companies during the period from 2001 to 2010, totaling 1,1991 observa-tions (firm-year). The companies with negative equity were excluded because they would compromise the cal-culation of some indicators, such as Return on Equity (ROE).
The variables were collected based on secondary data from the Economática® information system. The accounting values refer to the financial statements from the fourth trimester of each year, and the share prices correspond to the average yearly price, calcula-ted by the average price on the last trading day of each trimester.
It is important to note that in the present study, when the largest shareholder´s shareholding in each company was analyzed, the indirect ownership and control structu-re structu-resulting from corporate pyramids was not considestructu-red. This is certainly the main limitation of this study. However,
the use of only a direct corporate structure is justified by the following arguments:
In the case where the largest shareholder is a company,
◆
the interest of all shareholders, although conlicting in diferent situations, is the same with regard to extrac-ting the maximum possible beneits from the company they control at the expense of minority shareholders (Silveira, Lazana, Barros, & Famá, 2004).
Carvalhal-da-Silva and Leal (2003) investigated the
◆
relationship between ownership structure and corpo-rate market value in Brazil. hey analyzed direct and indirect structures, and their results for the two types of structures were practically the same. However, the indirect structure variables showed more statistically signiicant p-values.
As observed by Leal, Carvalhal-da-Silva, and
Valada-◆
res (2002), the use of corporate pyramids as a way to maintain control at lower cost by separating ownership and control is not common in Brazil.
3.1 Concentration in Ownership Structure and
Corporate Market Value
This study seeks to contribute an answer to the follo-wing question: does ownership and control concentration influence market value of Brazilian publicly traded com-panies?
To this end, dynamic multiple linear regression models were tested based on Equation (1). They were estimated using the Sys-GMM through applying the xtabond2 tool in the Stata 11 statistical program (Roo-dman, 2006, 2009).
MVit = α + β1MVit-1 + β2(PROP1itor LnVPROP1it) + β3 (PROP1it2or CON1
it) + β4 ROEit
+ β5 LnATit + β6 IGCit + β7 VOLATit
+ β8 DEBTit+ β9 LIQit + ∑l=1δl TYPElit
+ ∑k=1ψkYRkt + ηi + uit 1
where α is the intercept, i and t represent the company and the year, respectively, and ηi + uit is the decompo-sition of the random error term (εit = ηi + uit). More specifically, uit is the error term of the ith firm in the
tth year, and η
i is the unobserved heterogeneity of the
companies in the sample, which captures any unobser-ved characteristics of firm i, that do not vary between periods.
9
5
As a proxy for corporate market value (MV), Tobin’s Q (QTOBIN) and the Enterprise Value over Total Assets (EV) were used. The following control variables were selected: first lag of corporate market value (VMit-1); profitability (ROE); firm size (LnAT); binary variable of participation in the Special Corporate Governance Sto-ck Index of the BM&FBovespa (IGC); volatility of stoSto-ck returns (VOLAT); debt (DEBT); stock liquidity (LIQ); and dummy variables for controlling shareholder type (TYPE). Binary variables for years were also added to isolate any macroeconomic effects (YR).
As for the independent variables of interest, proxies for the largest shareholder’s ownership concentration were used: PROP1, CON1, and LnVPROP1. These va-riables refer to cash flow rights, voting rights, and ma-rket value of total shares adjusted by IGP-M, respective-ly. Two types of models were tested. In the first model,
PROP1 and PROP12 (quadratic term) were tested at the
same time with the goal of capturing in sequence the in-centive effect and the entrenchment effect of ownership structure on company performance. In the second
mo-del, the variables PROP1 and PROP12 were replaced by
LnVPROP1 and CON1 to capture the positive and ne-gative impacts, respectively, of ownership concentration on corporate market value.
4 RESULTS
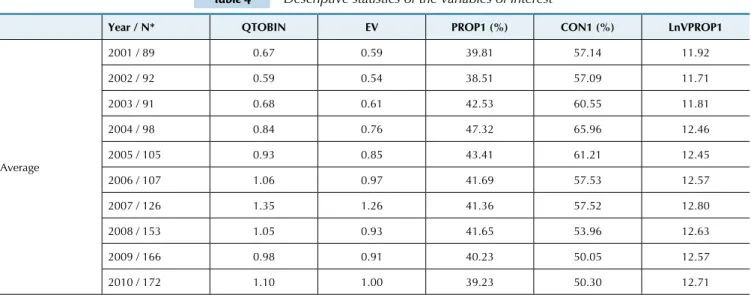
Table 4 contains the descriptive statistics of the va-riables used as proxies for ownership structure (PROP1, CON1, and LnVPROP1) and the market value of the or-ganizations (QTOBIN and EV). Tables 5 and 6 show the descriptive data for the study’s control variables.
The average concentration of votes for the largest shareholder is 56.18% in the total sample, indicating that, on average, the companies studied were under majority control from 2001 to 2010. Moreover,
concen-tration of cash flow rights had an average of 41.38% (to-tal sample). These statistics show that, on average, the largest shareholder held control of the company with under half its total capital. This indicates that Brazilian corporations generally raise funds in the BM&FBovespa without their largest shareholders losing control of the organization through issuing shares that do not confer voting rights to their owners.
Table 4 Descriptive statistics of the variables of interest
Year / N* QTOBIN EV PROP1 (%) CON1 (%) LnVPROP1
Average
2001 / 89 0.67 0.59 39.81 57.14 11.92
2002 / 92 0.59 0.54 38.51 57.09 11.71
2003 / 91 0.68 0.61 42.53 60.55 11.81
2004 / 98 0.84 0.76 47.32 65.96 12.46
2005 / 105 0.93 0.85 43.41 61.21 12.45
2006 / 107 1.06 0.97 41.69 57.53 12.57
2007 / 126 1.35 1.26 41.36 57.52 12.80
2008 / 153 1.05 0.93 41.65 53.96 12.63
2009 / 166 0.98 0.91 40.23 50.05 12.57
2010 / 172 1.10 1.00 39.23 50.30 12.71
Year / N* QTOBIN EV PROP1 (%) CON1 (%) LnVPROP1
Total Sample
Average 0.96 0.87 41.38 56.18 12.43
Standard deviation 0.63 0.63 23.62 26.58 1.94
1st Quartile 0.59 0.51 22.20 34.30 11.23
Median 0.82 0.73 36.10 53.90 12.51
3rd Quartile 1.16 1.08 56.20 78.60 13.76
N* 237 237 237 237 237
Obs** 1199 1199 1199 1199 1199
(*): number of companies; (**): number of observations.
The variables of interest in the study are the indicators for a) corporate market value: Tobin’s Q (QTOBIN) and Enterprise Value over Total Assets (EV), and b) concentration of the ownership and control structure: percentage of total shares held by the largest shareholder (PROP1), percentage of common shares held by the largest shareholder (CON1), and natural logarithm of the market value, corrected by IGP-M, of the total shares held by the largest shareholder (LnVPROP1).
continued
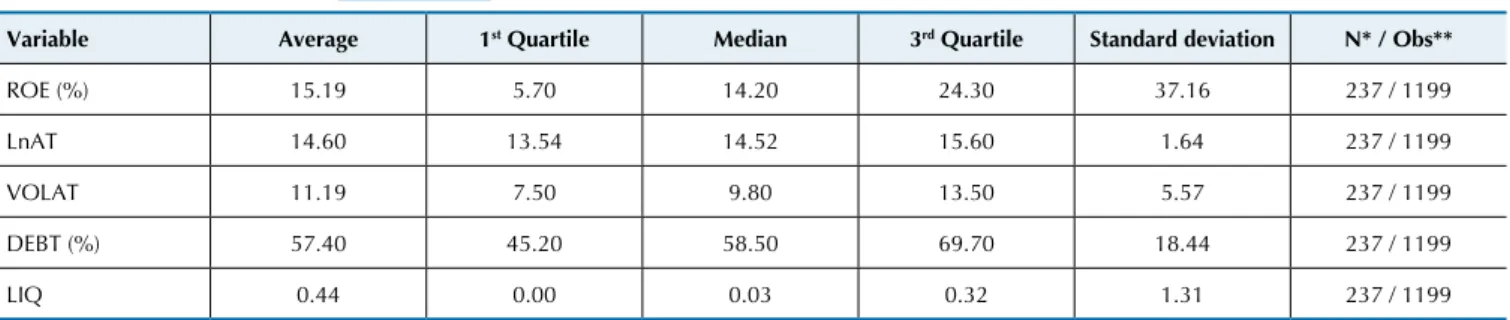
Table 5 Descriptive statistics of the quantitative control variables
Variable Average 1st Quartile Median 3rd Quartile Standard deviation N* / Obs**
ROE (%) 15.19 5.70 14.20 24.30 37.16 237 / 1199
LnAT 14.60 13.54 14.52 15.60 1.64 237 / 1199
VOLAT 11.19 7.50 9.80 13.50 5.57 237 / 1199
DEBT (%) 57.40 45.20 58.50 69.70 18.44 237 / 1199
LIQ 0.44 0.00 0.03 0.32 1.31 237 / 1199
(*): number of companies; (**): number of observations.
The following quantitative control variables were used: Return on Equity (ROE), company size (LnAT), volatility of stock returns (VOLAT), debt (DEBT), and
stock liquidity (LIQ).
With respect to the variables for market value, it is noted that, on average, the Brazilian companies were relatively undervalued because Tobin’s Q (QTOBIN)
and the Enterprise Value over Total Assets (EV) sho-wed average values below 1.0 for the total sample.
Table 6 Descriptive statistics of the qualitative control variables
FP State NP Family PF FI IGC
Average 17.60% 5.42% 26.77% 41.37% 5.67% 3.17% 38.53%
Frequency (X=1)* 211 65 321 496 68 38 462
Obs** 1199 1199 1199 1199 1199 1199 1199
N*** 237 237 237 237 237 237 237
(*): number of observations for the binary variable with value of 1; (**): number of total observations; (***): number of companies.
The following qualitative control variables were used: dummies for type of controlling shareholder (foreign private (FP), State, national private (NP), family, pension fund (PF), or inancial institution (FI)); and a dummy for participation in the Special Corporate Governance Stock Index of the BM&FBovespa (IGC).
Regarding the binary variables for the type of con-trolling shareholder, it is clear that on average, 41.37% of the observations were for companies that had a founding family or individual investor as the largest shareholder. The significant participation of foreign and national (non-family) controllers is also noted, which represen-ted 17.60% and 26.77% of the total sample, respectively. Moreover, a small number was observed for organiza-tions under control by the State (5.42%), pension funds (5.67%), and financial institutions (3.17%), which does
not indicate an absence of shareholder participation in these groups but only indicates that, on average, they were not the largest owners of the companies.
4.1 Impact of Ownership and Control
Concentration on Firm Market Value
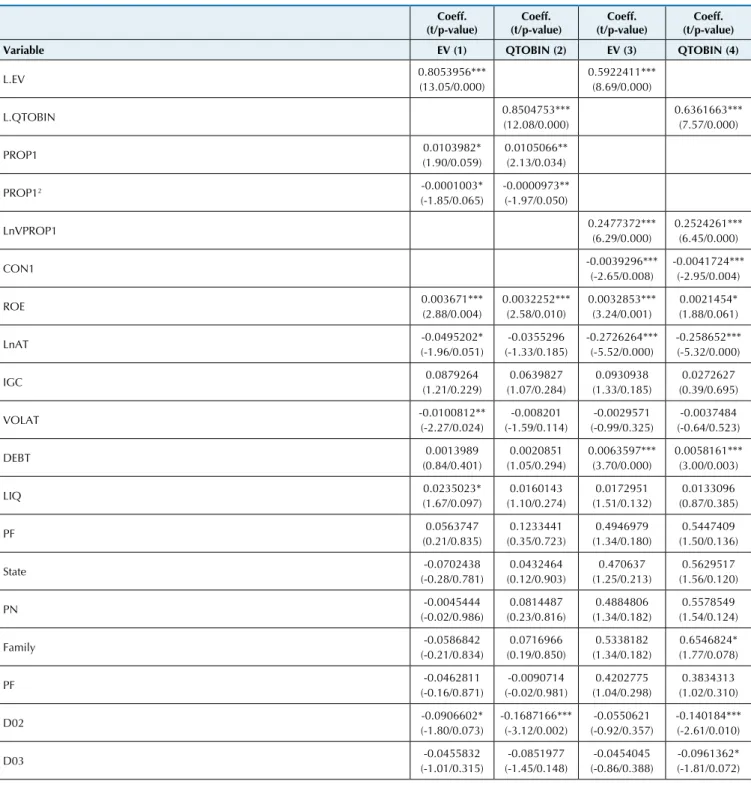
Table 7 shows the results for the dynamic multiple linear regression models estimated by Sys-GMM. Four specifications were tested to ascertain whether concen-tration of the ownership and control structure influen-ces corporate market value. The specifications can be divided into two groups according to the independent variables of ownership concentration used: PROP1 (in-centive effect) and PROP12 (entrenchment effect); or LnVPROP1 (incentive effect) and CON1 (entrench-ment effect).
First, the results show that for all the specifications, the variables QTOBIN and EV were positively influen-ced by the lagged values (L.QTOBIN and L.EV) at a
significance level of 1%. These data suggest an inertial behavior for firm market value.
The variables PROP1 and PROP12 positively and negatively influenced, respectively, the values of Tobin’s Q (QTOBIN) and Enterprise Value over Total Assets (EV) at a significance level of at least 10%. The-refore, these results indicate that ownership concen-tration impacts corporate market value quadratically, corroborating the conclusions of García-Meca and Sánchez-Ballesta (2011). According to the coefficients obtained, the optimal level of cash flow rights concen-tration that maximizes the marginal market value was 53.99% (−0.0105066 / (2 × −0.0000973)) and 51.84% (−0.0103982 / (2 × −0.0001003)) in the specifications that used QTOBIN and EV respectively.
Table 7 Relationship between concentration of the ownership structure and corporate market value
Coeff. (t/p-value)
Coeff. (t/p-value)
Coeff. (t/p-value)
Coeff. (t/p-value)
Variable EV (1) QTOBIN (2) EV (3) QTOBIN (4)
L.EV 0.8053956***(13.05/0.000) 0.5922411*** (8.69/0.000)
L.QTOBIN 0.8504753***
(12.08/0.000)
0.6361663***
(7.57/0.000)
PROP1 0.0103982*
(1.90/0.059)
0.0105066** (2.13/0.034)
PROP12 -0.0001003*
(-1.85/0.065) -0.0000973**(-1.97/0.050)
LnVPROP1 0.2477372***(6.29/0.000) 0.2524261***(6.45/0.000)
CON1 -0.0039296***(-2.65/0.008) -0.0041724***
(-2.95/0.004)
ROE 0.003671***
(2.88/0.004)
0.0032252***
(2.58/0.010)
0.0032853*** (3.24/0.001)
0.0021454*
(1.88/0.061)
LnAT (-1.96/0.051)-0.0495202* (-1.33/0.185)-0.0355296 -0.2726264***
(-5.52/0.000)
-0.258652*** (-5.32/0.000)
IGC 0.0879264
(1.21/0.229)
0.0639827
(1.07/0.284)
0.0930938
(1.33/0.185) (0.39/0.695)0.0272627
VOLAT -0.0100812**
(-2.27/0.024)
-0.008201 (-1.59/0.114)
-0.0029571
(-0.99/0.325) (-0.64/0.523)-0.0037484
DEBT 0.0013989
(0.84/0.401)
0.0020851 (1.05/0.294)
0.0063597***
(3.70/0.000) 0.0058161***(3.00/0.003)
LIQ (1.67/0.097)0.0235023* 0.0160143
(1.10/0.274)
0.0172951
(1.51/0.132) (0.87/0.385)0.0133096
PF (0.21/0.835)0.0563747 (0.35/0.723)0.1233441 (1.34/0.180)0.4946979 (1.50/0.136)0.5447409
State -0.0702438
(-0.28/0.781)
0.0432464
(0.12/0.903) (1.25/0.213)0.470637 (1.56/0.120)0.5629517
PN (-0.02/0.986)-0.0045444 (0.23/0.816)0.0814487 (1.34/0.182)0.4884806 0.5578549
(1.54/0.124)
Family (-0.21/0.834)-0.0586842 0.0716966
(0.19/0.850)
0.5338182
(1.34/0.182) (1.77/0.078)0.6546824*
PF (-0.16/0.871)-0.0462811 -0.0090714
(-0.02/0.981)
0.4202775 (1.04/0.298)
0.3834313 (1.02/0.310)
D02 (-1.80/0.073)-0.0906602* -0.1687166***(-3.12/0.002) (-0.92/0.357)-0.0550621 -0.140184*** (-2.61/0.010)
D03 (-1.01/0.315)-0.0455832 -0.0851977
(-1.45/0.148)
-0.0454045
(-0.86/0.388) (-1.81/0.072)-0.0961362*
Coeff. (t/p-value)
Coeff. (t/p-value)
Coeff. (t/p-value)
Coeff. (t/p-value)
Variable EV (1) QTOBIN (2) EV (3) QTOBIN (4)
D04 (0.21/0.831)0.009593 (-0.58/0.565)-0.0325793 (-0.85/0.395)-0.0407181 -0.0692192
(-1.45/0.150)
D05 (-0.38/0.701)-0.0198146 -0.0695299
(-1.29/0.198)
-0.0589068 (-1.32/0.188)
-0.1120271**
(-2.31/0.022)
D06 (-0.11/0.916)-0.0053127 (-1.33/0.185)-0.0800153 (-0.85/0.395)-0.0399549 -0.1180225**
(-2.57/0.011)
D07 0.2212194***
(4.51/0.000)
0.1687406***
(3.02/0.003) 0.1247319***(2.80/0.006) (1.40/0.162)0.0697737
D08 -0.3176008***
(-4.55/0.000)
-0.3846597***
(-4.83/0.000) -0.3164057***(-4.89/0.000)
-0.3558322*** (-5.06/0.000)
D09 (-1.56/0.119)-0.0514074 -0.1870383***(-4.61/0.000) -0.0689921**(-2.23/0.027) -0.1844996*** (-5.15/0.000)
Cons. 0.6945461
(1.44/0.152)
0.3835365
(0.74/0.459)
0.6343406
(1.13/0.260) (0.97/0.333)0.4467305
1st Order/AR(1) (Pr > z) 0.000 0.000 0.002 0.003
2nd Order/ AR(2) (Pr > z) 0.342 0.515 0.491 0.752
Hansen J overidentiication test (Prob > chi-squared) 1.000 1.000 1.000 1.000
Instruments in differences (excluding the instruments of Sys-GMM) (Prob > chi-squared) 0.968 0.950 0.893 0.968
Instruments of Sys-GMM (Prob > chi-squared) 1.000 1.000 1.000 1.000
Instruments of Sys-GMM (excluding the standardized instruments “IV”) (Prob >
chi-squared) 1.000 1.000 1.000 1.000
Standardized instruments “IV” (Prob > chi-squared) 0.324 0.358 1.000 0.285
R2 0.7475 0.7511 0.7588 0.7633
Number of instruments 228 228 228 228
Number of observations / Number of companies 870 / 237 870 / 237 870 / 237 870 / 237
The dependent variables are Enterprise Value over Total Assets (EV) and Tobin’s Q (QTOBIN). The independent variables of interest are the percentage of total shares held by the largest shareholder (PROP1), its quadratic term (PROP12), the natural logarithm of market value, corrected by IGP-M, of the total
shares held by the largest shareholder (LnVPROP1), and the percentage of common shares held by the largest shareholder (CON1). The set of control
varia-bles includes the irst lag of corporate market value (L.EV or L.QTOBIN), Return on Equity (ROE), company size (LnAT), the binary variable for participating in the Special Corporate Governance Stock Index of the BM&FBovespa (IGC), volatility of stock returns (VOLAT), debt (DEBT), stock liquidity (LIQ), dummy variables for the type of largest shareholder (foreign private (FP), State, national private (NP), family, pension fund (PF), or inancial institution (FI)), and the binary annual variables (D). The variables D01 and FI were not used to avoid colinearity problems. The variable D10 was excluded by Stata for colinearity
problems. The two-step, robust (Windmeijer standard error correction (2005)), and small (correction for small samples, resulting in a t statistic instead of a z
statistic for the coeficients) commands were used to make the estimation even more robust. Signiicance: ***(1%); **(5%); *(10%). continued
The p-values in the models that used the variables LnVPROP1 and CON1 show that those variables in-fluence market value (both QTOBIN and EV) at the 1% significance level. Because it is a log-linear function, ce-teris paribus, a 10% increase in the market value of the total shares held by the largest shareholder increased QTOBIN by 2.63% (((0.1 × 0.2524261) / 0.96) × 100%) and EV by 2.85% (((0.1 × 0.2477372) / 0.87) × 100%), on average. In turn, ceteris paribus, a 10% increase in voting rights concentration reduced QTOBIN by 4.35% (((10 × −0.0041724) / 0.96) × 100%) and EV by 4.52% (((10 × −0.0039296) / 0.87) × 100%), on average. These data suggest that LnVPROP1 managed to capture the alignment effect and CON1 captured the entrenchment effect of ownership and control concentration on ma-rket value, which strengthens the findings of Claessens et al. (2002).
Return on Equity (ROE) is noteworthy among the control variables because it positively affected the ma-rket value of companies in all equations. These results are consistent with those of Cho and Pucik (2005) and support the hypothesis that investors generally
con-sider accounting performance when faced with the trade-off between selling, buying, or maintaining their shares, prioritizing companies in their portfolios that earned more satisfactory accounting profits than other companies.
The control variables DEBT and LnAT were signifi-cant at the 1% level in the specifications that used LnV-PROP1 and CON1. The debt level positively influenced the market value of firms, as in research by Carvalhal-da-Silva and Leal (2003). The positive effect of debt can be tied to the tax benefits related to the deductibility of interest on debt for financial expenses, which could increase an organization´s value in the market. The size of the company negatively impacted market value (both QTOBIN and EV), as in the study by Gugler et al. (2008). This result indicates that large corporations can be subject to greater agency problems and therefore hi-gher monitoring costs, thereby reducing their market values.
1998). First, the Arellano/Bond first- and second-order test for autocorrelation in the residuals rejected and accepted, respectively, the null hypothesis of no serial correlation in all specifications, as required by Arella-no and Bond (1991).
Hansen´s overidentification test (J statistic) did not reject the null hypothesis that the instruments are valid in all models, both for conventional significance levels (1%, 5%, and 10%) and for the 25% level suggested by Roodman (2009). Additionally, the Difference-in-Han-sen test for the subsets of instruments (C statistic) did not reject the null hypothesis in any of the specifica-tions that instruments of each subgroup are exogenous at the 25% significance level.
Furthermore, due to moment conditions, although
Sys-GMM allows for correlation between the regres-sors and unobserved heterogeneity (ηi), the method as-sumes the correlation does not change between periods (T) (“steady state”) (Roodman, 2009). The validity of this condition, according to Roodman (2009), depends on the coefficient of the first lag of response variable being less than 1 (absolute value) (|β1| < 1.0), which was observed in all the models tested.
Finally, to control for the instrument proliferation, the laglimits (3 4) command was used in the xtabond2 tool, as indicated by Roodman (2006, 2009). This fea-ture collaborated for the quantity of instruments used in all the models (228) was significantly lower than the number of observations (870), ensuring the robustness of the results.
5 CONCLUSIONS
This study aimed to investigate whether ownership and control structure influences corporate market va-lue. Other national and international studies had the same goal. However, during the development of the theoretical foundation for this study, there were no studies on this subject in Brazil that used a ten-year time frame and tried to mitigate the feedback effect. Wintoki, Linck, and Netter (2012) recently named the feedback effect as dynamic endogeneity problem in studies that relate internal mechanisms of corporate governance and corporate performance. The authors found evidence that studies that used the Ordinary Le-ast Squares Method and/or Fixed and Random Effects procedures, such as those of Silveira, Lazana, Barros, and Famá (2004), Okimura, Silveira, and Rocha (2007), and Silveira, Barros, and Famá (2008), probably produ-ced biased parameters by not considering the feedback effect. Thus, the first contribution of this article in the national sphere refers to the use of dynamic multiple linear regression models estimated by Sys-GMM in an unbalanced panel from 2001 to 2010.
Different variables were tested to capture the in-centive effect and entrenchment effect. The results of the first two specifications signaled a quadratic rela-tionship between ownership concentration (PROP1) and corporate market value and therefore corroborated the hypothesis of a non-monotonic relationship be-tween ownership structure and corporate performance shown by Morck et al. (1988), Stulz (1988), Okimura et al. (2007), García-Meca and Sánchez-Ballesta (2011), among others.
More specifically, the largest shareholder´s increa-sed participation in cash flow rights increaincrea-sed Tobin´s Q until approximately 53.99%. After that point, incre-ased stock accumulation by the largest shareholder decreased corporate market value. When Enterprise Value over Total Assets was used, the optimal concen-tration level was 51.85%. Based on these results, one can assume that ownership concentration initially has a positive impact on market value due to the possibility
that the largest shareholder can efficiently monitor the management, which demonstrates to the market gre-ater alignment between shareholder and manager in-terests. However, above the optimum point of equity interest, increased ownership concentration indicates, at least to the market, a greater likelihood of expro-priating wealth from minority shareholders due to the entrenchment effect.
In the two other applied models, a positive rela-tionship was found between the corrected market value of the total shares held by the largest shareholder (Ln-VPROP1) and the metrics for Tobin´s Q and Enterprise Value over Total Assets. This result suggests that LnV-PROP1 can more directly capture the incentive effect. The greater the value of LnVPROP1, the more substan-tial is the loss that the largest shareholder faces with an eventual devaluation of shares, and, therefore, the greater his commitment to firm performance. Gugler et al. (2008) were the first to propose using the market va-lue of the shares held by officers and directors, instead of their shareholdings, to capture the alignment effect. Given the high concentration of the ownership and control structure in Brazilian companies, the corrected market value of the total shares held by the largest shareholder was used with the same goal in this study, representing the second contribution of this article.
With respect to the last two specifications tested, the percentage of common shares held by the largest sha-reholder (CON1) negatively influenced both Tobin´s Q and Enterprise Value over Total Assets, which streng-thens the conclusions of Claessens et al. (2002). There-fore, an increase in voting rights of the largest sharehol-der reduced firm market value. Based on this result and due to the high concentration in the control structure of Brazilian companies, it can be inferred that for ma-rket an increase in CON1 means that the largest sha-reholder has greater control over the decision-making process and therefore a greater possibility of expropria-ting wealth from minority shareholders.
di-rect ownership and control concentration and not inclu-ding variables related to directors’ and officers’
sharehol-dings. Future work could use the indirect ownership and control structure and models with structural equations.
Andrade, A., & Rossetti, J. P. (2006). Governança corporativa: fundamentos, desenvolvimento e tendências (2a ed.). São Paulo: Atlas.
Arellano, M., & Bond, S. (1991). Some tests of speciication for panel data: Monte Carlo evidence and an application to employment equations.
he Review of Economic Studies, 58 (2), 277-297.
Arellano, M., & Bover, O. (1995). Another look at the instrumental variables estimation of error-components models. Journal of Econometrics, 68 (1), 29-51.
Azofra, V., & Santamaría, M. (2011). Ownership, control, and pyramids in Spanish commercial banks. Journal of Banking & Finance, 35 (6), 1464-1476.
Barros, L. A. B. C., Castro Júnior, F. H. F., Silveira, A. D. M., & Bergmann, D. R. (2010). Endogeneity in Corporate Finance Empirical Research.
Working Paper. Recuperado em 09 setembro, 2011, de http://papers.
ssrn.com/abstract=1593187.
Berle, A. A., & Means, G. C. (1932). he modern corporation and private property. New York: Harcourt, Brace & World.
Black, B. S., Jang, H., & Kim, W. (2006). Does corporate governance predict irms’ market values? Evidence from Korea. he Journal of Law, Economics, & Organization, 22 (2), 363-413.
Blundell, R., & Bond, S. (1998). Initial conditions and moment restrictions in dynamic panel data models. Journal of Econometrics, 87 (1), 115–143.
Bolsa de Valores, Mercadorias e Futuros de São Paulo. BM&FBovespa. (2001). Metodologia completa do IGC. Recuperado em 09 março, 2011, de http://www.bmbovespa.com.br/Indices/download/IGC.pdf. Börsch-Supan, A., & Köke, J. (2002). An applied econometricians’ view of
empirical corporate governance studies. German Economic Review, 3
(3), 295-323.
Braouezec, Y. (2009). Financing constraint, over-investment and market-to-book ratio. Finance Research Letters, 6 (1), 13-22.
Carvalhal-da-Silva, A., & Leal, R. P. C. (2003). Corporate governance, market valuation and dividend policy in Brazil. Coppead Working Paper Series n. 390. Recuperado em 10 março, 2011, de http://ssrn.
com/abstract=477302.
Cho, H. J., & Pucik, V. (2005). Relationship between innovativeness, quality, growth, proitability, and market value. Strategic Management Journal, 26 (6), 555-575.
Chung, K., & Pruitt, S. (1994). A simple approximation of Tobin's Q.
Financial Management, 23 (3), 70-74.
Claessens, S., Djankov, S., Fan, J. P. H., & Lang, L. H. P. (2002). Disentangling the incentive and entrenchment efects of large shareholdings. he Journal of Finance, 57 (6), 2741-2771. Claessens, S., Djankov, S., & Lang, L. H. P. (2000). he separation of
ownership and control in East Asian Corporations. Journal of Financial Economics, 58 (1-2), 81-112.
Claessens, S., & Fan, J. P. H. (2002). Corporate governance in Asia: a survey. International Review of Finance, 3 (2), 71-103.
Demsetz, H., & Lehn, K. (1985). he structure of corporate ownership: causes and consequences. Journal of Political Economy, 93 (6), 1155-1177. Demsetz, H., & Villalonga, B. (2001). Ownership structure and corporate
performance. Journal of Corporate Finance, 7 (3), 209-233.
Drakos, A. A., & Bekiris, F. V. (2010). Corporate performance, managerial ownership and endogeneity: a simultaneous equations analysis for the Athens stock exchange. Research in International Business and Finance, 24 (1), 24-38.
Fahlenbrach, R., & Stulz, R. M. (2009). Managerial ownership dynamics and irm value. Journal of Financial Economics, 92 (3), 342-361. García-Meca, E., & Sánchez-Ballesta, J. P. (2011). Firm value and
ownership structure in Spanish capital market. Corporate Governance,
11 (1), 41-53.
Gorga, E. (2008). Changing the paradigm of stock ownership from concentrated towards dispersed ownership? Evidence from Brazil and consequences for emerging countries. Cornell Law Faculty Publications, Paper n. 42. Recuperado em 20 março, 2011, de http:// scholarship.law.cornell.edu/clsops_papers/42/.
Gugler, K., Mueller, D. C., & Yurtoglu, B. B. (2008). Insider ownership, ownership concentration and investment performance: an international comparison. Journal of Corporate Finance, 14 (5), 688-705.
Himmelberg, C. P., Hubbard, R. G., & Palia, D. (1999). Understanding the determinants of managerial ownership and link between ownership and irm performance. Journal of Financial Economics, 53 (3), 353-384. Jensen, M. C., & Meckling, W. H. (1976). heory of the irm: managerial
behavior, agency costs and ownership structure. Journal of Financial Economics, 3 (4), 305-360.
Klapper, L. F., & Love, I. (2004). Corporate governance, investor protection, and performance in emerging markets. Journal of Corporate Finance, 10 (5), 703-728.
La Porta, R., Lopez-de-Silanes, F., & Shleifer, A. (1999). Corporate ownership around the world. he Journal of Finance, 54 (2), 471-517. Leal, R. P. C., Carvalhal-da-Silva, A. L., & Valadares, S. M. (2002).
Estrutura de controle das companhias brasileiras de capital aberto.
Revista de Administração Contemporânea, 6 (1), 7-18.
Lins, K. V. (2003). Equity ownership and irm value in emerging market.
Journal of Financial and Quantitative Analysis, 38 (1), 159-184. Modigliani, F., & Miller, M. H. (1963). Corporate income taxes and the
cost of capital: a correction. he American Economic Review, 53 (3), 433-443.
Morck, R., Shleifer, A., & Vishny, R. W. (1988). Management ownership and market valuation: an empirical analysis. Journal of Financial Economics, 20 (1), 293-315.
Okimura, R. T., Silveira, A. D. M., & Rocha, K. C. (2007). Estrutura de propriedade e desempenho corporativo no Brasil. Revista de Administração Contemporânea, Eletrônica, 1 (1), 119-135.
Roodman, D. (2006). How to do xtabond2: an introduction to “Diference” and “System” GMM in Stata. Center for Global Development Working Paper n. 103. Recuperado em 26 junho, 2011, de http://ssrn.com/ abstract=982943.
Roodman, D. (2009). A note on the theme of too many instruments.
Oxford Bulletin of Economic and Statistics, 71 (1), 135-158. Silveira, A. D. M. (2010). Governança corporativa no Brasil e no mundo:
teoria e prática. Rio de Janeiro: Elsevier.
Silveira, A. D. M., Barros, L. A. B. C., & Famá, R. (2008). Atributos corporativos e concentração acionária no Brasil. Revista de Administração de Empresas – RAE, 48 (2), 51-66.
Silveira, A. D. M., Lazana, A. P., Barros, L. A., & Famá, R. (2004). Efeito dos acionistas controladores no valor das companhias abertas brasileiras. Revista de Administração da Universidade de São Paulo - RAUSP, 39 (4), 362-372.
Stulz, R. M. (1988). Managerial control of voting rights: inancing policies and market of corporate control. Journal of Financial Economics, 20
(1), 25-54.
Uno, J., & Kamiyama, N. (2009). Ownership structure, liquidity, and irm value: efects of the investment horizon. Working Paper, 2009.
Recuperado em 16 junho, 2011, de http://ssrn.com/abstract=1455995. Windmeijer, F. (2005). A inite sample correction for the variance of linear
eicient two-step GMM estimators. Journal of Econometrics, 126 (1), 25-51. Wintoki, M. B., Linck, J. S., & Netter, J. M. (2012). Endogeneity and the
dynamics of corporate governance. Journal of Financial Economics, 105 (3), 581-606.